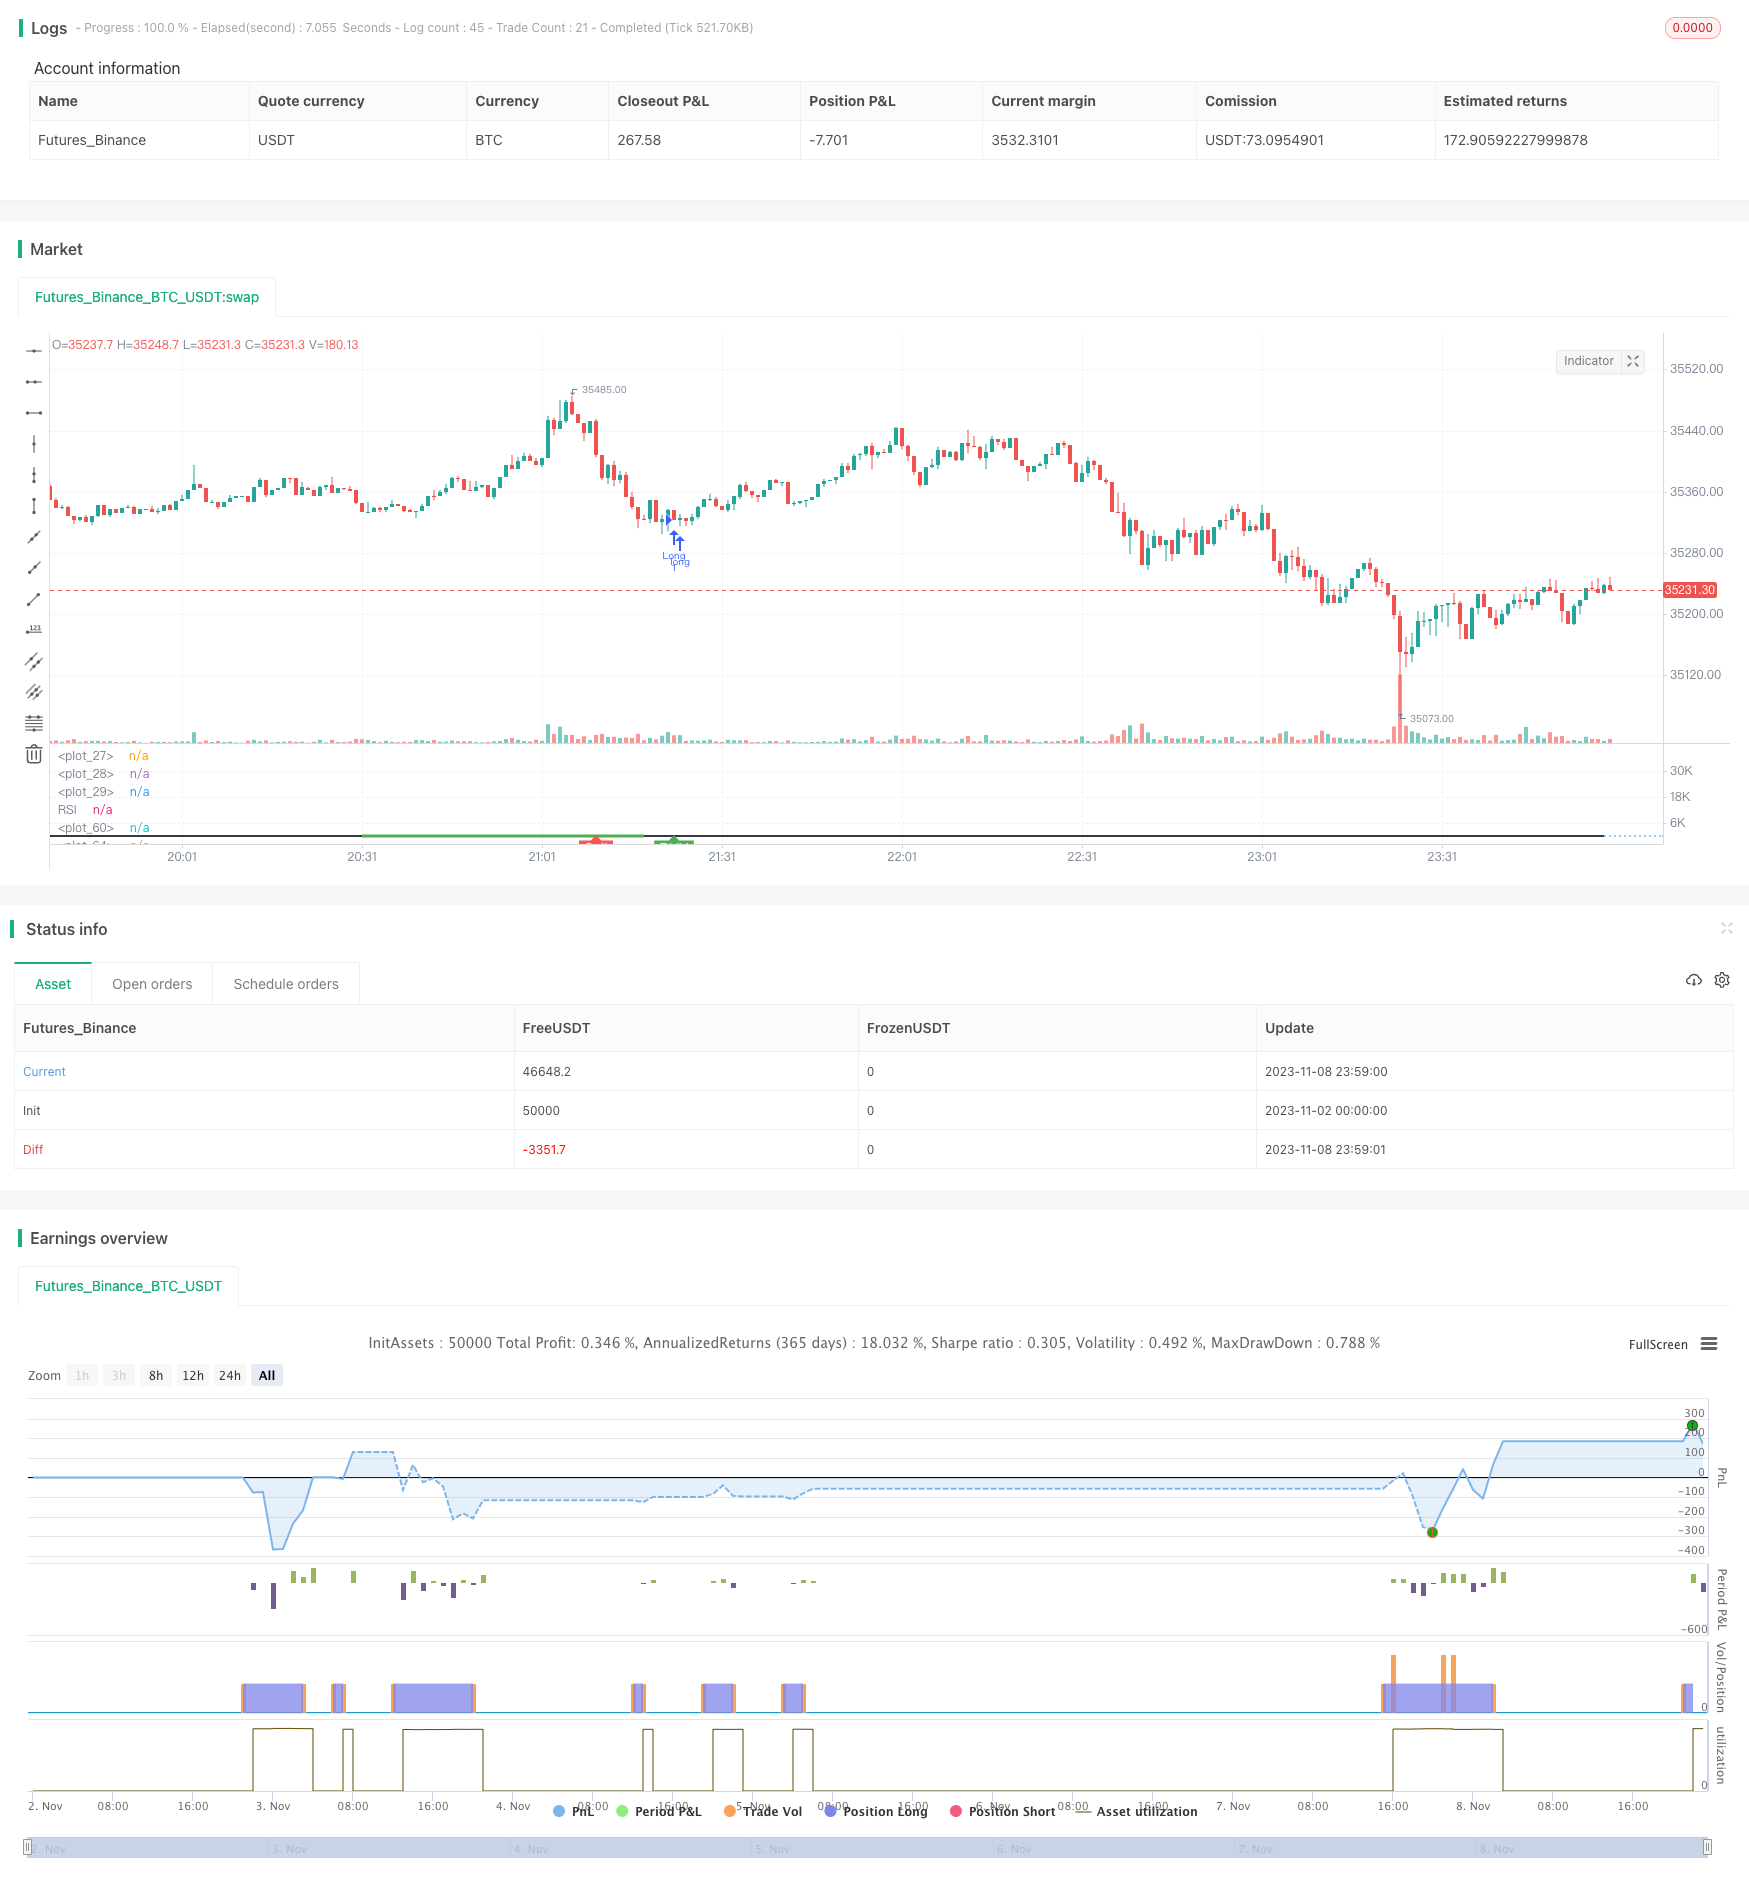
強気・弱気長期戦略

概要
この戦略は,RSIの多頭偏差を探して,短期間にビットコイン価格が上昇を反発する可能性があるタイミングを判断し,適切な買いタイミングを決定する.
戦略原則
RSIで多頭偏差の判断
- RSI指標パラメータを定義する (デフォルト14サイクル)
- RSIを計算する
- 複数の偏差があるか判断する.
- RSIは低点と低点を示しています.
- 価格が下がったり下がったりする
- RSIが上昇し,下がった.
- 価格の上昇と低落が起こりました
RSI値が限界値以下であるかどうかを判断する
- RSIの低点を定義し,限界値を決定する (デフォルト40).
- RSI値が,この限界値を下回っている場合,
閉盤値がスタートの低点から下がったかどうかを判断する
- もしそうなら,購入信号から離れてさらに確認してください.
終了条件を定義する
- 設定ストップ損失パーセント (デフォルトは5%)
- リストラした人の割合は リストラした人の割合と一致します
収益退出条件を定義する
- 設定RSI高点の決定門限値 (デフォルト75)
- RSIの上昇がこの限界に達すると,利益は撤退する.
優位分析
RSIで多頭偏移を判断し,短期的な反発のタイミングを効果的に捉える
RSIの低点判断と組み合わせて,反発する前に特定の買いポイントを決定できます.
取引のリスクと利益を管理するために,ストップとストップ条件を設定します.
この戦略は,大量のビットコインの實況取引におけるRSI指標の特性を参考に,ビットコインの短線に適しています.
戦略パラメータの設定は合理的で,異なる市場状況に適応し,実用化に有利である
リスク分析
RSI指標の誤差は,誤った判断によって取引損失を招く可能性があります.
単一の技術指標は偽信号を発生しやすいので,他の指標と組み合わせて使用する必要があります.
適切なパラメータ値を選択し,誤って設定すると,戦略のリターンに影響を及ぼす
複数の方向で取引する際には,大規模なトレンドに注目し,逆向きの操作を避ける必要があります.
取引費に注目し,取引頻度が最終利益に影響する
定期的に最適化パラメータを評価し,異なる市場に応じて戦略を調整する.
最適化の方向
移動平均線などの他の指標を追加し,フィルタリング条件を設定し,偽信号を減らすことを考慮することができます.
異なる周期のパラメータ設定をテストし,最適なパラメータの組み合わせを探します.
傾向の見直しを回避するために,より大きなレベルの傾向判断を組み合わせることができます.
ダイナミックなストップを設定し,利益が一定のレベルに達すると,ストップポイントを徐々に上げることができます.
特定のポジションの状況に応じて,異なるストップ・損失幅を設定できます.
機械学習などの技術を導入し,パラメータの自動最適化が可能
要約する
この戦略は,RSI指標の多頭偏移を捕捉し,ビットコインが短期間に反発する可能性があることを判断して,購入のタイミングを決定する.この戦略はシンプルで有効で,多くの実況体験を参考にしており,ビットコインのショートラインに適しています.しかし,単一の技術指標は偽信号を生じやすく,他の指標の組み合わせで使用する必要があります.同時に,パラメータ最適化,止損設定,取引コストなどの問題にも注意してください.
/*backtest
start: 2023-11-02 00:00:00
end: 2023-11-09 00:00:00
period: 1m
basePeriod: 1m
exchanges: [{"eid":"Futures_Binance","currency":"BTC_USDT"}]
*/

//@version=5
strategy("Bullish Divergence Short-term Long Trade Finder", overlay=false)

max_range = 50
min_range = 5
///pivot_left = 25
pivot_right = 5

//Inputs
src = input(close, title="Source")
rsiBearCondMin = input.int(50, title="RSI Bearish Condition Minimum")
rsiBearCondSellMin = input.int(60, title="RSI Bearish Condition Sell Min")
rsiBullCondMin = input.int(40, title="RSI Bull Condition Minimum")
pivot_left = input.int(25, title="Look Back this many candles")
SellWhenRSI = input.int(75, title="RSI Sell Value")
StopLossPercent = input.int(5, title="Stop loss Percentage")
rsiPeriod = input.int(14, title="RSI Length")
rsiOversold = input.int(30, title="RSI Oversold Level")
rsiOverbought = input.int(70, title="RSI Overbought Level")

//RSI Function/ value
rsi_value = ta.rsi(src, rsiPeriod)
rsi_hour = request.security(syminfo.tickerid,'60',rsi_value)
rsi_4hour = request.security(syminfo.tickerid,'240',rsi_value)
rsi_Day = request.security(syminfo.tickerid,'D',rsi_value)
plot(rsi_value, title="RSI", linewidth = 2, color = color.black, display =display.all)
hline(50, linestyle = hline.style_dotted)
rsi_ob = hline(70, linestyle=hline.style_dotted)
rsi_os = hline(30, linestyle=hline.style_dotted)
fill(rsi_ob, rsi_os, color.white)
SL_percent = (100-StopLossPercent)/100

pivot_low_true = na(ta.pivotlow(rsi_value, pivot_left, pivot_right)) ? false : true

//create a function that returns truee/false
confirm_range(x) =>
    bars = ta.barssince(x == true) //counts the number of bars since thee last time condition was true
    min_range <= bars and bars <= max_range // makees sure bars is less than max_range(50) and greater than min_range(5)


// RSI higher check / low check
RSI_HL_check = rsi_value<rsiBullCondMin and rsi_value > ta.valuewhen(pivot_low_true and rsi_value<rsiBullCondMin, rsi_value,1) and confirm_range(pivot_low_true[1])

// price check for lower low
price_ll_check = low < ta.valuewhen(pivot_low_true, low, 1)

bullCond = price_ll_check and RSI_HL_check and pivot_low_true

//pivot_high_true = na(ta.pivothigh(rsi_value, pivot_left, pivot_right))  ? false : true
pivot_high_true = na(ta.pivothigh(rsi_value, pivot_left, pivot_right))   ? false : true

// RSI Lower check / high check ensuring that the RSI dips below 30 to start divergence
RSI_LH_check = rsi_value < ta.valuewhen(pivot_high_true and rsi_value>rsiBearCondMin, rsi_value,1) and confirm_range(pivot_high_true[1]) //and rsi_value[pivot_right] >= 65

// price check for lower low
price_hh_check = high > ta.valuewhen(pivot_high_true, high, 1)

bearCond = price_hh_check and RSI_LH_check and pivot_high_true and rsi_value[3] > rsiBearCondSellMin

plot(pivot_low_true ? rsi_value : na, offset=-5, linewidth=3, color=(bullCond ? color.green : color.new(color.white, 100)))

plotshape(bullCond ? rsi_value : na , text = "BUY", style =  shape.labelup, location = location.absolute, color = color.green, offset =0, textcolor = color.white )

plot(pivot_low_true ? rsi_value : na, offset=-5, linewidth=3, color=(bearCond ? color.red : color.new(color.white, 100)))

plotshape(bearCond ? rsi_value : na , text = "Sell", style =  shape.labelup, location = location.absolute, color = color.red, offset =0, textcolor = color.white )
//[bbUpperBand, bbMiddleBand, bbLowerBand] = ta.bb(src, bbPeriod, bbDev)

//Entry Condition
longCondition = false

//bullEntry = bullCond and RSI_HL_check and confirm_range(pivot_low_true[1])
if bullCond and close < ta.valuewhen(pivot_low_true, low, 1) and rsi_hour <40 ///and rsi_4hour<40 //and rsi_Day<50
    strategy.entry("Long", strategy.long)

//Exit Condition
if (strategy.position_size > 0 and close < strategy.position_avg_price*SL_percent)
    strategy.close("Long")
if (strategy.position_size > 0 and (rsi_value > SellWhenRSI or bearCond))
    strategy.close("Long")