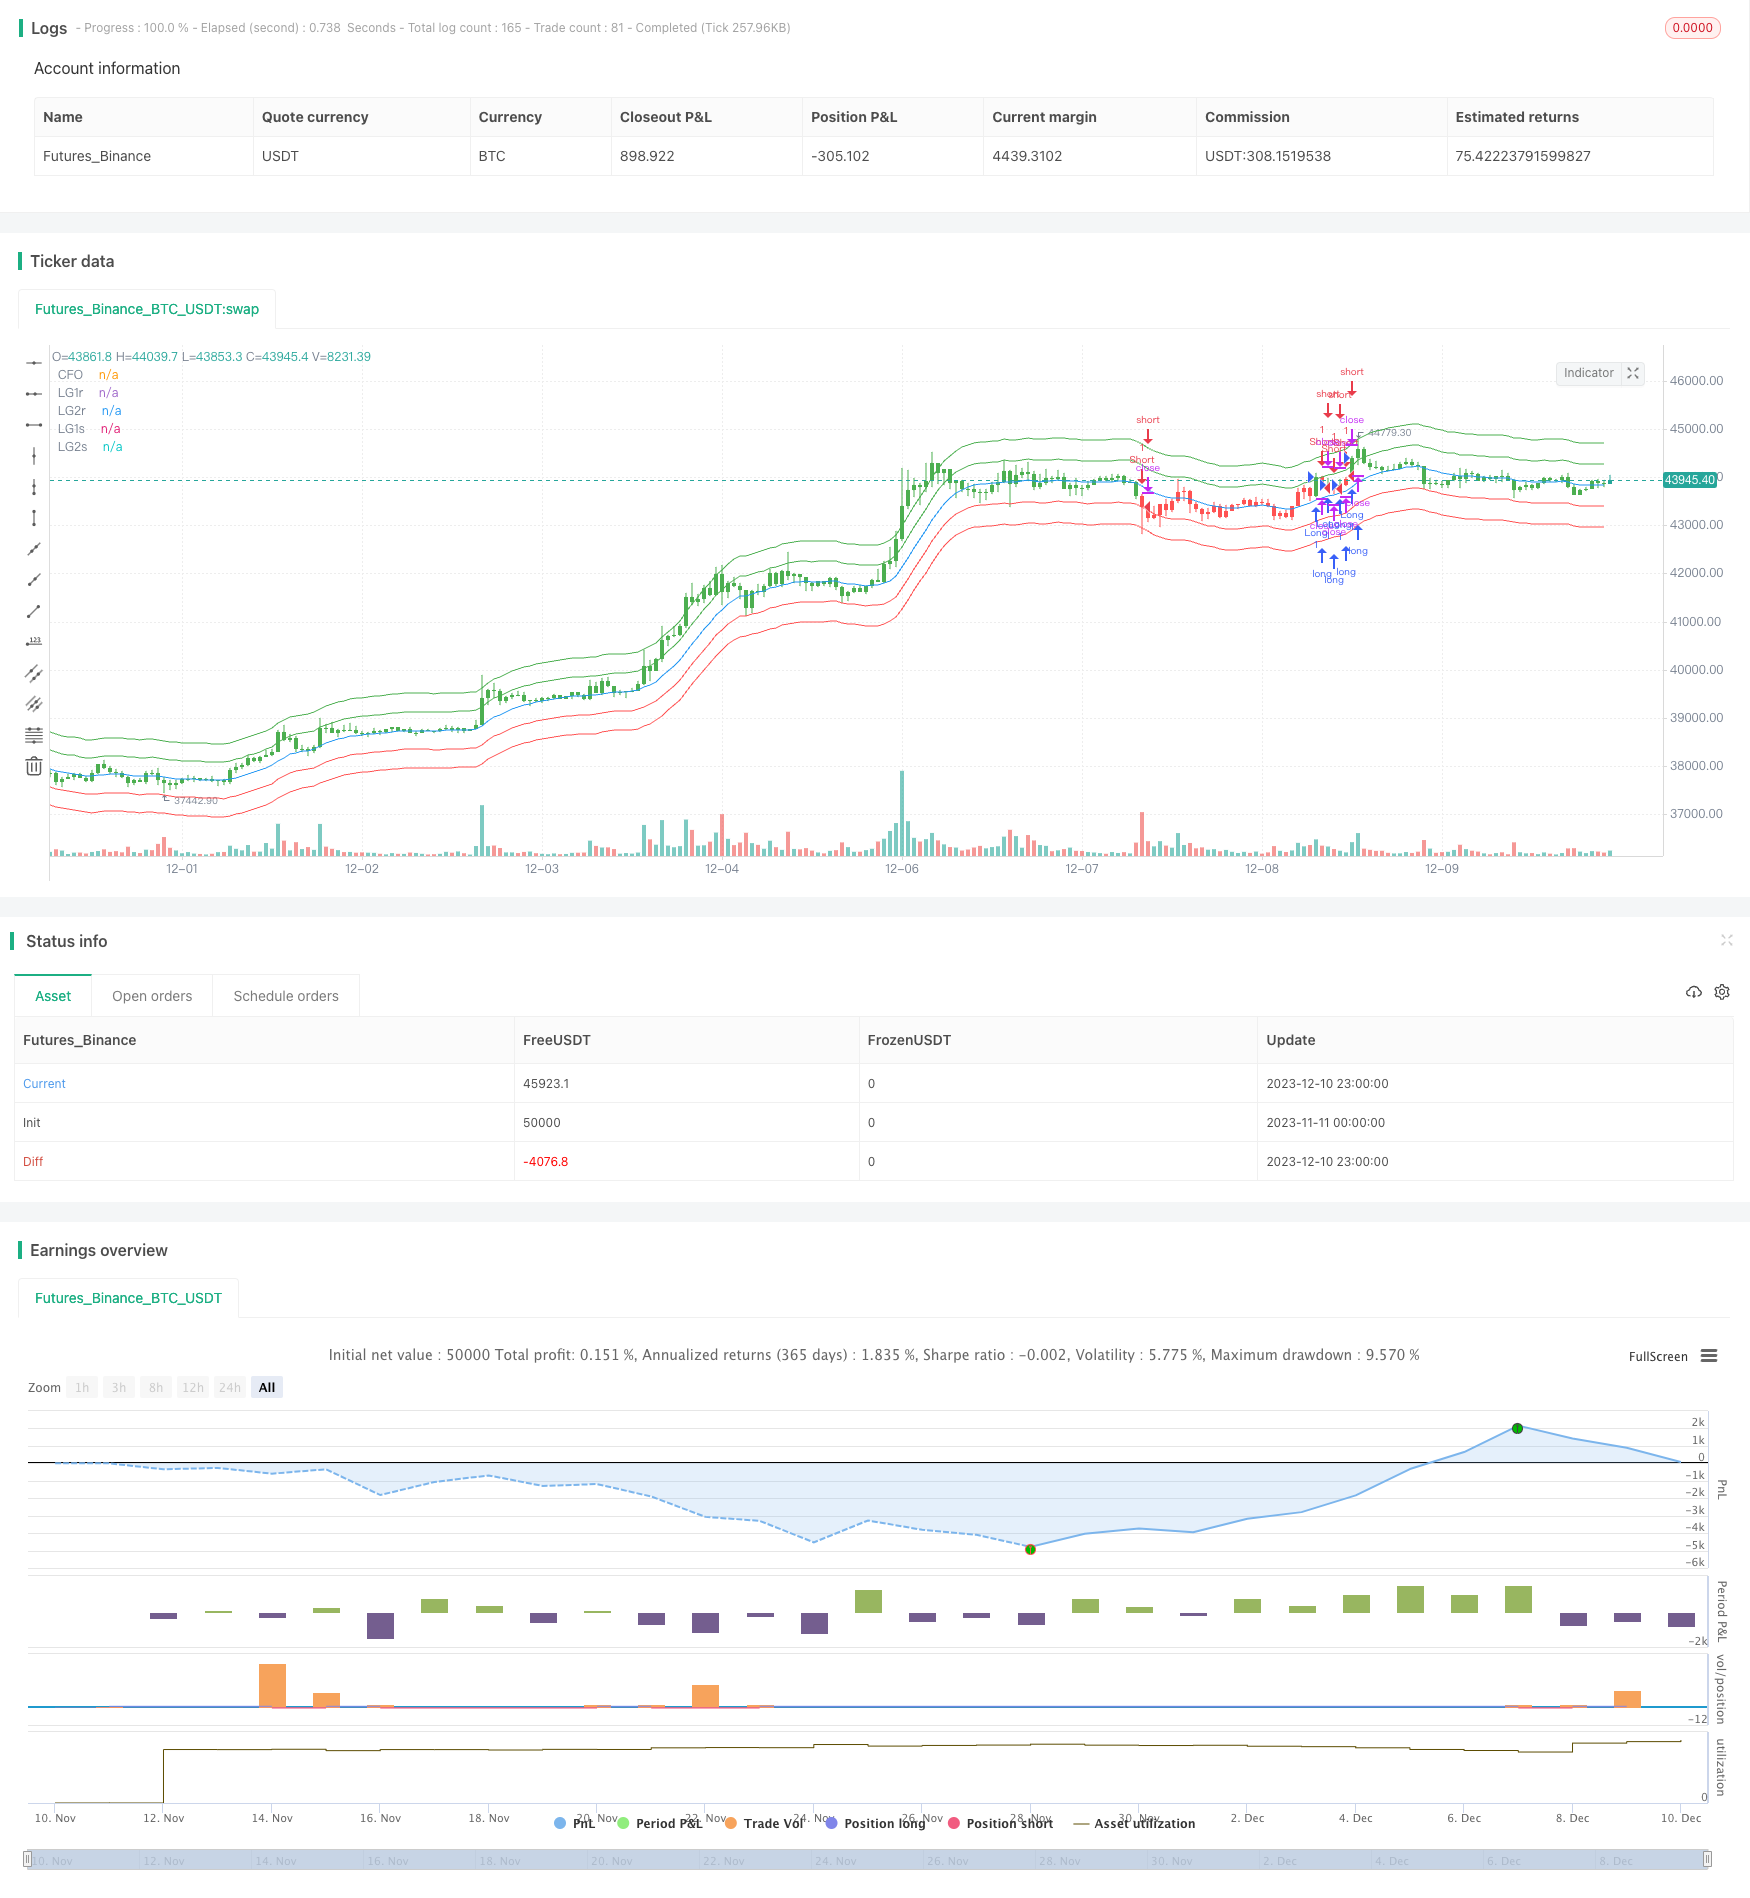
重心バックテスト取引戦略
作成日:
2023-12-12 16:56:51
最終変更日:
2023-12-12 16:56:51
コピー:
0
クリック数:
696
1
フォロー
1627
フォロワー

概要
重心反測取引戦略は,移動平均に基づく取引戦略である. 重心位置である価格のの中心を計算し,価格通路を資産の価格の通路として構築する. この戦略は,入力設定で多値と空値に変更することができる.
戦略原則
この策略は,重心位置を線形回帰関数で計算する.具体的には,長さがLength周期の収束価格の線形回帰値,すなわち価格の中心を計算する.そして,その基礎で上下に%を移動して価格チャネルを構成する.価格チャネル上の下辺は,順番に,プラスとマイナス信号として働く.価格が軌道上を突破する時,プラスをする.価格が軌道下を突破する時,マイナスを行う.
優位分析
この戦略は非常にシンプルで,以下の利点があります.
- プロジェクトを運営する際には,考えが明確で,理解しやすいことが必要です.
- テスト結果は良好で,戦闘可能性はある.
- パラメータ設定は柔軟で,パラメータを調整することで異なる市場環境に対応できます.
- 設定可能な反転方式で,両方向操作に適しています.
リスク分析
この戦略にはいくつかのリスクがあります.
- 回測の過程で過適合の危険があるかもしれない.実体のパラメータは再最適化が必要である.
- 突破に失敗すると,大きな損失を招く可能性があります.
- 取引の頻度が高く,資金使用率をコントロールする必要があります.
バンド,Lengthなどのパラメータを調整することでリスクを制御できます.最大損失を制限するためにストップロスを設定することもできます.
最適化の方向
この戦略はさらに改善できます.
- トレンド指数とフィルター信号を組み合わせ,逆転取引を避ける.
- 損失防止の仕組みを増やすこと
- パラメータ設定を最適化し,収益率を上げます.
- ポジションコントロールを高め,リスクを減らす.
要約する
重心回測取引戦略は,単純な突破策である. 明確な思考,強力な実戦性,柔軟なパラメータ設定がある. 同時に,一定のリスクがあり,適切な最適化制御が必要である. この戦略は,基本的な戦略として実戦と最適化に適応し,初心者学習にも適している.
ストラテジーソースコード
/*backtest
start: 2023-11-11 00:00:00
end: 2023-12-11 00:00:00
period: 1h
basePeriod: 15m
exchanges: [{"eid":"Futures_Binance","currency":"BTC_USDT"}]
*/

//@version=2
////////////////////////////////////////////////////////////
//  Copyright by HPotter v1.0 15/03/2018
// The indicator is based on moving averages. On the basis of these, the
// "center" of the price is calculated, and price channels are also constructed,
// which act as corridors for the asset quotations.
//
// You can change long to short in the Input Settings
// WARNING:
//  - For purpose educate only
//  - This script to change bars colors.
////////////////////////////////////////////////////////////
strategy(title="Center Of Gravity Backtest", shorttitle="CFO", overlay = true)
Length = input(20, minval=1)
m = input(5, minval=0)
Percent = input(1, minval=0)
SignalLine = input(1, minval=1, maxval = 2, title = "Trade from line (1 or 2)")
reverse = input(false, title="Trade reverse")
xLG = linreg(close, Length, m)
xLG1r = xLG + ((close * Percent) / 100)
xLG1s = xLG - ((close * Percent) / 100)
xLG2r = xLG + ((close * Percent) / 100) * 2
xLG2s = xLG - ((close * Percent) / 100) * 2
xSignalR = iff(SignalLine == 1, xLG1r, xLG2r)
xSignalS = iff(SignalLine == 1, xLG1s, xLG2s)
pos = iff(close > xSignalR, 1,
       iff(close < xSignalS, -1, nz(pos[1], 0)))
possig = iff(reverse and pos == 1, -1,
          iff(reverse and pos == -1, 1, pos))
if (possig == 1)
    strategy.entry("Long", strategy.long)
if (possig == -1)
    strategy.entry("Short", strategy.short)
barcolor(possig == -1 ? red: possig == 1 ? green : blue )
plot(xLG, color=blue, title="CFO")
plot(xLG1r, color=green, title="LG1r")
plot(xLG2r, color=green, title="LG2r")
plot(xLG1s, color=red, title="LG1s")
plot(xLG2s, color=red, title="LG2s")