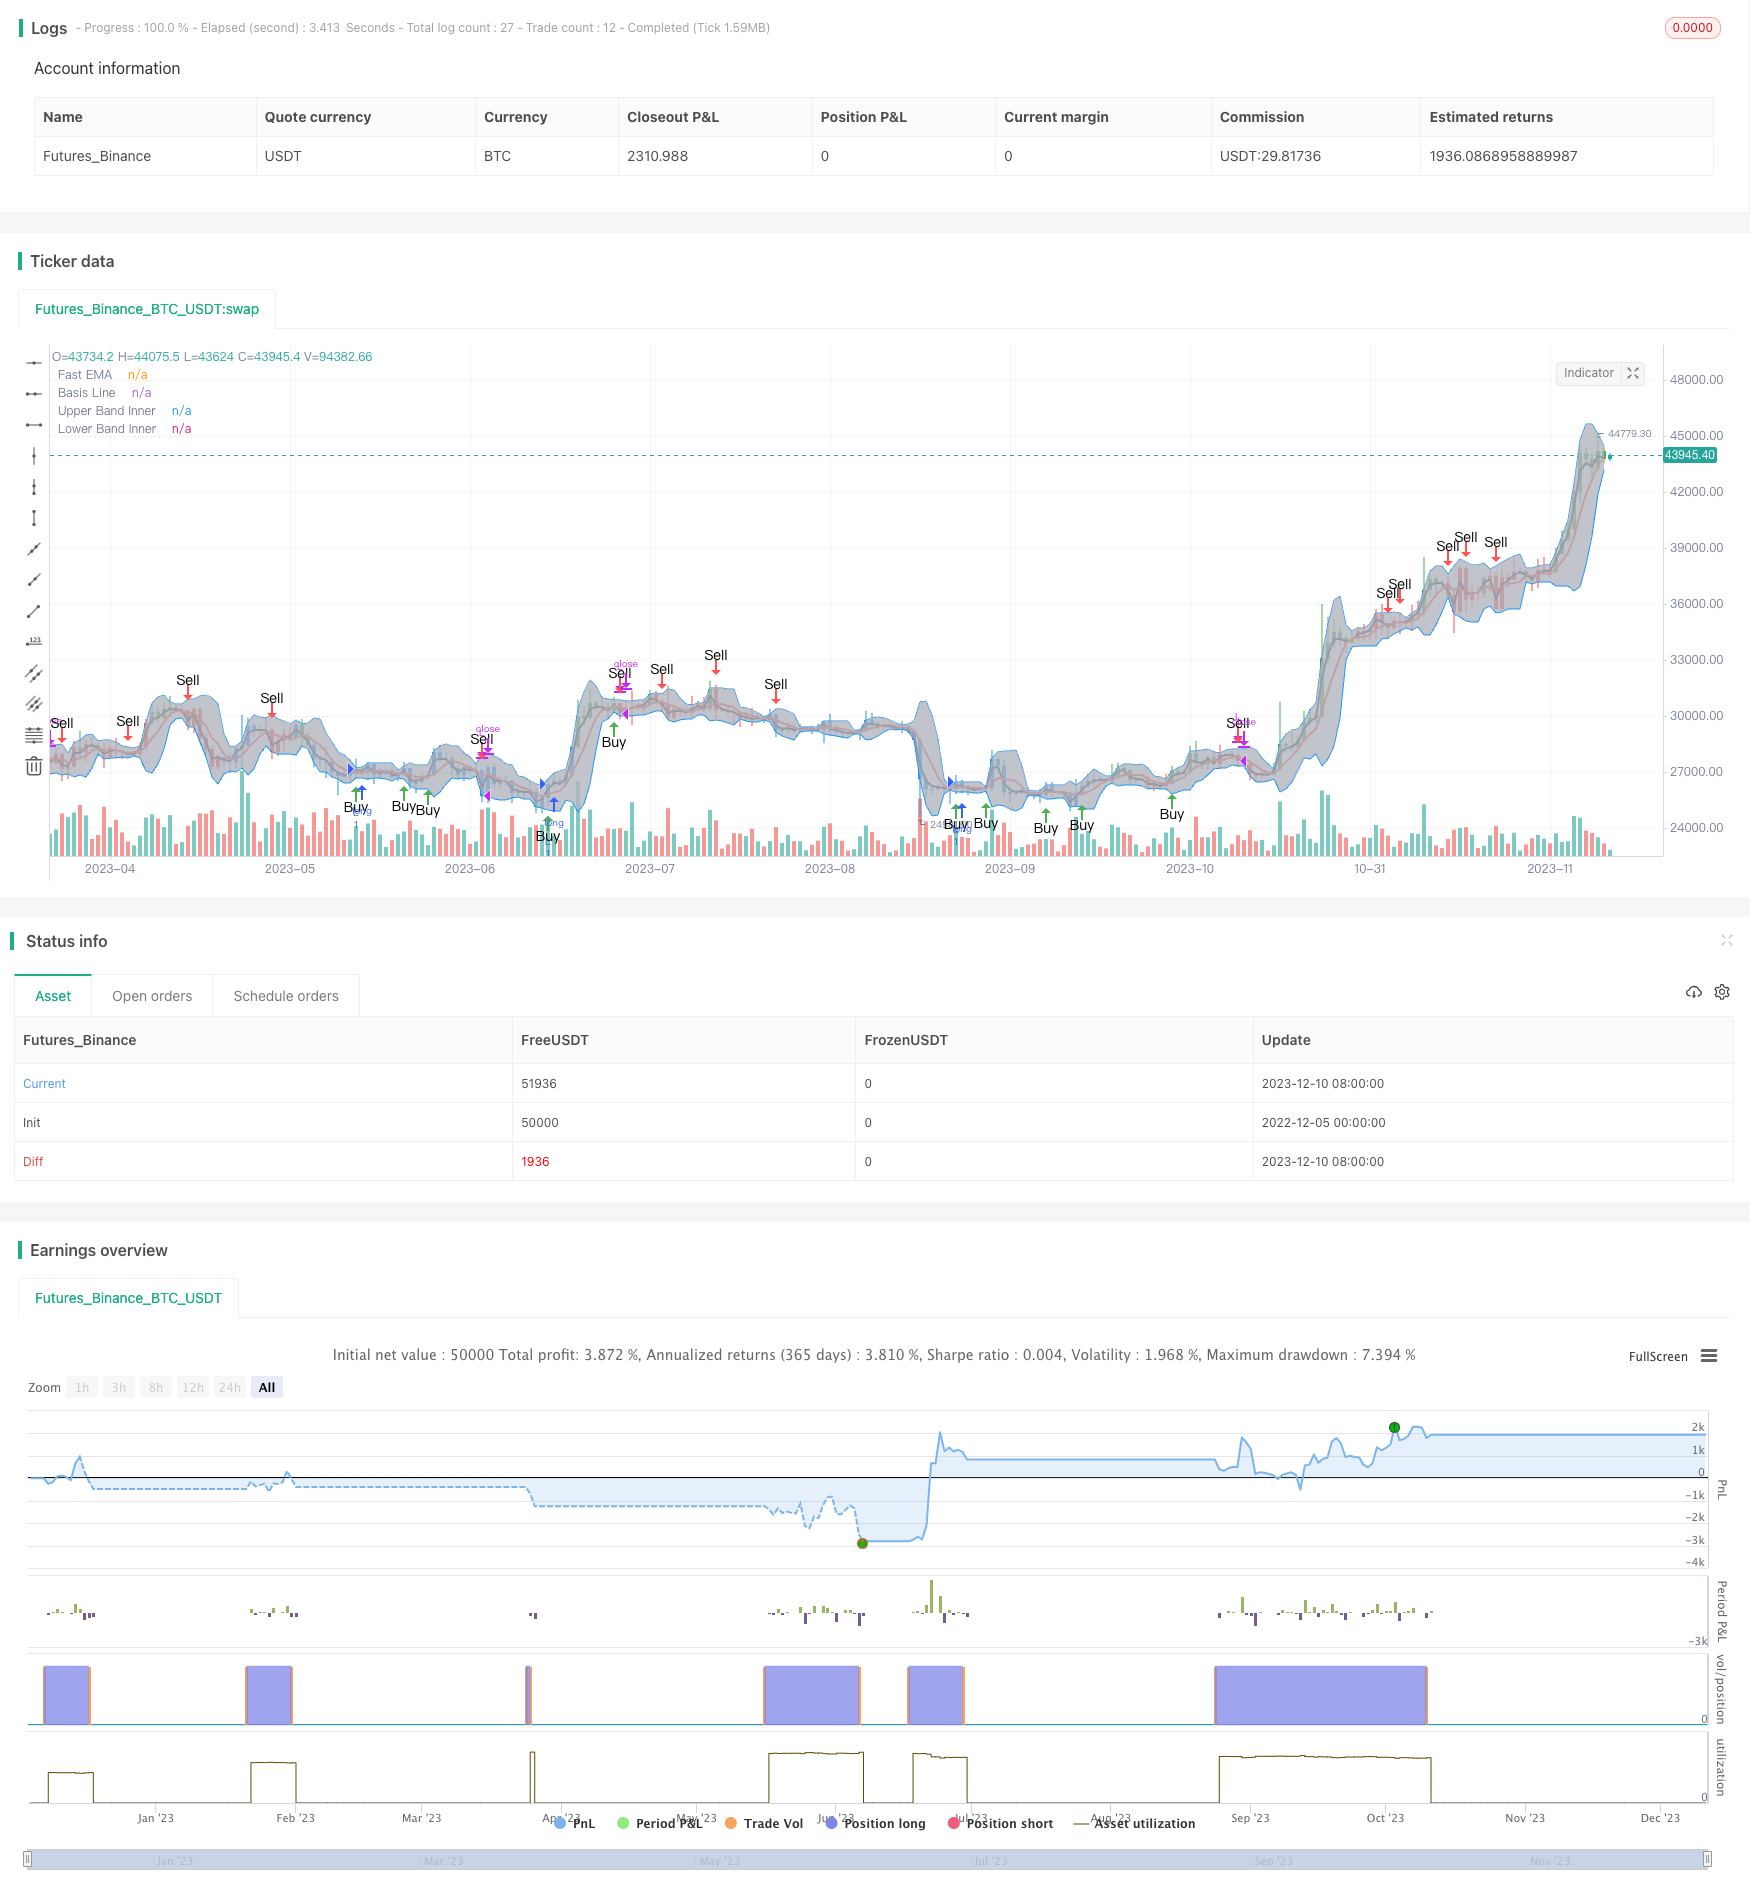
ボリンジャー・バンド 素晴らしいオシレーター ブレイクトレード戦略
作者: リン・ハーンチャオチャン, 日時: 2023-12-12 17:12:35タグ:

概要
この戦略は,ブレイクアウト取引モデルを実装するためにボリンジャーバンドス指標とAwesome Oscillator (AO) インジケーターを組み合わせます.高速EMAがBBチャネルを突破したとき,AOインジケーターの方向信号とともに,買い売り信号を生成します.
戦略の論理
- 価格チャネルを決定するために,ボリンジャー帯の中部,上部,下部帯を使用します.
- 中央帯を突破したときに チャンネルブレイクを判断します
- AO指標は上昇傾向または下落傾向の方向性を決定します.
- 急速なEMAが中間帯を上向きに突破し,AOが正であれば,買い信号が生成されます.
- 急速なEMAが中帯を下向きに突破し,AOがマイナスになると,セールシグナルが生成されます.
利点分析
- BBチャンネルは間違った信号を回避します.
- AOインジケーターは信号の精度を向上させる.
- トレンドの開始時により大きな利益を得ます
リスク分析
- BBのパラメータが正しくない場合,チャンネルが幅が広いか狭すぎる可能性があります.
- AOパラメータが精度に影響します
- 突破信号は 偽突破かもしれない
解決策
- BBとAOのパラメータを最適化して 最適な組み合わせを見つけます
- 偽脱出を防ぐために強度条件を追加します.
- 信頼性を確保するために他の指標と組み合わせます.
オプティマイゼーションの方向性
- BBパラメータを最適化して 適切なチャネル範囲を見つけます
- 精度を向上させるため,長期および短期間の AO を最適化する.
- ボリュームまたは他のフィルターを追加して 突破の信頼性を確保します
- 強度条件を最適化して 偽脱出率を下げる
結論
この戦略は,価格チャネル,トレンド方向,ブレイクアウトモデルを包括的に考慮する.パラメータ最適化と指標組み合わせによってより堅牢で利益を得ることができる.ブレイクアウトモデルは初期のトレンド機会を把握し,非常に実用的である.
/*backtest
start: 2022-12-05 00:00:00
end: 2023-12-11 00:00:00
period: 1d
basePeriod: 1h
exchanges: [{"eid":"Futures_Binance","currency":"BTC_USDT"}]
*/

//@version=3

strategy(shorttitle="BB+AO STRAT", title="BB+AO STRAT", overlay=true)


// === BACKTEST RANGE ===
FromMonth = input(defval = 6, title = "From Month", minval = 1)
FromDay   = input(defval = 1, title = "From Day", minval = 1)
FromYear  = input(defval = 2018, title = "From Year", minval = 2014)
ToMonth   = input(defval = 1, title = "To Month", minval = 1)
ToDay     = input(defval = 1, title = "To Day", minval = 1)
ToYear    = input(defval = 9999, title = "To Year", minval = 2014)

// Bollinger Bands Inputs
bb_use_ema = input(false, title="Use EMA for Bollinger Band")
bb_length = input(5, minval=1, title="Bollinger Length")
bb_source = input(close, title="Bollinger Source")
bb_mult = input(2.0, title="Base Multiplier", minval=0.5, maxval=10)
// EMA inputs
fast_ma_len = input(2, title="Fast EMA length", minval=2)
// Awesome Inputs
nLengthSlow = input(34, minval=1, title="Awesome Length Slow")
nLengthFast = input(5, minval=1, title="Awesome Length Fast")


// Breakout Indicator Inputs
bb_basis = bb_use_ema ? ema(bb_source, bb_length) : sma(bb_source, bb_length)
fast_ma  = ema(bb_source, fast_ma_len)

// Deviation

dev = stdev(bb_source, bb_length)
bb_dev_inner = bb_mult * dev

// Upper bands
inner_high = bb_basis + bb_dev_inner
// Lower Bands
inner_low = bb_basis - bb_dev_inner

// Calculate Awesome Oscillator
xSMA1_hl2 = sma(hl2, nLengthFast)
xSMA2_hl2 = sma(hl2, nLengthSlow)
xSMA1_SMA2 = xSMA1_hl2 - xSMA2_hl2
// Calculate direction of AO
AO = xSMA1_SMA2>=0? xSMA1_SMA2 > xSMA1_SMA2[1] ? 1 : 2 : xSMA1_SMA2 > xSMA1_SMA2[1] ? -1 : -2


// === PLOTTING ===

// plot BB basis
plot(bb_basis, title="Basis Line", color=red, transp=10, linewidth=2)
// plot BB upper and lower bands
ubi = plot(inner_high, title="Upper Band Inner", color=blue, transp=10, linewidth=1)
lbi = plot(inner_low, title="Lower Band Inner", color=blue, transp=10, linewidth=1)
// center BB channel fill
fill(ubi, lbi, title="Center Channel Fill", color=silver, transp=90)

// plot fast ma
plot(fast_ma, title="Fast EMA", color=black, transp=10, linewidth=2)

// Calc breakouts
break_down =   crossunder(fast_ma, bb_basis) and close < bb_basis and abs(AO)==2
break_up   =  crossover(fast_ma, bb_basis) and close > bb_basis and abs(AO)==1

// Show Break Alerts
plotshape(break_down, title="Breakout Down", style=shape.arrowdown, location=location.abovebar, size=size.auto, text="Sell", color=red, transp=0)
plotshape(break_up, title="Breakout Up", style=shape.arrowup, location=location.belowbar, size=size.auto, text="Buy", color=green, transp=0)
// === ALERTS ===


strategy.entry("L", strategy.long, when=(break_up and (time > timestamp(FromYear, FromMonth, FromDay, 00, 00)) and (time < timestamp(ToYear, ToMonth, ToDay, 23, 59))))


strategy.close("L", when=(break_down and (time < timestamp(ToYear, ToMonth, ToDay, 23, 59))))

// === /PLOTTING ===
barcolor(AO == 2 ? red: AO == 1 ? green : blue )


// eof
もっと
- イチモク5分スケール戦略
- モメント・バランス・チャネル・トレンド・トラッキング・戦略
- 簡潔な動的傾向戦略
- ダウ理論に基づくRSI/MFIモメント指標戦略
- % バンド移動平均戦略
- シェフ・トレンド・サイクルの二重移動平均のクロスオーバー戦略
- 移動平均チャネルブレイク戦略
- イチモク 資金管理による取引戦略
- 持続的なストップ損失取引戦略
- 勢いを逆転させる戦略
- EMAのクロスオーバー取引戦略
- 戦略をフォローするディバージェンツマトリックス傾向
- 重力中心のバックテスト トレーディング戦略
- ターンポイントのブレイクアウト戦略
- モメント・プルバック・戦略
- RSI トレンド 仮想通貨戦略
- トレンドトラッキング戦略 真の強度指数と組み合わせたダブル・ヴォルテックス指標に基づく
- イチモク 初期の雲のトレンド 戦略をフォローする
- 複数の時間枠移動平均システム取引戦略
- EVWMA 戦略をフォローする傾向