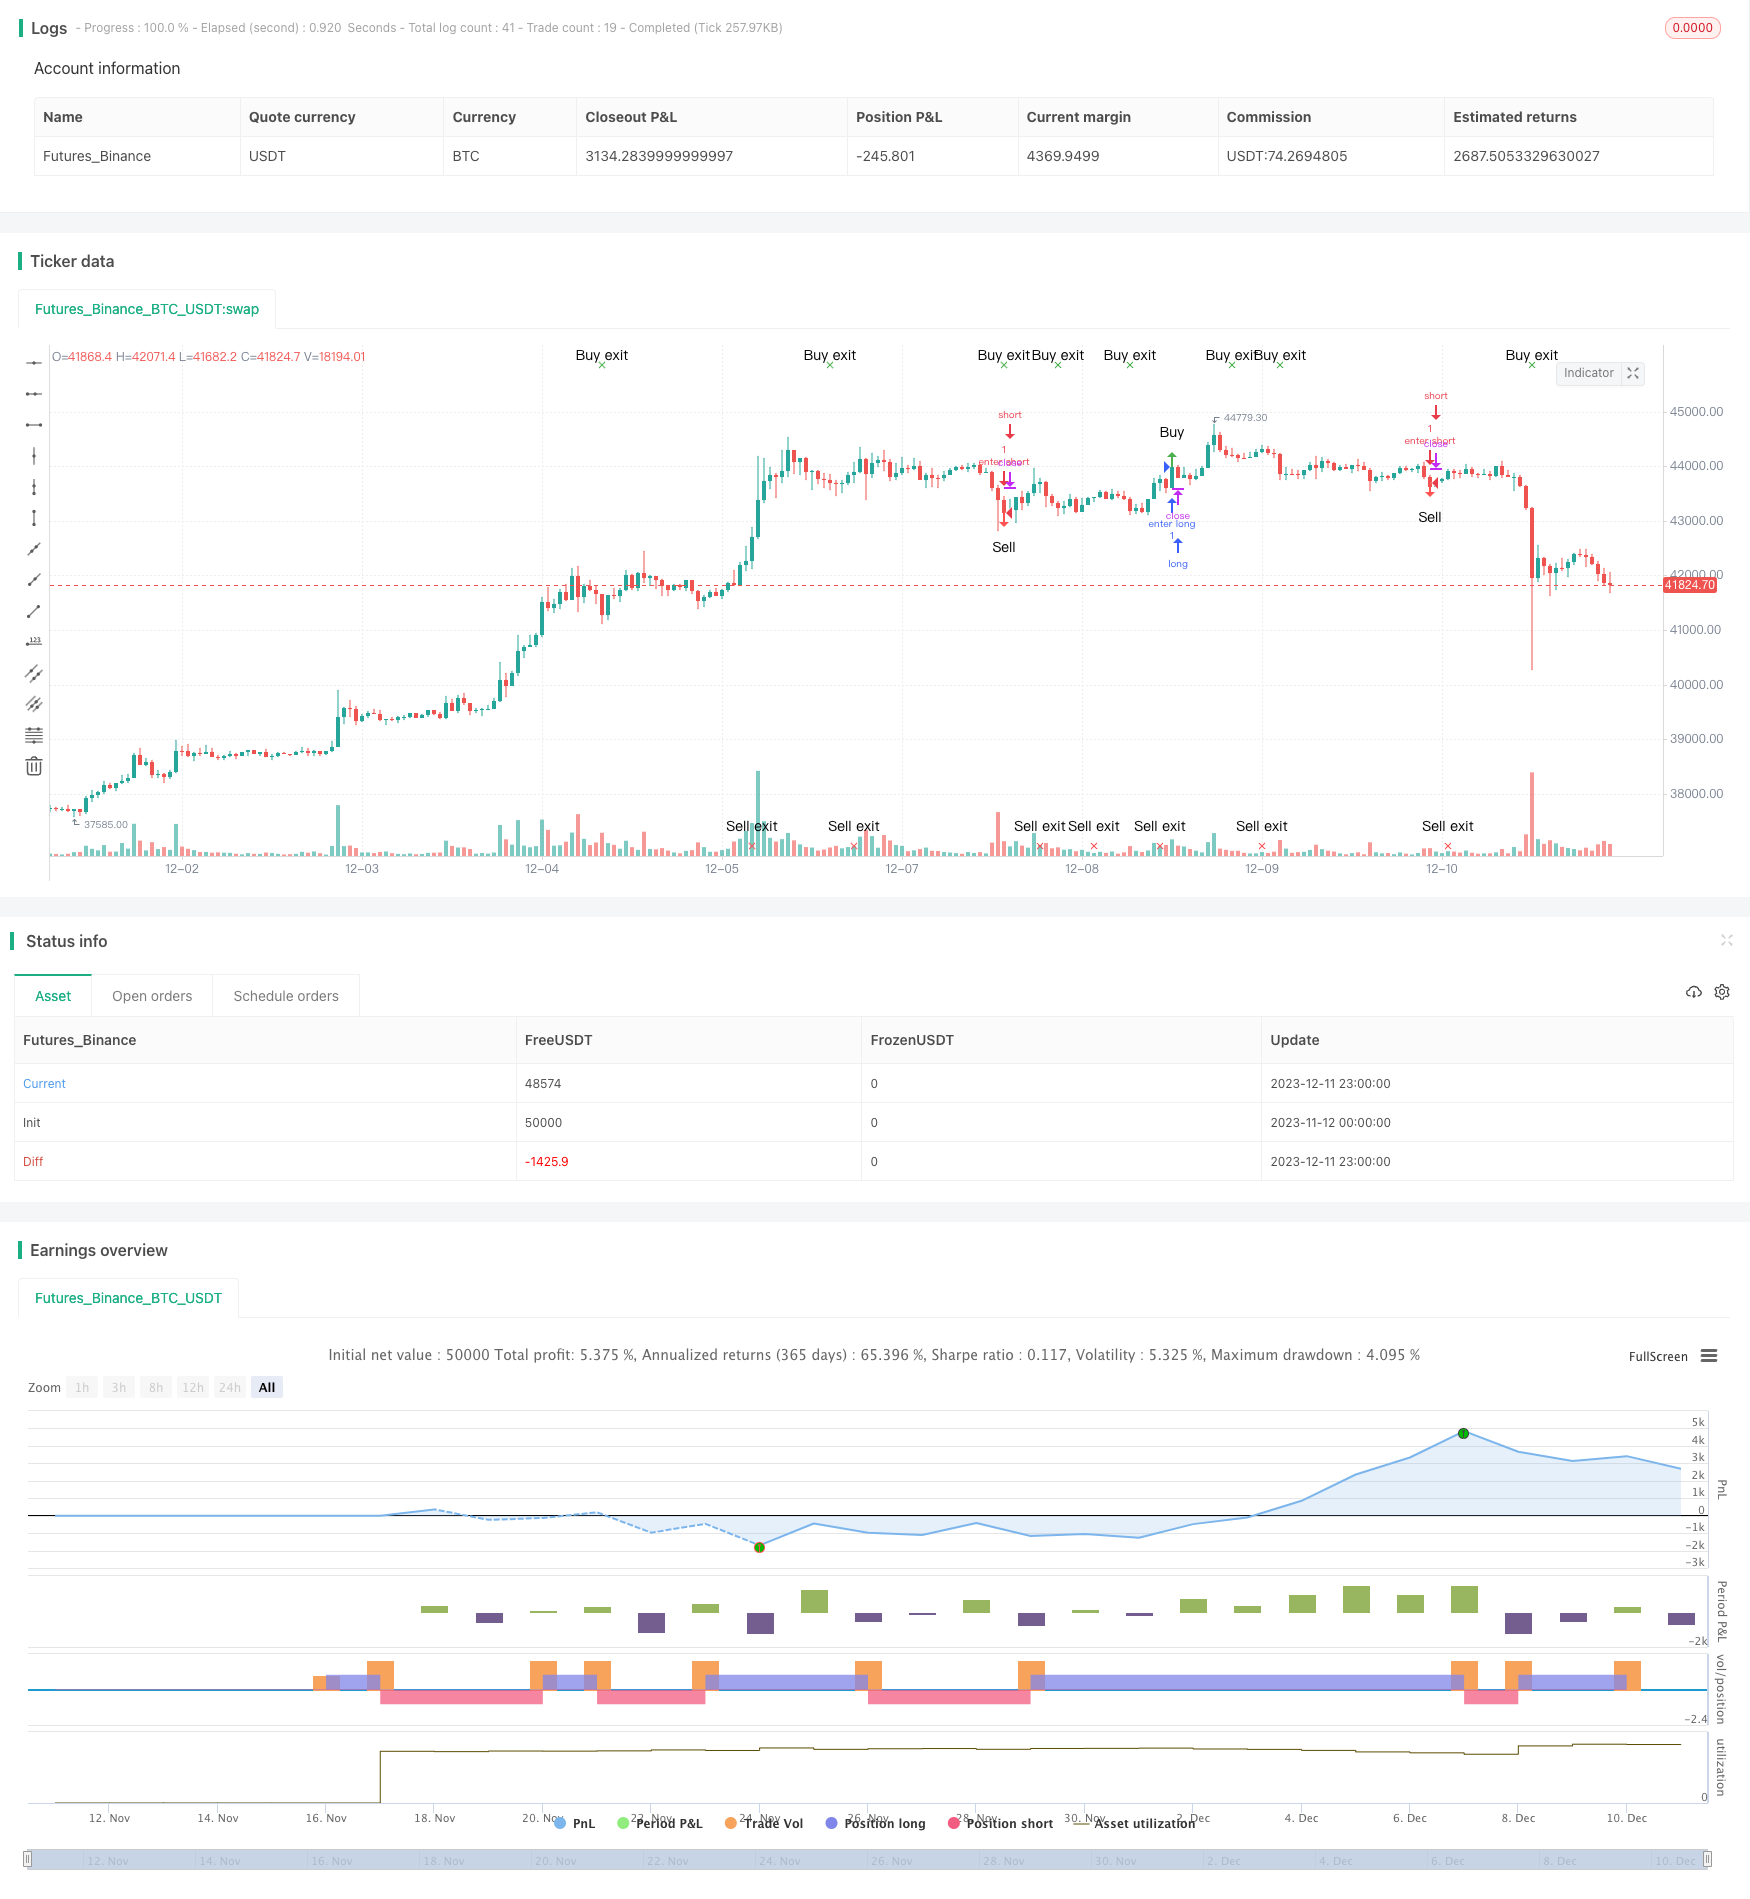
サンシャインスーパートレンド戦略
作成日:
2023-12-13 14:40:24
最終変更日:
2023-12-13 14:40:24
コピー:
3
クリック数:
638
1
フォロー
1628
フォロワー

概要
太陽光超トレンド戦略はATRとSuperTrend指標に基づくトレンド追跡戦略である.それはトレンドの逆転を正確に予測し,時間順の指標として使用するのに適しています.この戦略は,投資家の忍耐と決意を強め,適切なタイミングで市場に入り,退場するのを助けます.
戦略原則
この戦略は,SuperTrend指標を使用して,現在のトレンドの方向を判断する.SuperTrend指標が方向を変えたとき,トレンドの逆転が起こりうると考えられる.さらに,戦略は,K線実体方向を補助判断のために使用する.潜在的逆転信号が現れ,K線実体方向が前と一致するときに,無効信号をフィルターする.
具体的には,戦略は以下の論理に基づいて取引シグナルを生成します.
- SuperTrendの指標を使って主要なトレンドの方向を判断する
- 超トレンド指数の方向が変化すると,潜在的反転信号が生じる
- この時,K線実体方向が前と同じなら,この反転信号をフィルターします.
- K線実体方向が変化した場合,反転信号を確認し,取引信号を生成する
優位分析
- SuperTrendの指標によって,トレンドの逆転点を正確に判断できます.
- K線実体方向のフィルタリングと結合した無効信号,信号品質の向上
- 適性とは,投資家が合理的な入場・退出時間を選択するタイミングの指標である.
- 任意の時間周期と異なる品種に広く適用され,適応性が強い
リスクと解決策
- 超トレンド指数は余剰信号を生成しやすいため,補足フィルターが必要です.
解決方法:この戦略は,K線実体方向を補助判断として採用し,有効な信号を無効にフィルターします. - SuperTrendのパラメータ設定は,過度に最適化または過度に最適化される
解決方法: デフォルトのパラメータを使用し,人為調度過度の最適化を避ける - 状況が急激に逆転する事態を 処理できない
解決方法:ATRサイクルパラメータを適切に調整して,より迅速に対応する
最適化の方向
- 異なるATR周期パラメータの組み合わせを試す
- Volume または波動率のインジケーターを追加して,シグナルを補助的にフィルターする
- 他の指標システムと組み合わせて,戦略のパフォーマンスを向上させる
- 単一損失を抑えるための ストップ・ローズ・メカニズムの開発
要約する
日光超トレンド戦略は,スーパートレンド指標に基づいてトレンドの逆転を判断する高効率な戦略である. K線実体方向と組み合わせて補助判断を行うため,無効信号を効果的にフィルターし,信号品質を向上させる. この戦略は操作が簡単,適応性が強く,複数の品種と時間周期に広く適用できる. 合理的なパラメータの最適化と止損機構の追加により,戦略のパフォーマンスをさらに向上させることができる.
ストラテジーソースコード
/*backtest
start: 2023-11-12 00:00:00
end: 2023-12-12 00:00:00
period: 1h
basePeriod: 15m
exchanges: [{"eid":"Futures_Binance","currency":"BTC_USDT"}]
*/

//@version=5
strategy("Sunny Supertrend Strategy", overlay=true, default_qty_type=strategy.percent_of_equity)

atrPeriod = input(10, "ATR Length")
factor = input.float(3.0, "Factor", step = 0.01)

[_, direction] = ta.supertrend(factor, atrPeriod)

shor= close > open and close[1] > open[1] and close[2] > open[2]
lon = open > close and open[1] > close[1] and  open[2] > close[2]
tt= ta.change(direction) < 0
ss= ta.change(direction) > 0
long= tt
longexit = lon or ss
short= ss
shortexit = shor or tt

longPosMem = false
longexitPosMem = false
shortPosMem = false
shortexitPosMem = false

longPosMem := long ? true : short ? false : longPosMem[1]
longexitPosMem := longexit ? true : shortexit ? false : longexitPosMem[1]
shortPosMem := short ? true : long ? false : shortPosMem[1]
shortexitPosMem := shortexit ? true : longexit ? false : shortexitPosMem[1]

longy = long and not(longPosMem[1])
longexity = longexit and not(longexitPosMem[1])
shorty = short and not(shortPosMem[1])
shortexity = shortexit and not(shortexitPosMem[1])

//Use this to customize the look of the arrows to suit your needs.
plotshape(longy, location=location.abovebar, color=color.green, style=shape.arrowup, text="Buy")
plotshape(longexity, location=location.top, color=color.green, style=shape.xcross, text="Buy exit")
plotshape(shorty, location=location.belowbar, color=color.red, style=shape.arrowdown, text="Sell")
plotshape(shortexity, location=location.bottom, color=color.red, style=shape.xcross, text="Sell exit")


//plot(strategy.equity, title="equity", color=color.red, linewidth=2, style=plot.style_areabr)
// STEP 1:
// Make input options that configure backtest date range
startDate = input.int(title="Start Date", defval=1, minval=1, maxval=31)
startMonth = input.int(title="Start Month",
     defval=1, minval=1, maxval=12)
startYear = input.int(title="Start Year",
     defval=2021, minval=1800, maxval=2100)

endDate = input.int(title="End Date",
     defval=1, minval=1, maxval=31)
endMonth = input.int(title="End Month",
     defval=2, minval=1, maxval=12)
endYear = input.int(title="End Year",
     defval=2021, minval=1800, maxval=2100)

// STEP 2:
// Look if the close time of the current bar
// falls inside the date range
inDateRange =  true


// STEP 3:
// Submit entry orders, but only when bar is inside date range
if (inDateRange and longy)
    strategy.entry("enter long",strategy.long,when= longy)
    strategy.close("long",when=longexity)


if (inDateRange and shorty)
    strategy.entry("enter short",strategy.short,when = shorty)
    strategy.close("short", when=shortexity)