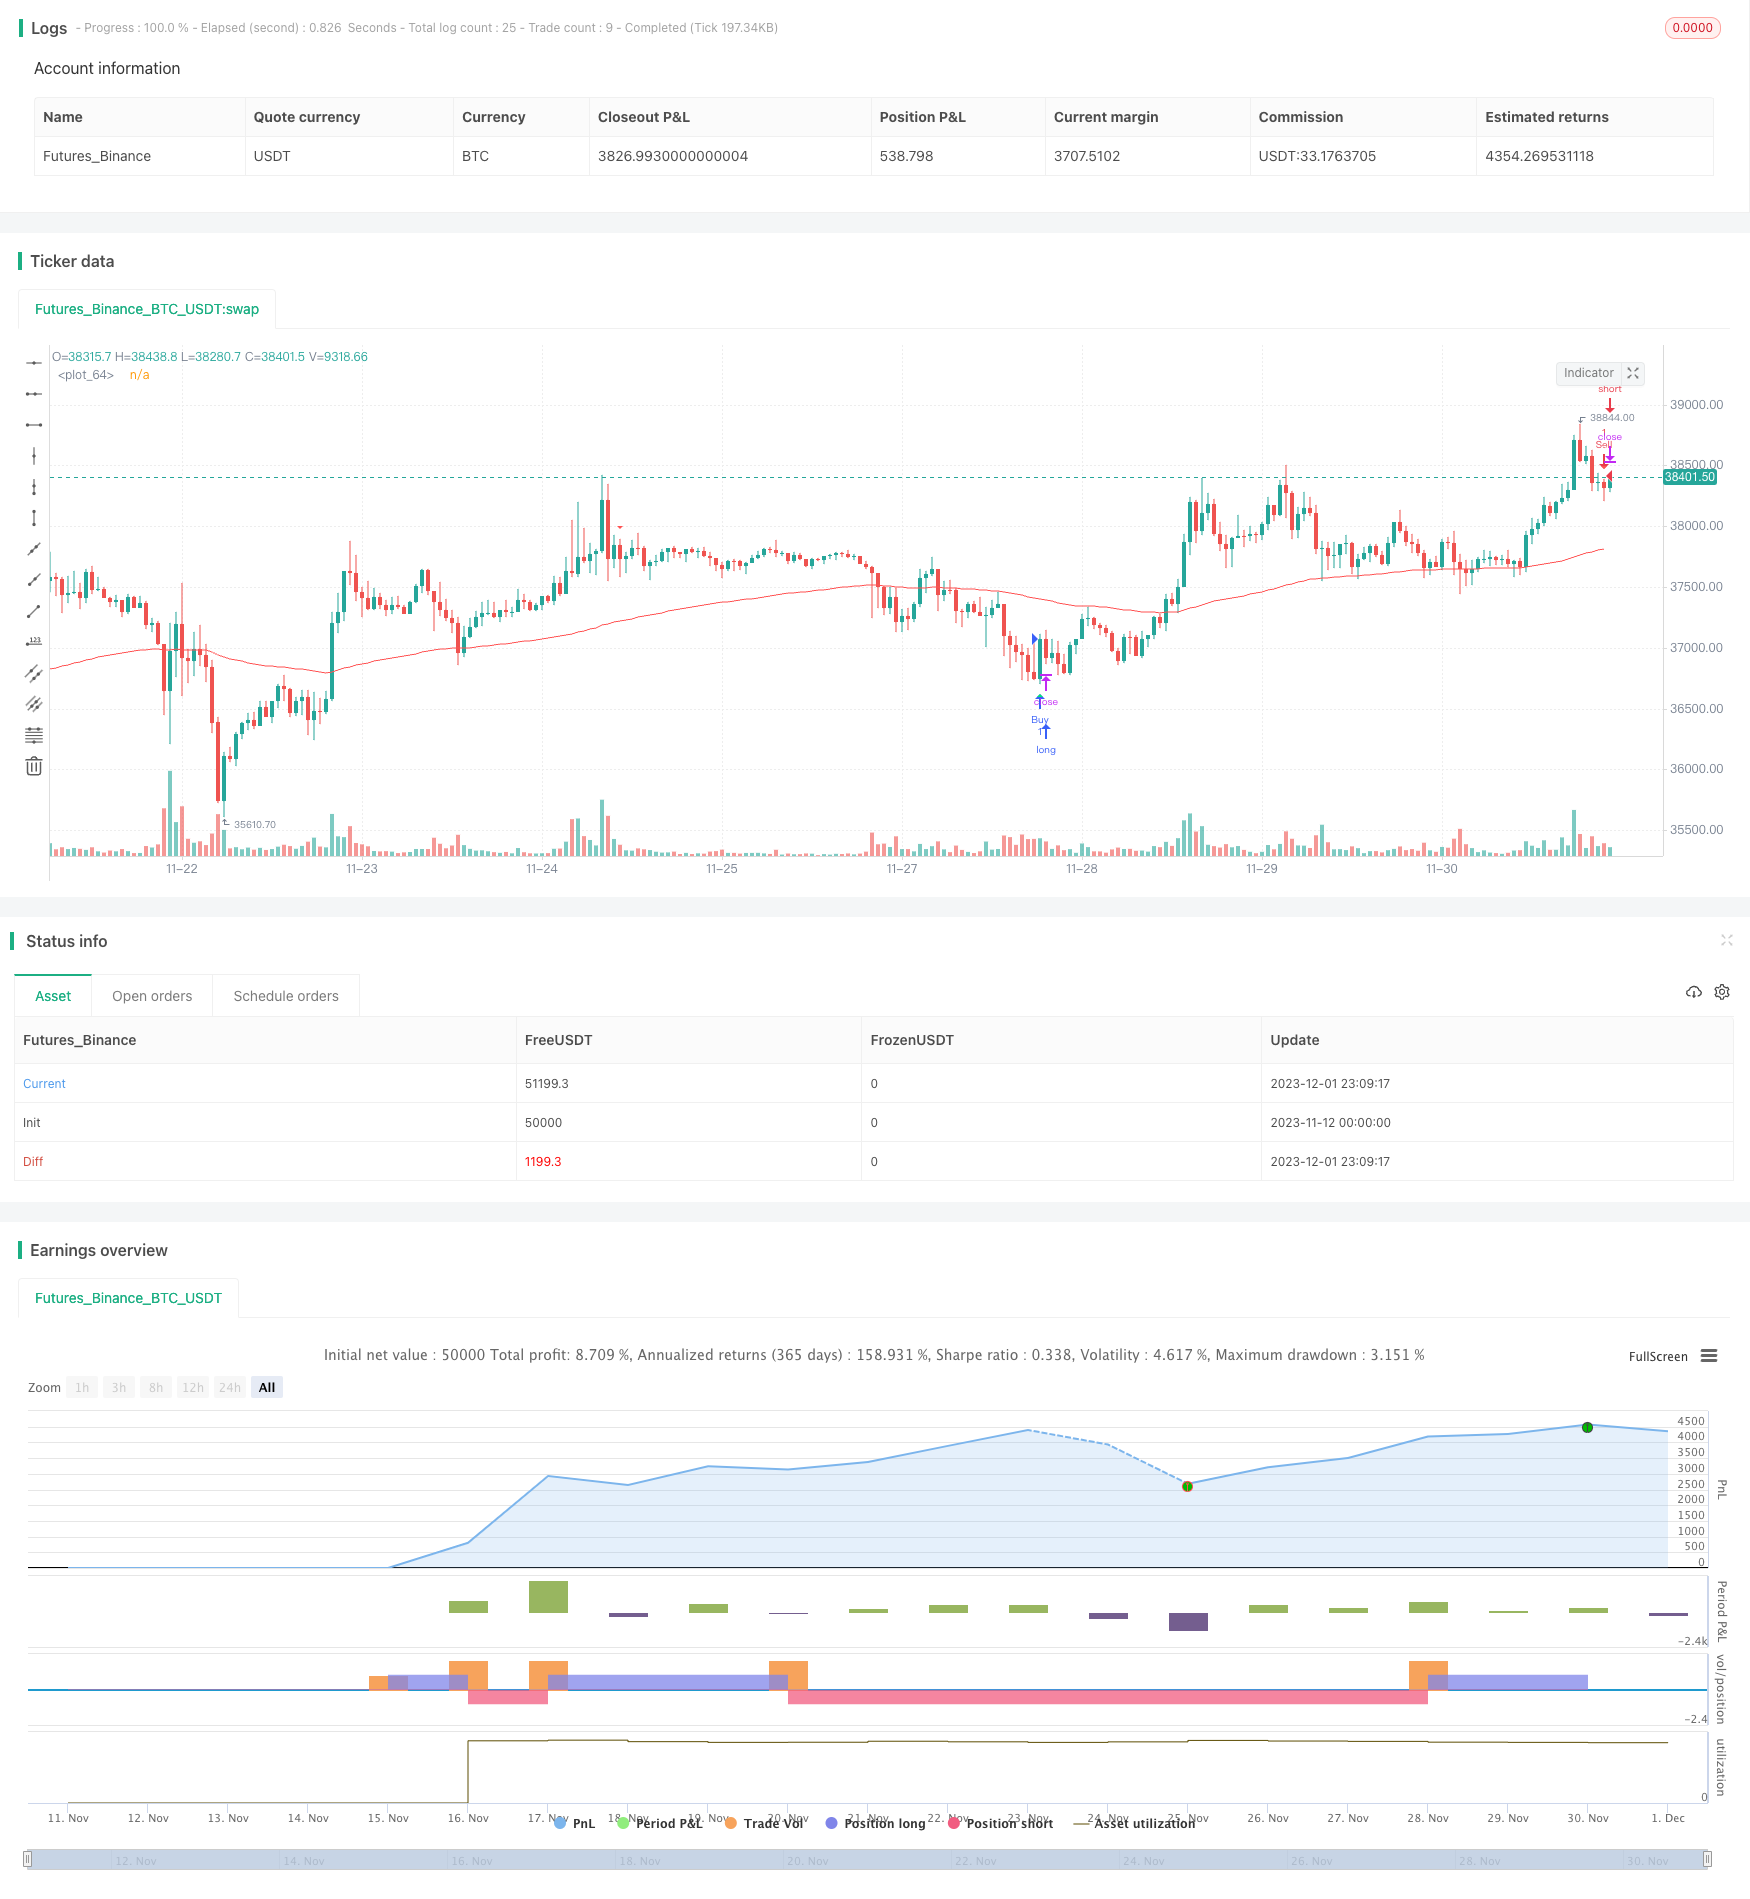
リバーサルの指標戦略
作者: リン・ハーンチャオチャン開催日:2023年12月13日 14:45:51タグ:

概要
これは複数の技術指標に基づいた再取引戦略である.CCI,モメント指標,RSIおよびその他の指標を組み合わせて,潜在的な長期および短期間の取引機会を特定する.指標が過買い/過売りの信号を示し,価格が引き下げられると,戦略は取引信号を生成する.
戦略の論理
この戦略の取引信号は,カスタムインジケーター"エドリエクストリームポイント・バイ&セール"から来ています.CCI,モメンタムインジケーター,RSIクロスオーバーを考慮します.具体的論理は:
長信号条件:
Edri Extreme Points Buy & Sell 指標は買い信号を誘発し,CCIが0を超えたり,モメントが0を超えたりし,RSIは過売り値を下回る. - 価格が100期間の EMAに回ったり下ったりします
短信号条件:
Edri Extreme Points Buy & Sell インジケーターは売り信号を誘発し,CCIが0を下回り,モメンタムが0を下回り,RSIがオーバー買いレベルを上回る. - 価格が100期間の EMAに回ったり上ったりします.
この戦略は,レギュラーな上昇/下落差を見つけるように設定され,RSIが価格から大幅に逸脱するときにのみ取引信号を生成できます.
トレーディング・シグナルが起動すると,戦略はエントリー価格 ± 2ATR でストップ・ロスを設定し,エントリー価格 ± 4ATR でプロフィートを取る.これは市場の変動に基づいて合理的なストップ・ロストとプロフィートの範囲を可能にします.
利点分析
- 複数の指標を組み合わせることで,単一の指標からの誤った信号を避ける.
- リバース・トレードスタイルは レンジ・バインド市場での 中期機会を捉える
- ATR ベースのストップ・ロースとテイク・プロフィートは,市場の変動に基づいてポジションを調整できます.
- 格差の発見は,極端な過買い/過売りレベルなしのポジションの開設を避けます.
リスク分析
- 不適切な指標パラメータは,機会を逃すか,誤った信号を過剰に与える可能性があります.
- 逆転取引は,トレンド市場の連続的なストップ損失を引き起こす可能性があります.
- ATRは遅延効果があり,急速に動いている市場では,ストップ・ロース/テイク・プロフィートをタイムリーに更新することはできません.
解決策:
- 最良の組み合わせを見つけるために 指標パラメータをバックテストして最適化します
- 傾向が強いときに戦略を中止することを検討します.
- 移動ストップ・ロースや逆ストップ・ロースなどの他のストップ・ロース方法と組み合わせます.
オプティマイゼーションの方向性
- CCI,モメント長,RSIパラメータ,ATRマルチプリキュータなど,異なるパラメータの組み合わせを試験する.
- 価格パターンや量の変化など フィルタリング条件を追加します
- 位置調整規則を調整する ATRベースの位置比率など
- 異なる製品と時間枠のためのパラメータテンプレートを設定する.
- 傾向市場での逆転取引を停止するために 傾向追跡を追加することを検討します
概要
この戦略は,主にレンジバインド市場で動作し,比較的安定した利益のために中期逆転を捕捉する.短期的な価格の伸びを特定し,複数の指標に基づいて取引信号を生成するのに役立ちます.適切な最適化とリスク管理により,その利点が効果的に利用できます.それでも逆転取引の固有の弱点,強いトレンドで継続的な損失の可能性を意識してください.全体的に,この戦略は,いくつかの量とリスク管理経験を持つ投資家に適しています.
/*backtest
start: 2023-11-12 00:00:00
end: 2023-12-02 00:00:00
period: 1h
basePeriod: 15m
exchanges: [{"eid":"Futures_Binance","currency":"BTC_USDT"}]
*/

// This source code is subject to the terms of the Mozilla Public License 2.0 at https://mozilla.org/MPL/2.0/
// © MagicStrategies

//@version=5
strategy("Reversal Indicator Strategy", overlay = true)

// Input settings
ccimomCross = input.string('CCI', 'Entry Signal Source', options=['CCI', 'Momentum'], tooltip='CCI or Momentum will be the final source of the Entry signal if selected.')
ccimomLength = input.int(10, minval=1, title='CCI/Momentum Length')
useDivergence = input.bool(true, title='Find Regular Bullish/Bearish Divergence', tooltip='If checked, it will only consider an overbought or oversold condition that has a regular bullish or bearish divergence formed inside that level.')
rsiOverbought = input.int(65, minval=1, title='RSI Overbought Level', tooltip='Adjusting the level to extremely high may filter out some signals especially when the option to find divergence is checked.')
rsiOversold = input.int(35, minval=1, title='RSI Oversold Level', tooltip='Adjusting this level extremely low may filter out some signals especially when the option to find divergence is checked.')
rsiLength = input.int(14, minval=1, title='RSI Length')
plotMeanReversion = input.bool(false, 'Plot Mean Reversion Bands on the chart', tooltip='This function doesn\'t affect the entry of signal but it suggests buying when the price is at the lower band, and then sell it on the next bounce at the higher bands.')
emaPeriod = input(200, title='Lookback Period (EMA)')
bandMultiplier = input.float(1.8, title='Outer Bands Multiplier', tooltip='Multiplier for both upper and lower bands')


// CCI and Momentum calculation
momLength = ccimomCross == 'Momentum' ? ccimomLength : 10
mom = close - close[momLength]
cci = ta.cci(close, ccimomLength)
ccimomCrossUp = ccimomCross == 'Momentum' ? ta.cross(mom, 0) : ta.cross(cci, 0)
ccimomCrossDown = ccimomCross == 'Momentum' ? ta.cross(0, mom) : ta.cross(0, cci)

// RSI calculation
src = close
up = ta.rma(math.max(ta.change(src), 0), rsiLength)
down = ta.rma(-math.min(ta.change(src), 0), rsiLength)
rsi = down == 0 ? 100 : up == 0 ? 0 : 100 - 100 / (1 + up / down)
oversoldAgo = rsi[0] <= rsiOversold or rsi[1] <= rsiOversold or rsi[2] <= rsiOversold or rsi[3] <= rsiOversold
overboughtAgo = rsi[0] >= rsiOverbought or rsi[1] >= rsiOverbought or rsi[2] >= rsiOverbought or rsi[3] >= rsiOverbought

// Regular Divergence Conditions
bullishDivergenceCondition = rsi[0] > rsi[1] and rsi[1] < rsi[2]
bearishDivergenceCondition = rsi[0] < rsi[1] and rsi[1] > rsi[2]

// Entry Conditions
longEntryCondition = ccimomCrossUp and oversoldAgo and (not useDivergence or bullishDivergenceCondition)
shortEntryCondition = ccimomCrossDown and overboughtAgo and (not useDivergence or bearishDivergenceCondition)


// Mean Reversion Indicator
meanReversion = plotMeanReversion ? ta.ema(close, emaPeriod) : na
stdDev = plotMeanReversion ? ta.stdev(close, emaPeriod) : na
upperBand = plotMeanReversion ? meanReversion + stdDev * bandMultiplier : na
lowerBand = plotMeanReversion ? meanReversion - stdDev * bandMultiplier : na


// Plotting
plotshape(longEntryCondition, title='BUY', style=shape.triangleup, text='B', location=location.belowbar, color=color.new(color.lime, 0), textcolor=color.new(color.white, 0), size=size.tiny)
plotshape(shortEntryCondition, title='SELL', style=shape.triangledown, text='S', location=location.abovebar, color=color.new(color.red, 0), textcolor=color.new(color.white, 0), size=size.tiny)

plot(upperBand, title='Upper Band', color=color.new(color.fuchsia, 0), linewidth=1)
plot(meanReversion, title='Mean', color=color.new(color.gray, 0), linewidth=1)
plot(lowerBand, title='Lower Band', color=color.new(color.blue, 0), linewidth=1)

// Entry signal alerts
alertcondition(longEntryCondition, title='BUY Signal', message='Buy Entry Signal')
alertcondition(shortEntryCondition, title='SELL Signal', message='Sell Entry Signal')
alertcondition(longEntryCondition or shortEntryCondition, title='BUY or SELL Signal', message='Entry Signal')

ema100 = ta.ema(close, 100)
plot(ema100, color=color.red)

// Define trading signals based on the original indicator's entry conditions
// Buy if long condition is met and price has pulled back to or below the 100 EMA
longCondition  = longEntryCondition and close <= ema100
// Sell if short condition is met and price has pulled back to or above the 100 EMA
shortCondition = shortEntryCondition and close >= ema100

// Strategy Entries
if longCondition
    strategy.entry("Buy", strategy.long)
if shortCondition
    strategy.entry("Sell", strategy.short)
もっと
- EMA フィルター 戦略 と モジュール 論理
- オープン・クローズ・クロスポイント戦略
- ADXとMACD指標に基づく取引戦略
- RSIのクロスオーバー・モメンタム・サイクリック戦略
- アクセレータオシレーターに基づくトレンド逆転戦略
- 多期移動平均戦略
- 2つの移動平均線を捕捉する戦略
- 長期・短期移動平均クロスオーバー取引戦略
- 移動平均のクロスオーバーと逆転指標の組み合わせ戦略
- ラファエル・ジオニ 戦略をフォローするモメンタム・トレンド
- サニー・スーパートレンド戦略
- 波動性突破戦略
- イチモク5分スケール戦略
- モメント・バランス・チャネル・トレンド・トラッキング・戦略
- 簡潔な動的傾向戦略
- ダウ理論に基づくRSI/MFIモメント指標戦略
- % バンド移動平均戦略
- シェフ・トレンド・サイクルの二重移動平均のクロスオーバー戦略
- 移動平均チャネルブレイク戦略
- イチモク 資金管理による取引戦略