ボリンジャー帯とRSIに基づく定量的な取引戦略
作者: リン・ハーンチャオチャン, 日付: 2023-12-20 15:39:19タグ:

概要
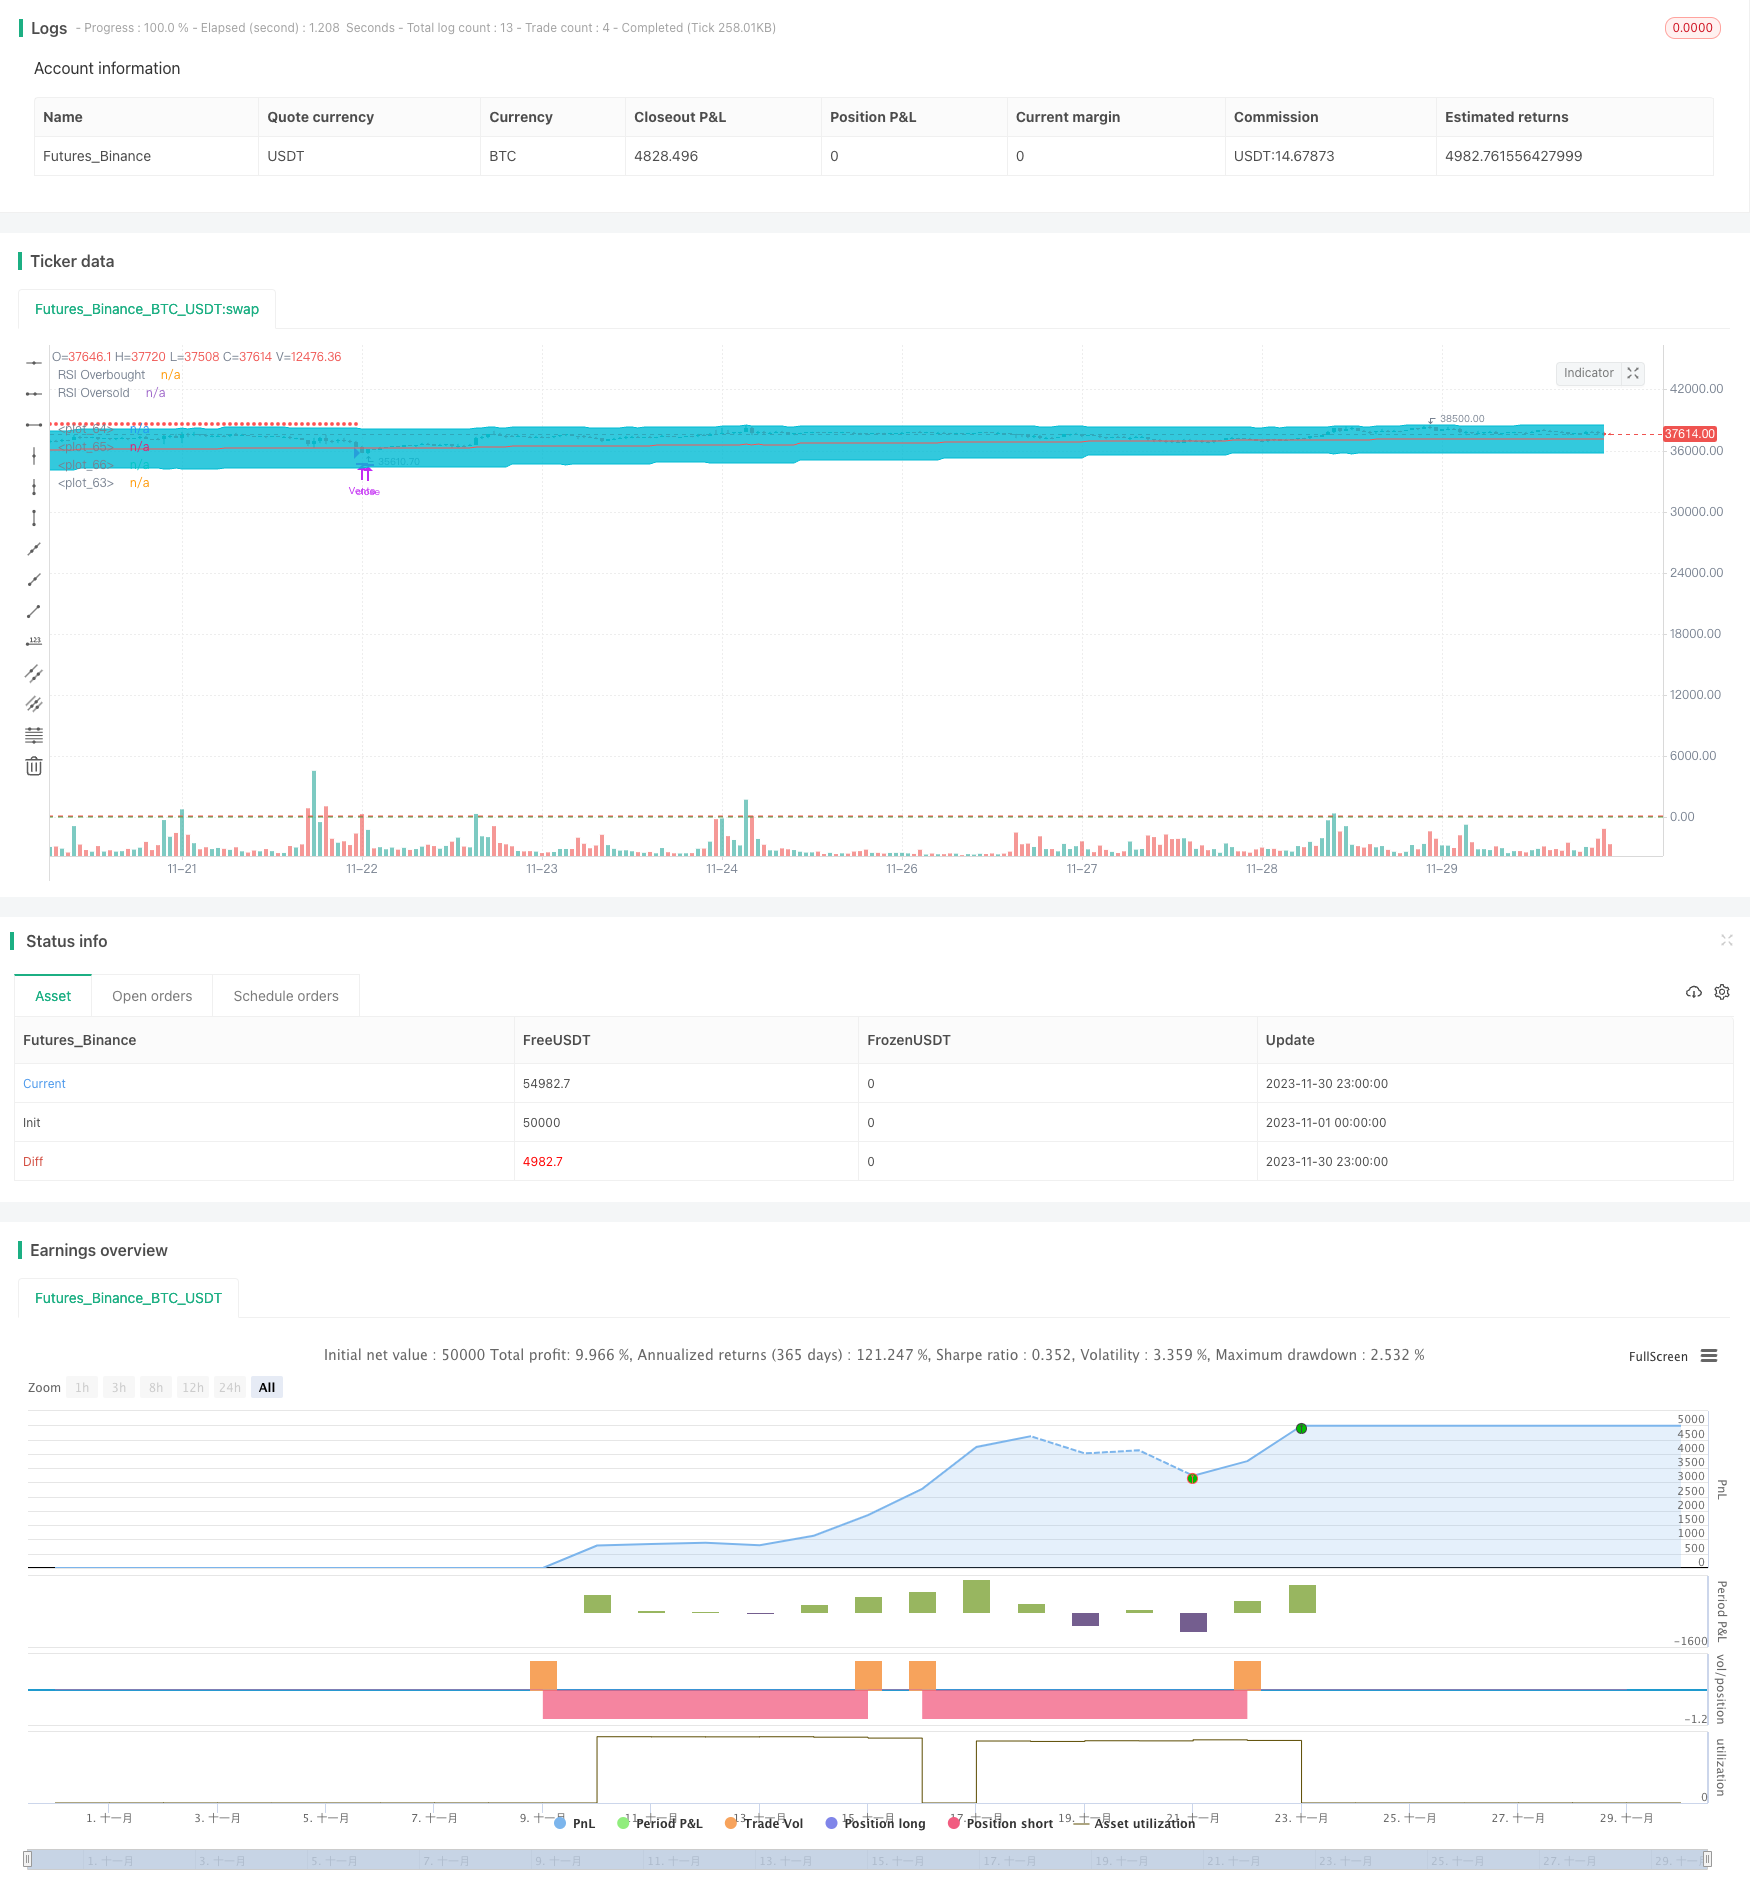
この戦略は,ボリンジャーバンドと相対強度指数 (RSI) をベースとした定量的な取引戦略を設計する.トレンド追跡と過買い/過売り判断を組み合わせ,トレンドの開始時に市場に参入し,過買い/過売りレベルから利益を得るために退場する.
戦略原則
この戦略は,価格動向とサポート/レジスタンスレベルを決定するためにボリンジャーバンドを使用する.下のボリンジャーバンドに近づく価格は過売り信号と見なされ,上部ボリンジャーバンドに近づく価格は過買い信号と見なされる.同時に,RSIインジケーターを組み込み,過売りまたは過買い状態が存在するかどうかを決定する.
特定の取引ルールは:価格が下のボリンジャーバンドを下回り,RSIが30を下回り,価格が上部のボリンジャーバンド上回り,RSIが70を超えるとショート.利益を得るために,中間ボリンジャーバンドまたは反対のボリンジャーバンドを利益のレベルとして設定します.ストップロスはエントリー価格の一定の割合で設定されます.
利点
この戦略は,トレンド開始タイミングを把握するために,ボリンジャーバンドのトレンド追跡能力とRSIのオーバーバイト/オーバーセール判断を組み合わせます.また,利益を取ることとストップ損失戦略は明確なリスク管理を提供します.
ボリンジャーバンドやRSIのような単一の指標を使用すると比較して,この戦略は意思決定の正確性を向上させるために複数の指標とパラメータを使用します.適切なパラメータ調整により,比較的安定したパフォーマンスを達成できます.
リスク
この戦略はパラメータ最適化に大きく依存する.パラメータの設定が正しくない場合,トレンドが欠落したり,誤った信号を生成したりする.例えば,ボリンジャー期間の不一致がそのような問題を引き起こす可能性があります.利益とストップ損失レベルも慎重に評価する必要があります.
戦略は取引手段にも依存する.非常に不安定な資産では,ボリンジャーバンドパラメータをそれに応じて調整する必要がある.傾向が不明確な楽器では,パフォーマンスも損なわれる可能性がある.取引コスト,スリップや極端な市場イベントの影響も受けられる.
パラメータ最適化テストは,さまざまな資産と市場体制における利益取得/ストップ損失レベルおよびパフォーマンスを評価するために推奨されます. リスク管理バッファを維持します.
オプティマイゼーションの方向性
改善すべき点はいくつかあります.
Bollinger Bands と RSI のパラメータを評価し最適化し,取引機器の特徴によりよく適合させる
多要素モデルを構築するために,KDJ,MACDなどの追加指標を組み込む
利回り/ストップ損失戦略を評価する.例えば,ストップ損失を後押しする,またはスケールアウトする.
特定の資産と市場状況に基づいて動的パラメータ調整を行う
信号品質とリスクレベルを判断するための機械学習モデルを追加
概要
この戦略は,総合的なトレンドフォローシステムのためにボリンジャーバンドとRSIを統合している.パラメータ調節とリスク管理を通じて有効性と安定性を向上させるための余地がある.よりよいパフォーマンスのために,個々のニーズとリスク偏好に基づいてカスタム調整と最適化が推奨される.
/*backtest
start: 2023-11-01 00:00:00
end: 2023-11-30 23:59:59
period: 1h
basePeriod: 15m
exchanges: [{"eid":"Futures_Binance","currency":"BTC_USDT"}]
*/

//@version=4
strategy("BB + RSI Estrategia", overlay=true)

longitud = input(20, title="Longitud BB", minval=5, maxval=50, step=1)
multiplicador = input(2.0, title="Multiplicador BB", type=input.float, step=0.1)
timeframe_bb = input("D", title="Marco de Tiempo BB", type=input.resolution)
rsi_length = input(14, title="Longitud RSI", minval=5, maxval=50, step=1)
rsi_overbought = input(70, title="Nivel de sobrecompra RSI", minval=50, maxval=80, step=1)
rsi_oversold = input(30, title="Nivel de sobreventa RSI", minval=20, maxval=50, step=1)
take_profit = input("Central", title="Take Profit (banda)", options=["Central", "Opuesta"])
stop_loss = input(2.00, title="Stop Loss", type=input.float, step=0.10)

var SL = 0.0

[banda_central, banda_superior, banda_inferior] = security(syminfo.tickerid, timeframe_bb, bb(close, longitud, multiplicador))
rsi_value = rsi(close, rsi_length)

comprado = strategy.position_size > 0
vendido = strategy.position_size < 0

if not comprado and not vendido
    if close < banda_inferior and rsi_value < rsi_oversold
        // Realizar la compra
        cantidad = round(strategy.equity / close)
        strategy.entry("Compra", strategy.long, qty=cantidad, when=cantidad > 0)
        SL := close * (1 - (stop_loss / 100))

    if close > banda_superior and rsi_value > rsi_overbought
        // Realizar la Venta
        cantidad = round(strategy.equity / close)
        strategy.entry("Venta", strategy.short, qty=cantidad, when=cantidad > 0)
        SL := close * (1 + (stop_loss / 100))

if comprado
    // Verificar el take profit
    if take_profit == "Central" and close >= banda_central
        strategy.close("Compra", comment="TP")
        SL := 0

    if take_profit == "Opuesta" and close >= banda_superior
        strategy.close("Compra", comment="TP")
        SL := 0
    // Verificar el stop loss
    if close <= SL
        strategy.close("Compra", comment="SL")
        SL := 0

if vendido
    // Verificar el take profit
    if take_profit == "Central" and close <= banda_central
        strategy.close("Venta", comment="TP")
        SL := 0

    if take_profit == "Opuesta" and close <= banda_inferior
        strategy.close("Venta", comment="TP")
        SL := 0
    // Verificar el Stop loss
    if close >= SL
        strategy.close("Venta", comment="SL")
        SL := 0

// Salida
plot(SL > 0 ? SL : na, style=plot.style_circles, color=color.red)
g1 = plot(banda_superior, color=color.aqua)
plot(banda_central, color=color.red)
g2 = plot(banda_inferior, color=color.aqua)
fill(g1, g2, color=color.aqua, transp=97)

// Dibujar niveles de sobrecompra/sobreventa del RSI
hline(rsi_overbought, "RSI Overbought", color=color.red)
hline(rsi_oversold, "RSI Oversold", color=color.green)
- トールとベアパワー 移動平均取引戦略
- 定量戦略:ボリンジャー帯 RSI CCIクロスオーバー戦略
- VWAPの脱出追跡戦略
- モメント・リバーサル・トレーディング・戦略
- モメント トラッキング トレーディング戦略
- 複数の重度の移動平均値のトレンド戦略
- ボリンジャー帯とMACDに基づく取引戦略
- マクド・ブルー・レッド・レバレッジ・戦略
- モメントキャプチャチャネル戦略
- 振動逆転戦略をヘッジする
- 相対量指標戦略
- オクタゴン・クラウド・トラッキング・戦略
- 確率強化RSI戦略
- トリプル EMA トレンド フォロー 戦略
- スタン・ザ・マン - 二重移動平均値と波動性に基づいた高度な株式取引戦略
- 逆の意味の突破戦略
- 2倍移動平均逆転戦略
- ロガリズム式価格予測戦略
- 簡単な移動平均のクロスオーバー戦略
- Bollinger Bands と RSI トレンド フォロー ストラテジー