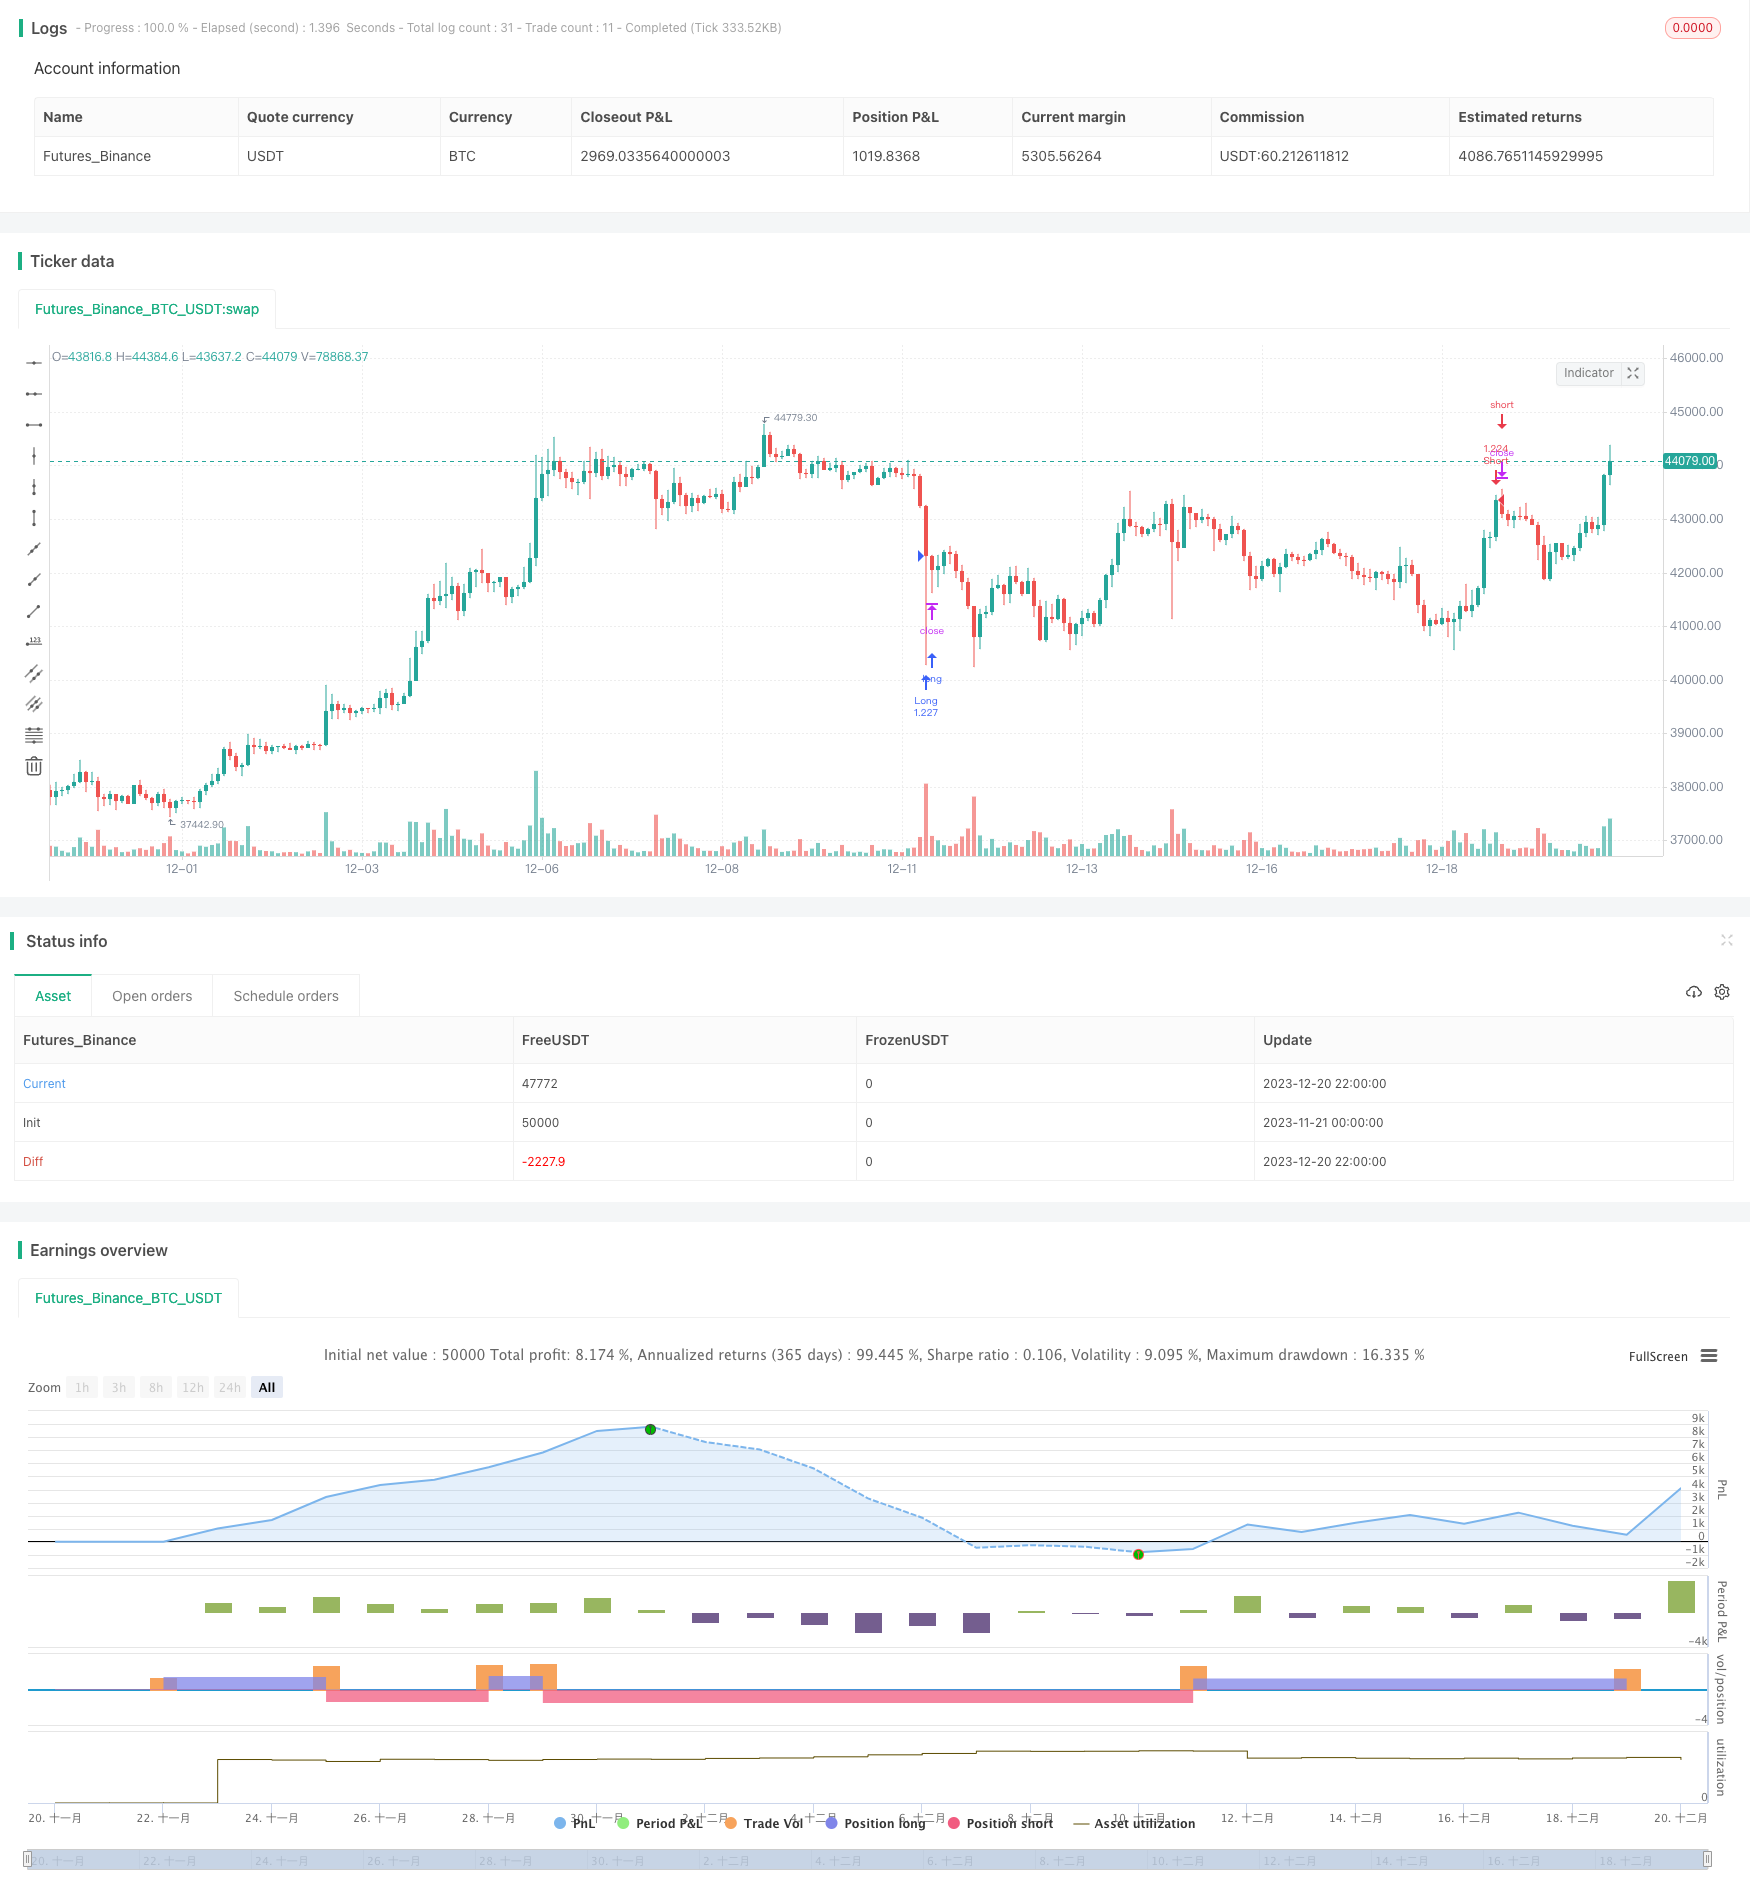
RSIのブレイクアウト戦略は定量的な取引戦略です
作者: リン・ハーンチャオチャン開催日:2023年12月22日14時06分45秒タグ:

概要
RSIブレイクアウト戦略は,相対強度指数 (RSI) 指標に基づいた定量的な取引戦略である.この戦略は,RSIが既定の過剰購入および過剰販売の限界値を突破したとき,つまりRSIが30を下回るとロング,RSIが70を超えるとショートとなるときに取引信号を生成する.
戦略の論理
RSIブレイクアウト戦略の主な考え方は,RSI指標を使用して市場における過買い・過売りの状況を決定することである.RSIは,株式の最近の強みや弱さを反映するために,期間中の平均価格上昇と損失の比率を計算する.一般的に,RSIが30未満は過売り,RSIが70を超えると過買いとみなされる.
この戦略は,まずRSIの過剰販売および過剰購入の限界値を設定し,デフォルト値は30と70である.その後,リアルタイムでRSIラインをモニターする.RSIが上から下へと70の限界を下回ると,セールシグナルが生成される.これは市場は過剰購入ゾーンに入り,下向きに逆転する可能性があることを示唆し,ショートポジションを取ります.逆に,RSIが30の限界を超えると,買い信号が生成され,過剰販売市場が再び反弹する可能性を示唆し,ロングポジションを取ります.
この方法で,ストック変動の際に価格逆転点を把握し,低価格で購入して高価格で販売するようにポジションを調整します.
利点
RSIのブレイクアウト戦略には以下の利点があります.
-
シンプルで明確な取引シグナル.RSIインジケーターは,インジケーターラインが限界値を突破するかどうかを単に観察することによって計算し解釈することが簡単です.複雑なルールなしでシグナルが発生した場合に迅速に取引することができます.
-
RSIは,RSIの値値が上昇するにつれて,RSIの値が上昇するにつれて,RSIの値が上昇するにつれて,RSIの値が上昇するにつれて,RSIの値が上昇するにつれて,RSIの値が上昇するにつれて,RSIの値が上昇するにつれて,RSIの値が上昇するにつれて,RSIの値が上昇するにつれて,RSIの値が上昇するにつれて,RSIの値が上昇するにつれて,RSIの値が上昇するにつれて,RSIの値が上昇するにつれて,RSIの値が上昇するにつれて,RSIの値が上昇する.
-
高度にカスタマイズ可能.トレーダーは,異なる株式と市場の動向に合わせて,過剰購入/過剰販売の限界値のようなRSIパラメータを柔軟に調整できます.
リスク
RSIのブレイクアウト戦略には リスクもあります
-
Whipsaws に易い.インジケーターの限界値の頻繁なクロスオーバーは,過剰な非効率な取引につながり,安定した利益を妨げます.パラメータは,いくつかのウィッピー信号をフィルターするために調整することができます.
-
トレンド判断がない.RSIは,全体的なトレンドをよく判断することなく,過剰購入/過剰販売レベルに基づいたシグナルのみを生成する.戦略は不安定な市場で滞留する傾向がある.反トレンド取引を避けるためにトレンドフィルターを追加することができる.
-
引き下げリスクが高い.RSIは,RSIがダウン傾向にある間,価格が上昇し続けるときに,RSIはしばしば上昇傾向を示します.このような場合,ショートトレードでは大きな損失に直面します.
強化 分野
RSIのブレイクアウト戦略は以下の方法で強化できます.
-
RSIの限界を克服するために複数の指標を組み込む.例えば,市場動向を決定するための移動平均値,強度指標,信号の確認のためのボリュームフィルターなど.
-
RSI パラメータを最適化してより高い安定性を確保し,過剰購入/過剰販売の限界値を調整し,厳格なテストを通じて信号期間フィルターを設定するなど.これは非効率な信号をフィルターします.
-
リスクを制御するためにストップ・ロスを実施し,利益を上げます.例えば,パーセントまたはポイントストップを設定します.全体的な利益に対する単一取引の過大損失を避ける.また,利益を得るためのトレンドと技術的なポイントを検討します.
結論
RSIブレイクアウト戦略は,過剰購入および過剰販売の信号に基づいた平均逆転定量戦略である. シンプルで明確な信号,完全な自動化機能,高いカスタマイズ可能性がありますが,ウィップソーと引き下げリスクに苦しんでいます. インディケーターコンボとリスクコントロールで最適化することで,安定した戦略に調整することができます.
/*backtest
start: 2023-11-21 00:00:00
end: 2023-12-21 00:00:00
period: 2h
basePeriod: 15m
exchanges: [{"eid":"Futures_Binance","currency":"BTC_USDT"}]
*/

// @version=4
// This source code is subject to the terms of the Mozilla Public License 2.0 at https://mozilla.org/MPL/2.0/
// © Bunghole 2021

strategy(title="My New Strategy", initial_capital = 100000, default_qty_type = strategy.percent_of_equity, default_qty_value = 100, pyramiding = 0, currency = 'USD', overlay=true)

//// Stoploss and Take Profit Parameters
// Enable Long Strategy
enable_long_strategy = input(true, title="Enable Long Strategy", group="SL/TP For Long Strategy",inline="1")
long_stoploss_value = input(defval=50, title='Stoploss %', type=input.float, minval=0.1, group="SL/TP For Long Strategy",inline="2")
long_stoploss_percentage = (close * (long_stoploss_value / 100)) / syminfo.mintick
long_takeprofit_value = input(defval=50, title='Take Profit %', type=input.float, minval=0.1, group="SL/TP For Long Strategy",inline="2")
long_takeprofit_percentage = (close * (long_takeprofit_value / 100)) / syminfo.mintick

// Enable Short Strategy
enable_short_strategy = input(true, title="Enable Short Strategy", group="SL/TP For Short Strategy",inline="3")
short_stoploss_value = input(defval=50, title='Stoploss %', type=input.float, minval=0.1, group= "SL/TP For Short Strategy",inline="4")
short_stoploss_percentage = (close * (short_stoploss_value / 100)) / syminfo.mintick
short_takeprofit_value = input(defval=50, title='Take Profit %', type=input.float, minval=0.1, group="SL/TP For Short Strategy",inline="4")
short_takeprofit_percentage = (close * (short_takeprofit_value / 100)) / syminfo.mintick

// Plot Stoploss & Take Profit Levels
long_stoploss_price = strategy.position_avg_price * (1 - long_stoploss_value/100)
long_takeprofit_price = strategy.position_avg_price * (1 + long_takeprofit_value/100)
short_stoploss_price = strategy.position_avg_price * (1 + short_stoploss_value/100)
short_takeprofit_price = strategy.position_avg_price * (1 - short_takeprofit_value/100)
plot(enable_long_strategy and not enable_short_strategy ? long_stoploss_price: na, color=#ff0000, style=plot.style_linebr, linewidth=2, title="Long SL Level")
plot(enable_long_strategy and not enable_short_strategy ? long_takeprofit_price: na, color=#008000, style=plot.style_linebr, linewidth=2, title="Long TP Level")
plot(enable_short_strategy and not enable_long_strategy ? short_stoploss_price: na, color=#ff0000, style=plot.style_linebr, linewidth=2, title="Short SL Level")
plot(enable_short_strategy and not enable_long_strategy ? short_takeprofit_price: na, color=#008000, style=plot.style_linebr, linewidth=2, title="Short TP Level")

// Date Range
start_date = input(title="Start Date", type=input.integer, defval=1, minval=1, maxval=31, group="Date Range")
start_month = input(title="Start Month", type=input.integer, defval=1, minval=1, maxval=12, group="Date Range")
start_year = input(title="Start Year", type=input.integer, defval=1804, minval=1800, maxval=3000, group="Date Range")
end_date = input(title="End Date", type=input.integer, defval=1, minval=1, maxval=3, group="Date Range")
end_month = input(title="End Month", type=input.integer, defval=1, minval=1, maxval=12, group="Date Range")
end_year = input(title="End Year", type=input.integer, defval=2077, minval=1800, maxval=3000, group="Date Range")
in_date_range = (time >= timestamp(syminfo.timezone, start_year, start_month, start_date, 0, 0)) and (time < timestamp(syminfo.timezone, end_year, end_month, end_date, 0, 0))

//// Inputs   **This is where you enter your indicators for your strategy. For example, I added the RSI indicator.**
//RSI
rsi = rsi(close, 14)
rsi_over_sold = rsi < 30
rsi_over_bought = rsi > 70


//// Strategy  **This is where you create your strategy. For example, We have or buy and sell signals.**
// Creating Long and Short Strategy
buy_signal = rsi_over_sold
sell_signal = rsi_over_bought

// Long Strategy
if buy_signal and in_date_range and enable_long_strategy == true
    strategy.entry("Long", true, when=buy_signal, alert_message="Open Long Position")
    strategy.exit("Long  SL/TP", from_entry="Long", loss=long_stoploss_percentage, profit=long_takeprofit_percentage, alert_message="Your Long SL/TP Limit As Been Triggered.")
    strategy.close("Long", when=sell_signal, alert_message="Close Long Position")

// Short Strategy
if sell_signal and in_date_range and enable_short_strategy == true
    strategy.entry("Short", false, when = sell_signal, alert_message="Open Short Position")
    strategy.exit("Short SL/TP", from_entry="Short", loss=short_stoploss_percentage, profit=short_takeprofit_percentage, alert_message="Your Short SL/TP Limit As Been Triggered.")
    strategy.close("Short", when=buy_signal, alert_message="Close Short Position")
- 感情に基づくXBT先物取引戦略
- パラボリックSARモメント逆転戦略
- 経験的モード分解に基づく定量的な取引戦略
- ダイナミックなピラミッド戦略
- YinYang RSI ボリュームトレンド トレーディング戦略
- クアッドMA トレンド スカルパー戦略
- オシレーター指数変換戦略
- ゴールデンクロス デッドクロス ダブル移動平均MACDトレンド追跡戦略
- これは実験的な量的な取引戦略です
- 単一移動平均のクロスオーバー ボリンガーバンド戦略
- 移動平均のクロスオーバー戦略は,定量的な取引戦略です.
- モメントブレイク 移動平均取引戦略
- スローハイケンアシ 指数関数移動平均取引戦略
- 定量モデルに基づく高性能アルゴリズム取引戦略
- ボリンジャー・モメンタム・ブレイクアウト戦略
- パラボリックSARとEMAのトレンド追跡戦略
- 高低戦略が破綻した
- 低ピラミッドリスク追跡戦略
- TSLA 量的な取引システム 複数の時間枠
- カスタマイズ可能な非リペイント HTF MACD MFI スケーブルボット戦略