低波動性 vs 高波動性戦略を購入する
作者: リン・ハーンチャオチャン,日付: 2024-01-08 11時33分58秒タグ:

概要
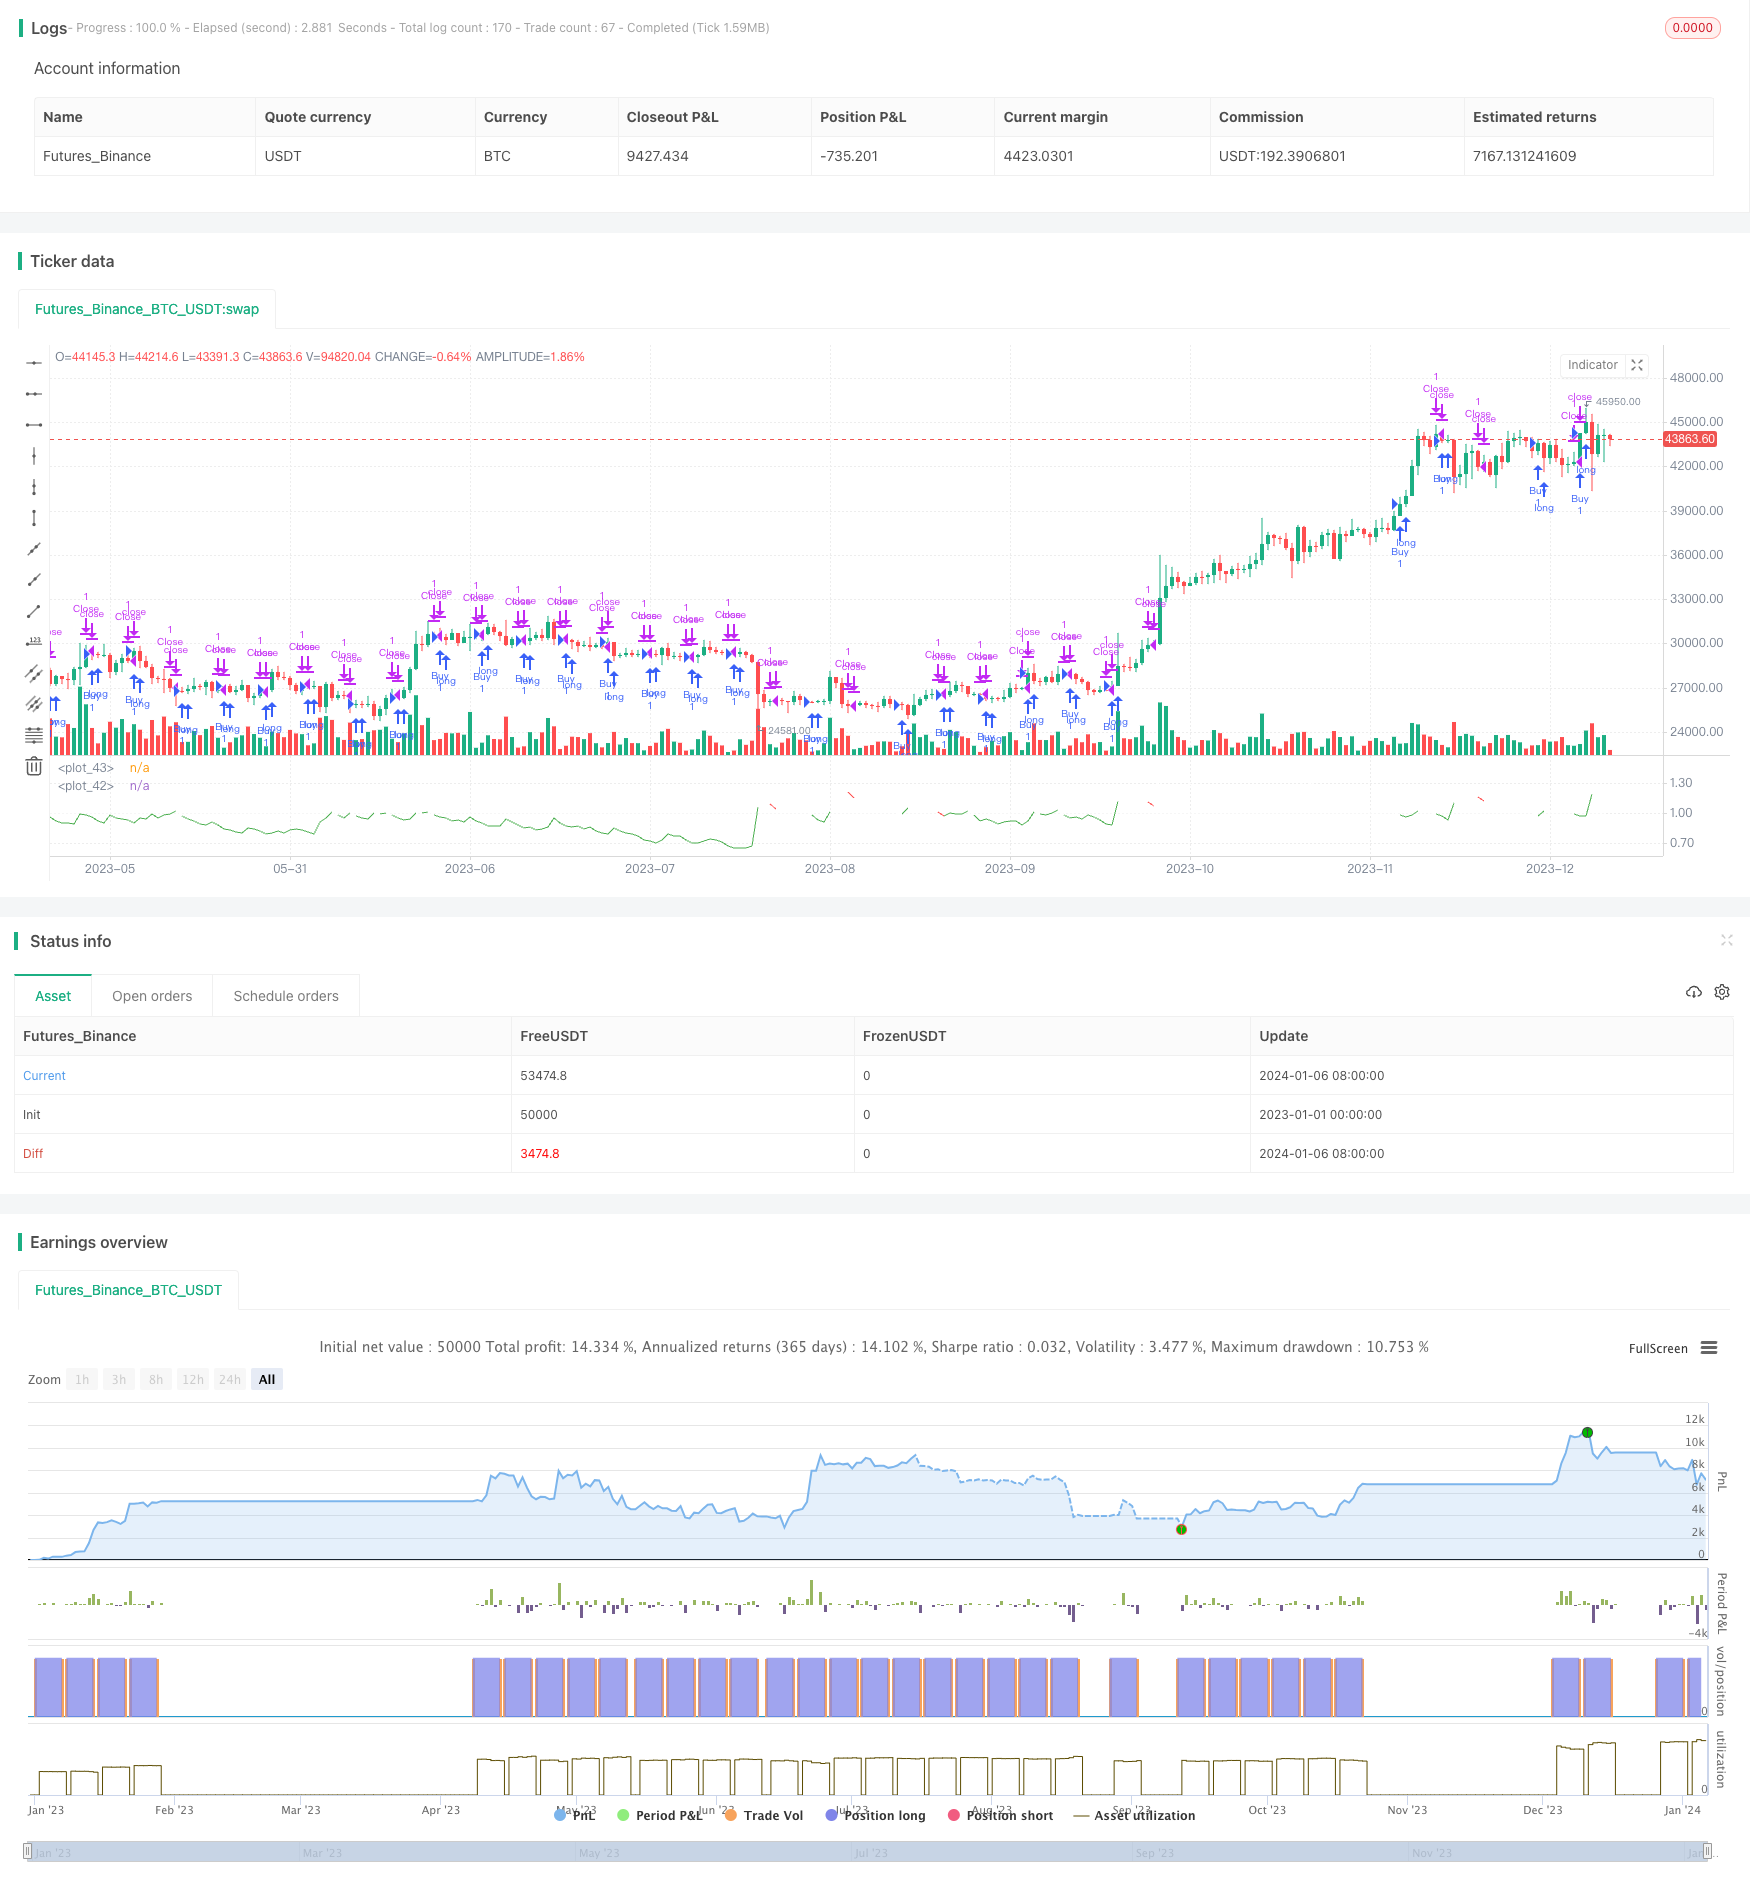
この戦略は,変動が低いときと高いときの資産購入の違いを研究することを目的としています.モード入力変数を変更することで,低波動期または高波動期間に購入するかどうかを選択することができます.
戦略の論理
この戦略は,ATRとSMAを計算することによって波動性を決定する.具体的には,ATRのSMAを計算し,その後ATRとSMAの比率を計算する.この比率がユーザー定義の
ユーザが選択したモードに応じて,ストラテジーは波動性が高く,または低いときに購入信号を生成する.一度購入すると,ストラテジーは,sellAfterNBarsLengthによって定義された数つのバーで保持され,その後ポジションを閉じる.
利点分析
この戦略の主な利点は以下の通りです.
- 低波動と高波動期間の購入戦略のパフォーマンスを直感的に比較することができます.
- SMAを使って ATRを滑らかにすることで 偽発症をフィルタリングできます
- パラメータを調整して 異なる変動レベルをテストできます
リスク分析
この戦略の主なリスクは,
- 低波動性だけを買えば 価格上昇の機会を逃すかもしれない
- 高波動性のみを購入するとシステムリスクが増加する可能性があります.
- 適切なパラメータ設定が不適切である場合,購入機会を逃すか,ポジションを早めに閉じる可能性があります.
上記のリスクは,パラメータを調整し,異なる変動レベルからの購入を組み合わせることで軽減できる.
オプティマイゼーションの方向性
この戦略は,次の方法でさらに最適化できます.
- 異なるATR長度パラメータをテストする
- ストップ・ロスの戦略を追加します
- 他の指標を組み合わせて 偽のブレイクをフィルタリングする
- 入国・退出基準の最適化
結論
この戦略は,低波動性購入戦略と高波動性購入戦略のパフォーマンスを効果的に比較することができます.SMAを使用してATRをスムーズにし,波動性レベルに基づいて取引信号を生成します. 戦略はパラメータ調節と最適化条件によって改善できます. 全体的に,この戦略は波動性ベースの戦略の研究のための効果的なツールを提供します.
/*backtest
start: 2023-01-01 00:00:00
end: 2024-01-07 00:00:00
period: 1d
basePeriod: 1h
exchanges: [{"eid":"Futures_Binance","currency":"BTC_USDT"}]
*/

// This source code is subject to the terms of the Mozilla Public License 2.0 at https://mozilla.org/MPL/2.0/
// © I11L

//@version=5
strategy("I11L - Better Buy Low Volatility or High Volatility?", overlay=false)

mode = input.string("Buy low Volatility",options = ["Buy low Volatility","Buy high Volatility"])
volatilityTargetRatio = input.float(1,minval = 0, maxval = 100,step=0.1, tooltip="1 equals the average atr for the security, a lower value means that the volatility is lower")
atrLength = input.int(14)

atr = ta.atr(atrLength) / close
avg_atr = ta.sma(atr,atrLength*5)
ratio = atr / avg_atr

sellAfterNBarsLength = input.int(5, step=5, minval=0)


var holdingBarsCounter = 0

if(strategy.opentrades > 0)
    holdingBarsCounter := holdingBarsCounter + 1


isBuy = false

if(mode == "Buy low Volatility")
    isBuy := ratio < volatilityTargetRatio
else
    isBuy := ratio > volatilityTargetRatio

isClose = holdingBarsCounter > sellAfterNBarsLength


if(isBuy)
    strategy.entry("Buy",strategy.long)

if(isClose)
    holdingBarsCounter := 0
    strategy.exit("Close",limit=close)

plot(ratio, color=isBuy[1] ? color.green : isClose[1] ? color.red : color.white)
plot(1, color=color.white)
もっと
- 2つの移動平均振動のブレイク戦略
- 適応性波動性ブレイクアウト戦略
- Ethereum トレーディングのためのスーパートレンド戦略
- EMA・クロスオーバーとMACD・シグナルのトレンド 戦略をフォローする
- 多重クロスオーバー カメと重度の移動平均とMACDと TSIの組み合わせ戦略
- DEMAとEMAのクロスオーバーをベースにしたモメント戦略とATR波動性フィルター
- リバースとSL/TPの拡張を伴う連続上下戦略
- 素数帯のバックテスト戦略
- RSIのトレード戦略
- 単指数式平滑動平均値とストップ損失トレンドをフォローする戦略
- 指数関数移動平均のクロスオーバー戦略
- 複数のタイムフレームをフォローするストップ損失戦略
- モメント 双動窓 TSI インディケーター
- RSI と ボリンガー帯 収益性の高い戦略
- カンドル・クローズ・戦略で買い/売る
- スーパートレンド 利益戦略
- 価格チャネル傾向 戦略をフォローする
- 2つの移動平均対トレンド戦略
- ポジティブバー % ブレイクアウト戦略
- RSIの二重トレック突破戦略