タグ:

概要
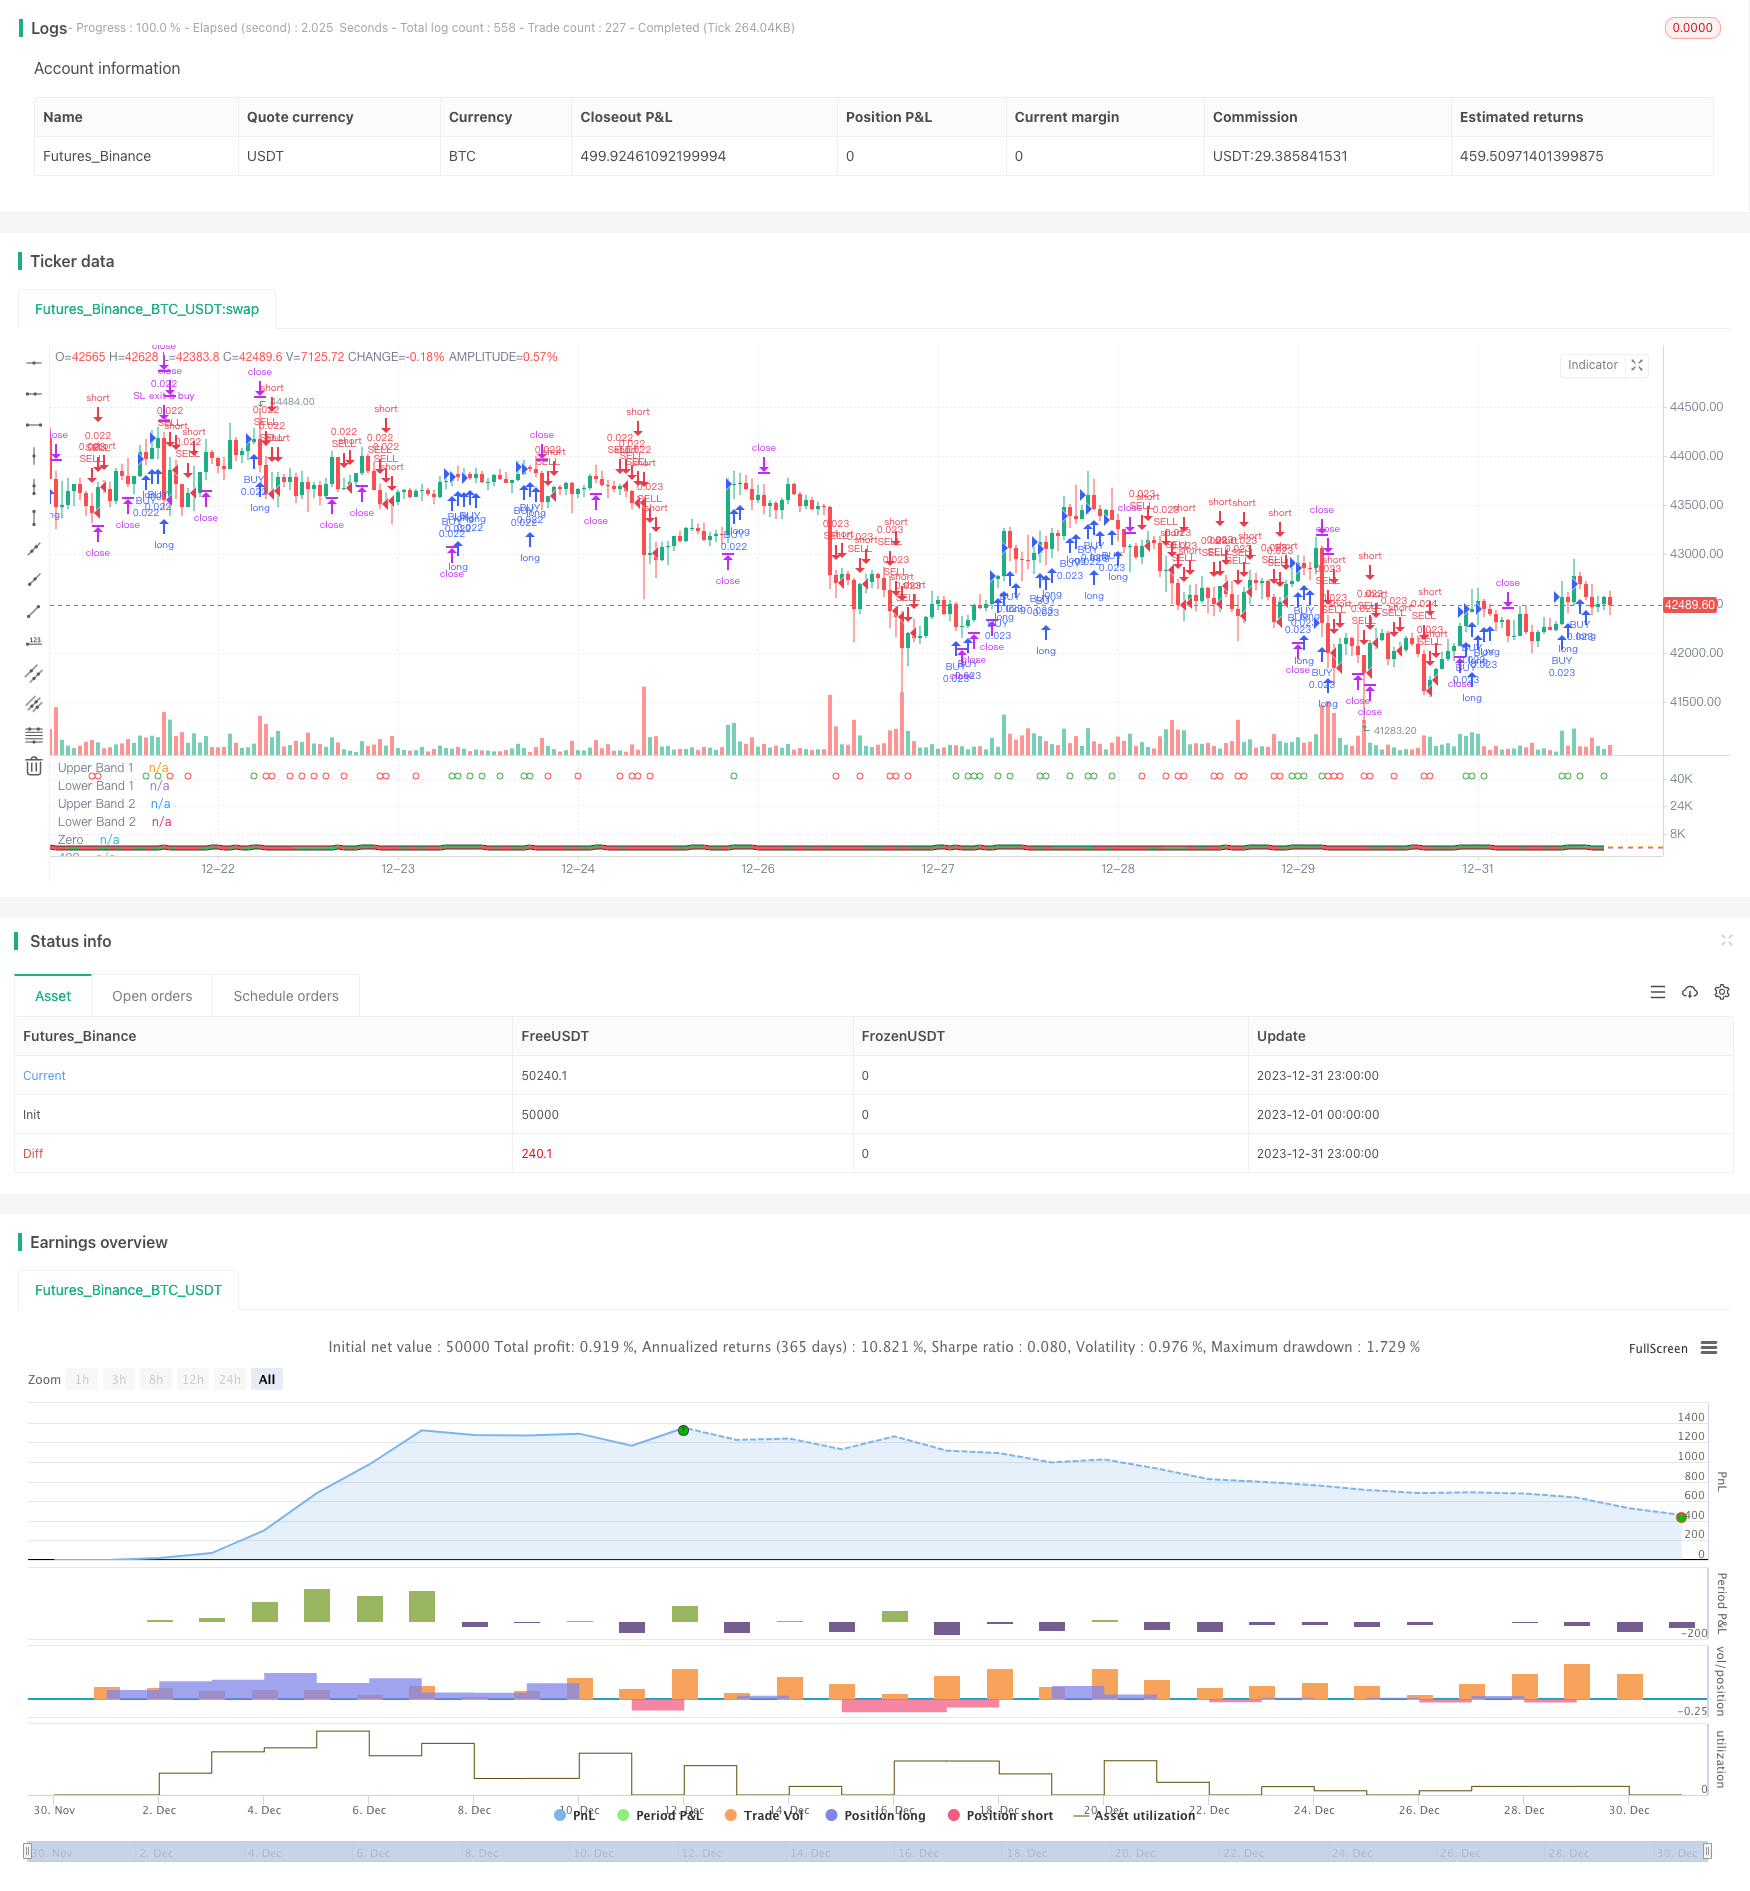
この戦略は,TSIの二国間取引シグナルと改良されたCCI指標を組み合わせ,より安定した継続的な利益を追求することを目的として,頻繁にオープンおよび閉鎖するポジションに対するヘッジアプローチを採用している.鍵となる論理は,TSI指標の高速およびゆっくり移動する平均値の黄金十字と死十字であり,市場方向性を決定するためにHMACCI指標の購入および販売信号と組み合わせられる.リスクは開設条件を制限することによって制御され,ストップ損失と利益の論理が設定される.
戦略原則
この戦略は主に TSIとHMACCI指標の組み合わせに基づいています.
TSI指標は,取引シグナルを決定するための高速移動平均値と遅い平均値を含みます.高速線がスローラインを上向きに突破すると,それは購入信号であり,販売信号の逆です.これは市場の動向の変化をより敏感に捉えることができます.
HMACCI指標は,価格自体ではなく,Hull Moving Averageを使用した従来のCCI指標に基づいています.これはノイズの一部をフィルタリングし,過買い・過売りゾーンを判断できます.過買い・過売りゾーンは,TSI指標の信号方向性をさらに確認できます.
この戦略の主要な論理は,これらの2つの指標の判断を組み合わせ,逆転信号の質を制御するために,以前のバーの閉値と最大値と最低値を複数の期間にわたって調べることなど,誤った信号をフィルタリングするための特定の追加条件を設定することです.
オープンポジションでは,条件が満たされている場合,市場オーダーはバーが閉じるたびに,ロングとショートの両方を行う.これはより安定したリターンを得ることができますが,ヘッジ戦略のリスクを承ります.
利益とストップ・ロスは,浮動ストップ・ロストと目標利益に達するとすべてのオーダーを閉じるように設定されています.これは一方的な取引のリスクを効果的に制御できます.
戦略 の 利点
これは比較的安定し信頼性の高い高周波ヘッジ戦略です.主な利点は以下の通りです.
- 双方の指標を組み合わせることで 誤った信号を効果的に回避できます
- 頻繁なヘージング・オペレーションは,利益と損失の変動を安定させる.
- 厳格な開口論理とストップ・ロスの条件はリスクを制御できる
- トレンドと逆転判断を組み合わせることで,より高い欠陥容量が得られます
- 方向性偏差がないため,様々な市場条件に適しています
- 異なる製品に最適化することができます
リスク分析
注目すべき主なリスクは以下のとおりです.
- 高周波取引による手数料損失が増加
に閉じ込められることを完全に避けられない - パラメータが正しく設定されていない場合,過度に攻撃的な入力
- 短期的に一方向的な大きな損失に耐え難い
リスクは以下によって軽減できます.
- 低料金効果のために開口頻度を適切に調整する
- 信号品質を確保するために指標パラメータを最適化
- ストップ・ロスの幅を拡大するが,より多くのヘージング損失を負う.
- 異なる製品での試験パラメータ
オプティマイゼーションの方向性
この戦略を最適化するには まだ大きな余地があります.
- テストを通じて期間,長さなどパラメータを最適化
- MACD,BOLLなど
- オープンロジックを変更し,厳格なフィルターを設定する
- 収益とストップ・ロスの戦略を最適化する.例えば,ダイナミック,ブレイクストップ
- より安定したパラメータ範囲を見つけるために機械学習方法を使用する
- 異なる取引製品と時間枠でのテスト
- 範囲限定市場での過度に積極的な取引を避けるためにトレンド検出を組み合わせる
結論
この戦略は,高故障耐性を持つ安定で信頼性の高いヘジング戦略である.傾向と逆転指標を組み合わせ,頻繁な二方向取引を通じて安定した収益を得ている.また,戦略自体には最適化の可能性が高く,さらに研究する価値のある高周波取引のアイデアを代表している.
/*backtest
start: 2023-12-01 00:00:00
end: 2023-12-31 23:59:59
period: 1h
basePeriod: 15m
exchanges: [{"eid":"Futures_Binance","currency":"BTC_USDT"}]
*/

// This source code is subject to the terms of the suns bipolarity
//©SeaSide420
//@version=4
strategy(title="TSI HMA CCI", default_qty_type=strategy.cash,default_qty_value=1000,commission_type=strategy.commission.percent,commission_value=0.001)
long = input(title="TSI Long Length", type=input.integer, defval=25)
short = input(title="TSI Short Length", type=input.integer, defval=25)
signal = input(title="TSI Signal Length", type=input.integer, defval=13)
length = input(33, minval=1, title="HMACCI Length")
src = input(open, title="Price Source")
ld = input(50, minval=1, title="Line Distance")
CandlesBack = input(8,minval=1,title="Candles Look Back")
StopLoss= input(3000,minval=1, title="Stop Loss")
TargetProfitAll= input(3000,minval=1, title="Target Profit Close All")
FromMonth=input(defval=1,title="FromMonth",minval=1,maxval=12)
FromDay=input(defval=1,title="FromDay",minval=1,maxval=31)
FromYear=input(defval=2020,title="FromYear",minval=2020)
ToMonth=input(defval=1,title="ToMonth",minval=1,maxval=12)
ToDay=input(defval=1,title="ToDay",minval=1,maxval=31)
ToYear=input(defval=9999,title="ToYear",minval=2017)
start=timestamp(FromYear,FromMonth,FromDay,00,00)
finish=timestamp(ToYear,ToMonth,ToDay,23,59)
window()=>true
ul = (ld)
ll = (ld-ld*2)
ma = hma(src, length)
cci = (src - ma) / (0.015 * dev(src, length))
price = close
double_smooth(src, long, short) =>
	fist_smooth = ema(src, long)
	ema(fist_smooth, short)
pc = change(price)
double_smoothed_pc = double_smooth(pc, long, short)
double_smoothed_abs_pc = double_smooth(abs(pc), long, short)
tsi_value = 100 * (double_smoothed_pc / double_smoothed_abs_pc)*10
tsi_value2=ema(tsi_value/10, signal)*10
cc = color.white
ct = color.new(color.gray, 90)
if cci<ll or cci[1]<ll
    cc:=color.red
if cci>ul or cci[1]>ul
    cc:=color.green
if cci<ul and cci>ll
    cc:=color.new(color.yellow, 90)
ccc = color.white
if cci>ul
    ccc:=color.green
if cci<cci[1] and cci<ul and cci>ll
    ccc:=color.red
if cci<ll
    ccc:=color.red
if cci>cci[1] and cci>ll and cci<ul
    ccc:=color.green
tsiplot= plot(tsi_value, color=color.lime)
tsiplot2=plot(tsi_value2, color=color.red)
colorchange2 =tsi_value>tsi_value2?color.lime:color.orange
fill(tsiplot, tsiplot2, color=colorchange2, title="TSIBackground", transp=50)
band1 = hline(ul, "Upper Band 1", color=ct, linestyle=hline.style_dashed)
band0 = hline(ll, "Lower Band 1", color=ct, linestyle=hline.style_dashed)
fill(band1, band0, color=cc, title="MidBandBackground", transp=0)
band2 = hline(ul, "Upper Band 2", color=ct, linestyle=hline.style_dashed)
band3 = hline(ll, "Lower Band 2", color=ct, linestyle=hline.style_dashed)
cciplot2 = plot(cci, "CCIvHMA 2", color=color.black, transp=0, linewidth=5)
cciplot = plot(cci, "CCIvHMA", color=ccc, transp=0, linewidth=3)
hline(0, title="Zero")
hline(420, title="420")
hline(-420, title="-420")
fill(cciplot, cciplot2, color=ccc, title="CCIBackground", transp=0)
LongCondition=cci>cci[1] and cci>ll and src>src[CandlesBack] and tsi_value>tsi_value2
ShortCondition=cci<cci[1] and cci<ul and src<src[CandlesBack] and tsi_value<tsi_value2
plotshape(LongCondition, title="BUY", style=shape.circle, location=location.top, color=color.green)
plotshape(ShortCondition, title="SELL", style=shape.circle, location=location.top, color=color.red)
if  strategy.openprofit>TargetProfitAll
    strategy.close_all(when=window(),comment="close all profit target")
if LongCondition and strategy.openprofit>-1
    strategy.order("BUY", strategy.long,when=window())
if ShortCondition and strategy.openprofit>-1
    strategy.order("SELL", strategy.short,when=window())
strategy.exit("SL exit a sell", "SELL", loss = StopLoss,when=window())
strategy.exit("SL exit a buy", "BUY", loss = StopLoss,when=window())
- 勢いと恐怖指数のクロスオーバー戦略
- 日々のピボットポイントに基づく自動ロング/ショート取引戦略
- トリプル・ムービング・平均量的な取引戦略
- 指数関数移動平均に基づくモメンタムクロスオーバー戦略
- アダプティブ・ムービング・メアダと重度のムービング・メアダのクロスオーバー・トレーディング戦略
- 累計多時間枠MACD RSI CCI StochRSI MA 線形取引戦略
- 多期MACDトレンド フォローする戦略
- トレンドフォロー トレーディング戦略 MACD と RSI に基づく
- 戦略をフォローするダブル移動平均クロスオーバーMACDトレンド
- 双移動平均金十字アルゴリズム
- ゴールデンクロス デスクロス 長期多要素戦略
- RSI ダイバージェンツ・トレーディング戦略
- 戦略をフォローする多期間の傾向
- ダイナミック・グリッド・トレーディング・戦略
- 双向移動平均の確証メリットライン戦略
- クリプト RSI ミニスナイパー 迅速対応 トレンド 戦略をフォローする