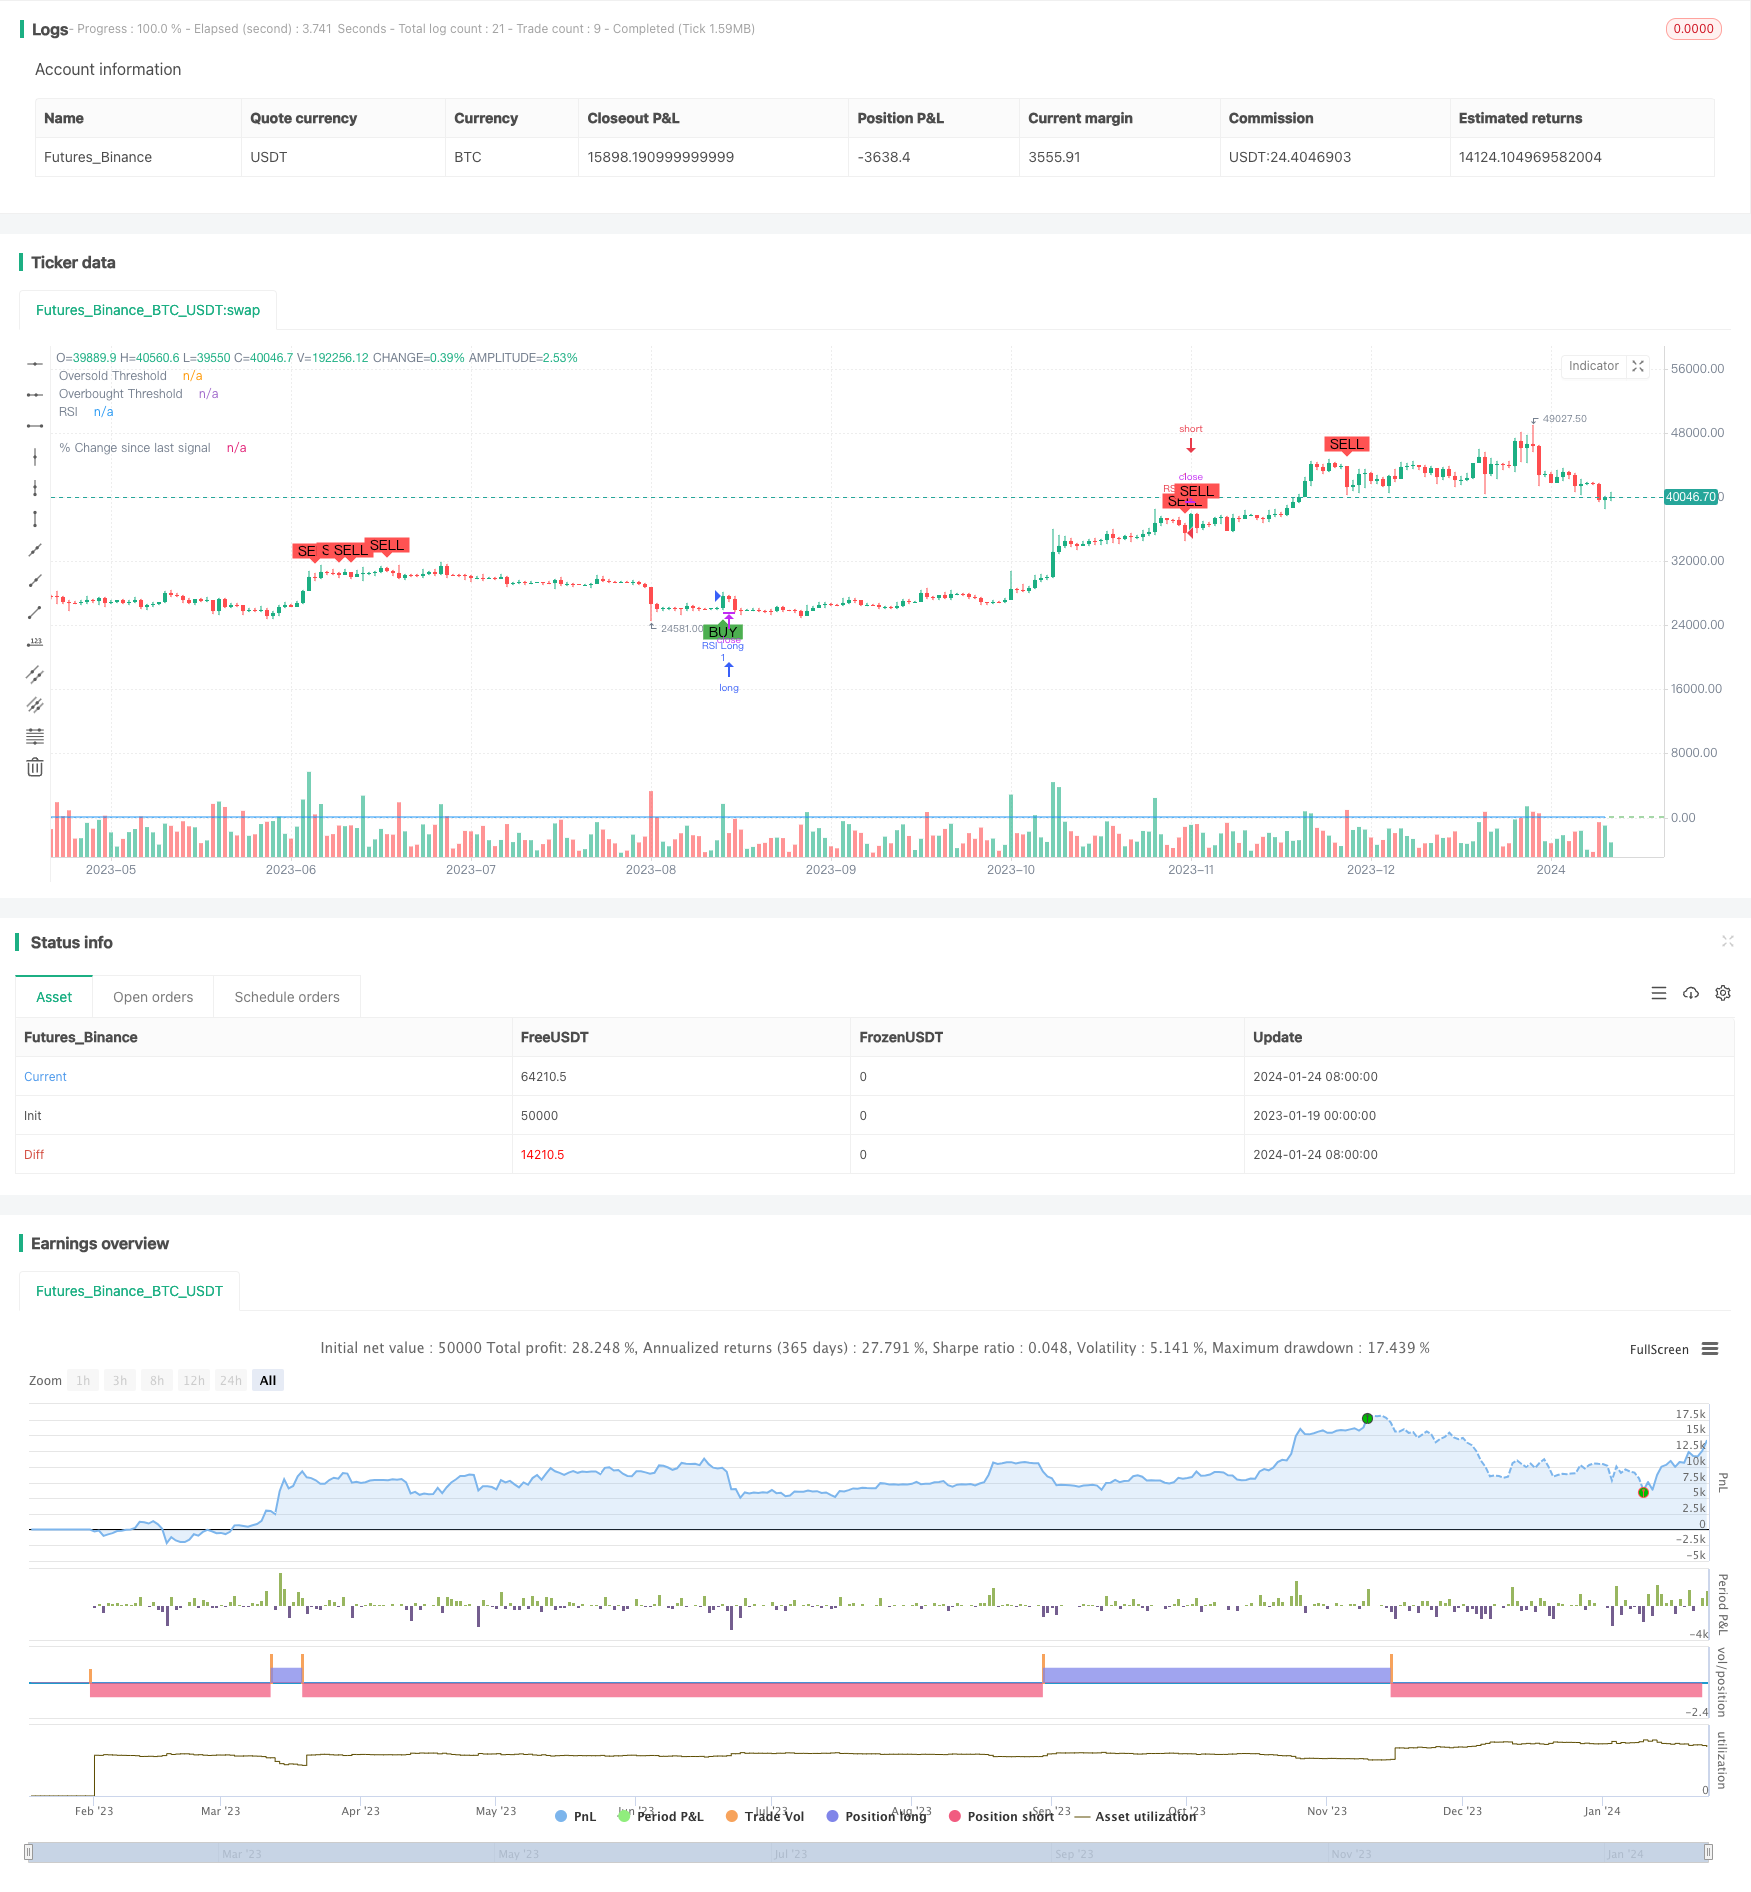
モメント・リバーサル・トレーディング・戦略
作者: リン・ハーンチャオチャンタグ:

概要
戦略の論理
利点分析
- RSIの過買い/過売り判断能力を利用し,逆転を効果的に識別する.
リスク分析
オプティマイゼーションの方向性
- 単一の取引損失を制御するためにストップロスを追加する
- 異なる長さの試験RSI期間
- 市場状況に基づいて,過剰購入/過剰販売の限界値を最適化する
概要
/*backtest
start: 2023-01-19 00:00:00
end: 2024-01-25 00:00:00
period: 1d
basePeriod: 1h
exchanges: [{"eid":"Futures_Binance","currency":"BTC_USDT"}]
*/

//@version=5
strategy("Improved RSI Strategy", overlay=true)

// Define RSI parameters
rsiLength = input(14, title="RSI Length")
rsiOversold = input(30, title="Oversold Threshold")
rsiOverbought = input(70, title="Overbought Threshold")

// Calculate RSI
rsiValue = ta.rsi(close, rsiLength)

// Define entry conditions
longCondition = ta.crossover(rsiValue, rsiOversold)
shortCondition = ta.crossunder(rsiValue, rsiOverbought)

// Plot RSI and thresholds
plot(rsiValue, title="RSI", color=color.blue)
hline(rsiOversold, title="Oversold Threshold", color=color.red)
hline(rsiOverbought, title="Overbought Threshold", color=color.green)

// Calculate percentage change since last signal
var float percentageChange = na
lastCloseValue = ta.valuewhen(longCondition or shortCondition, close, 1)

if longCondition or shortCondition
    percentageChange := (close - lastCloseValue) / lastCloseValue * 100

plot(percentageChange, color=color.blue, style=plot.style_histogram, linewidth=1, title="% Change since last signal")

// Execute strategy
if longCondition
    strategy.entry("RSI Long", strategy.long)

if shortCondition
    strategy.entry("RSI Short", strategy.short)

// Plot shapes and text for buy/sell signals
plotshape(series=longCondition, title="Buy Signal", location=location.belowbar, color=color.green, style=shape.labelup, text="BUY")
plotshape(series=shortCondition, title="Sell Signal", location=location.abovebar, color=color.red, style=shape.labeldown, text="SELL")
もっと
- アダプティブ・トリプル・スーパートレンド戦略
- 移動平均のクロスオーバー戦略
- 重要な逆転バックテスト戦略
- 3つのEMAストカスティックRSIクロスオーバーゴールデンクロス戦略
- 逆転キャンドルスタイクバックテスト戦略
- エーラースムーズストカスティックRSI戦略
- アダプティブな線形回帰チャネル戦略
- 移動平均差ゼロクロス戦略
- 複数の指標が 戦略に従っている
- 戦略をフォローする堅調な傾向
- 戦略を踏まえて 価格の移動平均線を横切る
- 双 EMA ゴールデンクロス ブレイクストラテジー
- 段階的なBB KC トレンド戦略
- トリプル SMA オートトラッキング戦略
- ビットコイン・フューチャー・ポジション・トレーディング・戦略
- 機械学習に基づくストカスティック最適化による価格EMA