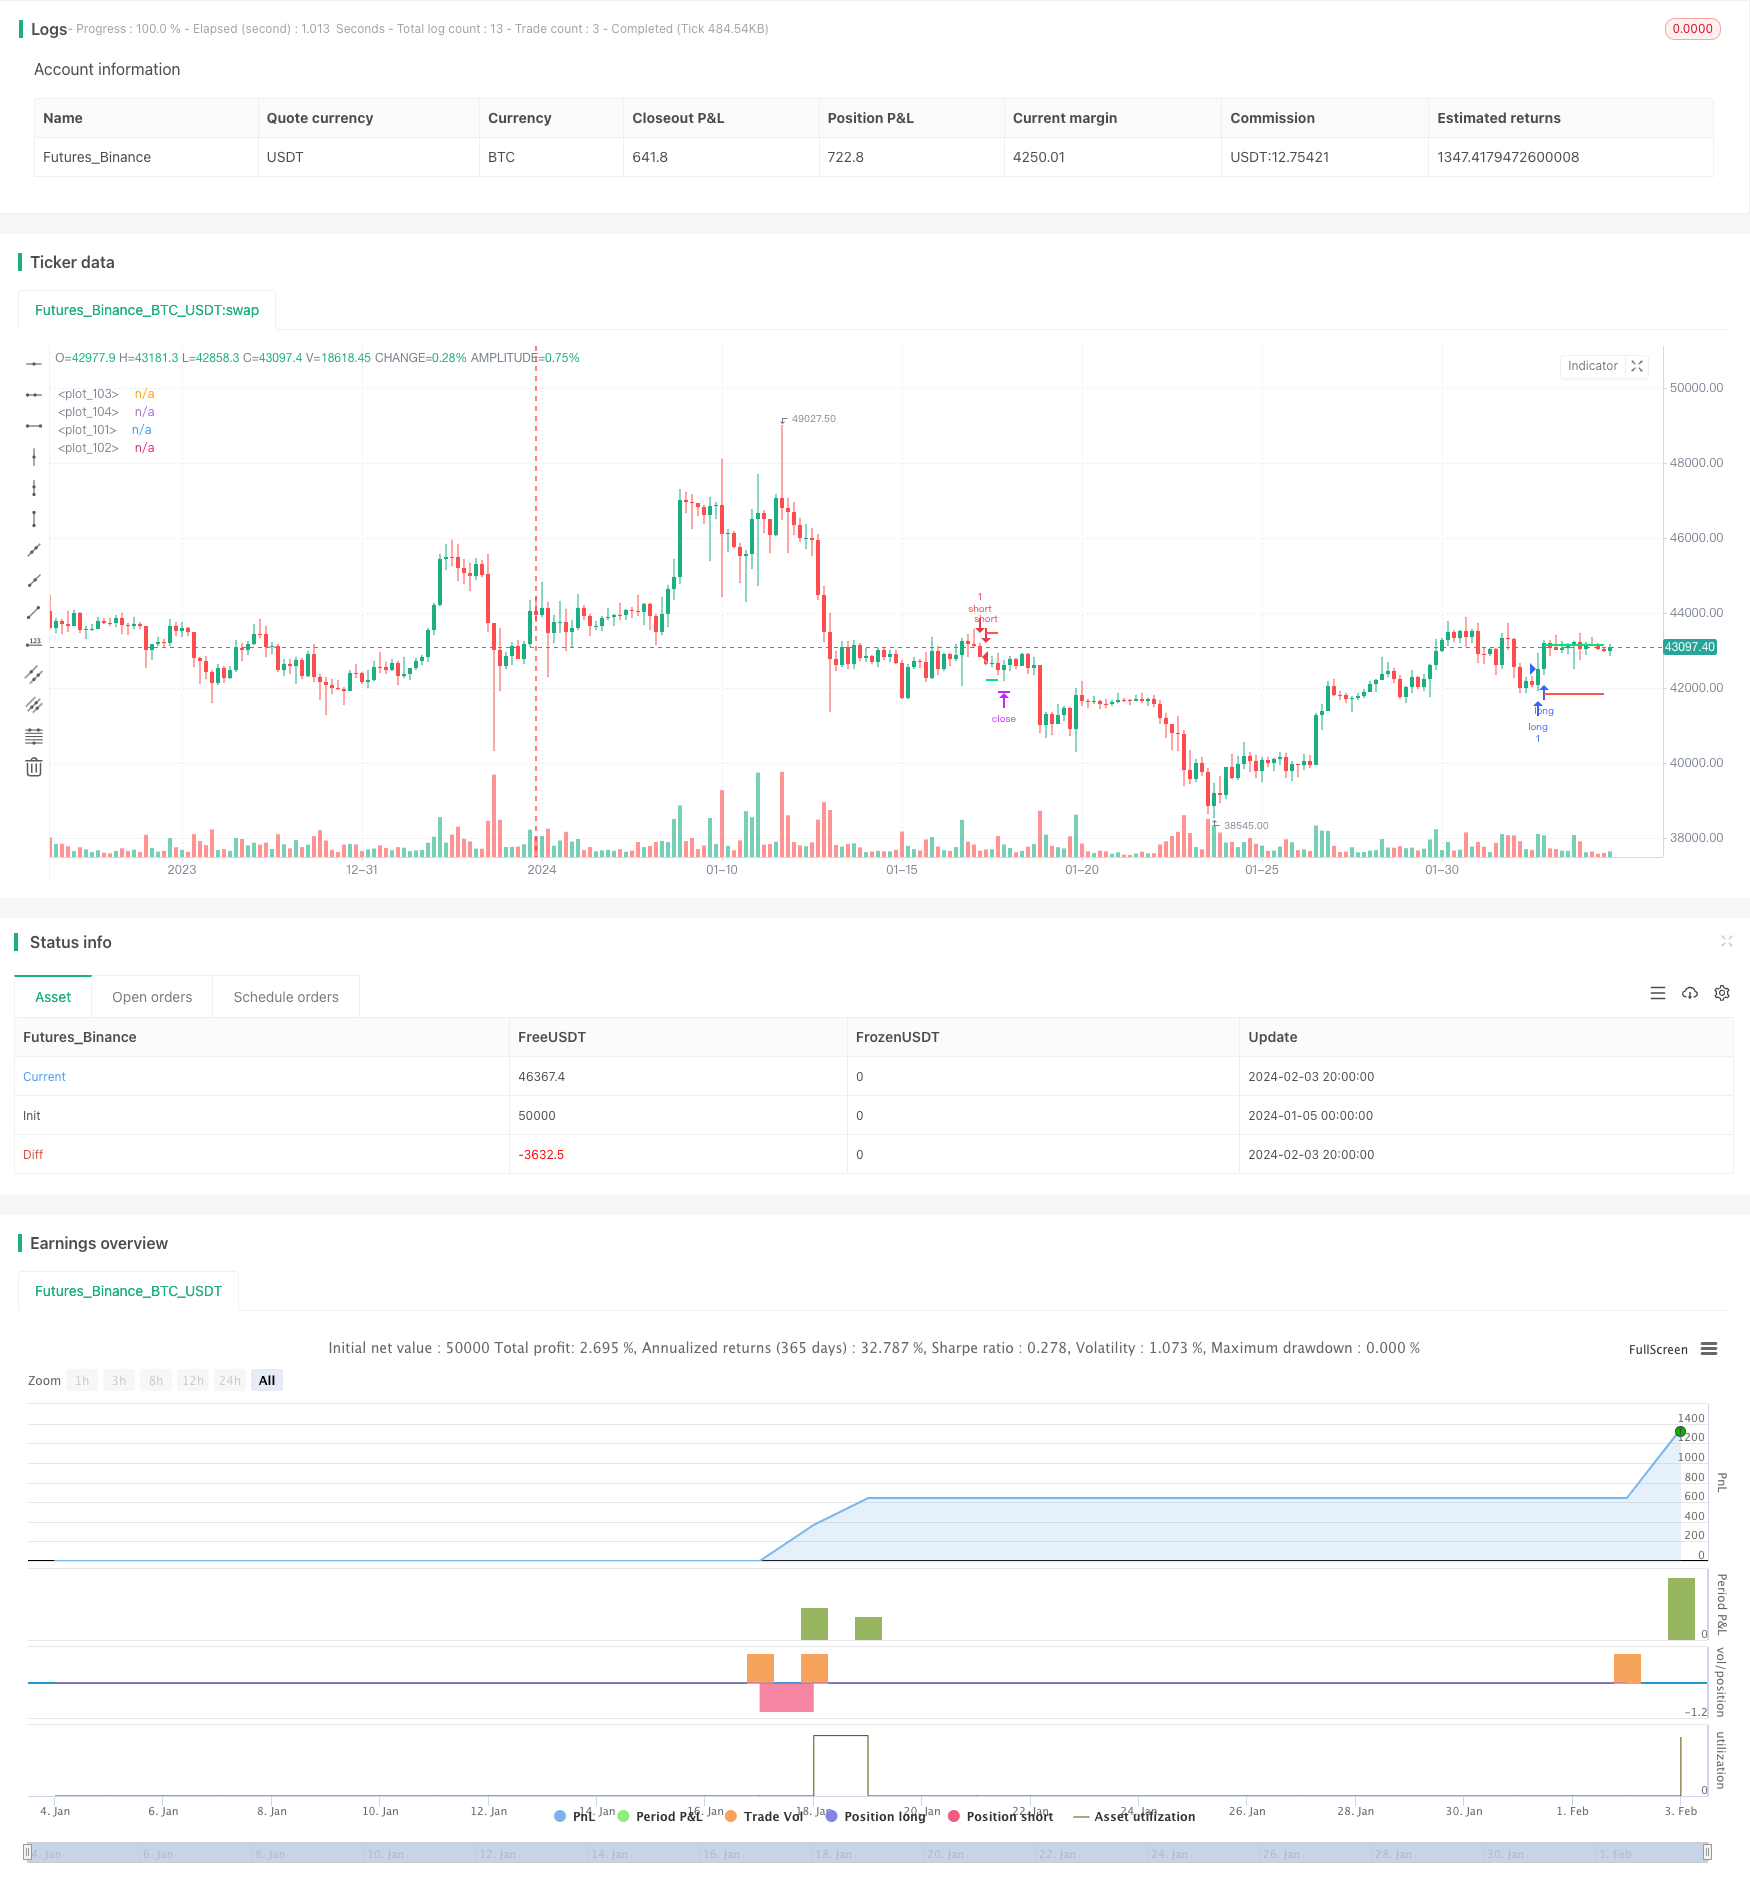
イチモク・クラウド,MACD,ストカスティックベースのマルチタイムフレームトレンド追跡戦略
作者: リン・ハーンチャオチャン開催日:2024-02-05 10:30:45タグ:

概要
この戦略は,複数のタイムフレームのトレンドを特定し追跡するために,イチモククラウド,移動平均,MACD,ストカスティックおよびATR指標を統合しています.高確率トレンド信号を取得した後,ATRベースのストップ損失と利益方法を使用してリスクを制御します.
戦略の論理
-
イチモク・クラウドは,中期および長期的トレンド方向を判断します. イチモク
のターニングラインとベースラインの上をクロスする CLOSE価格は上昇信号であり,下をクロスすることは下落信号です. -
MACDは短期的な傾向や過買い/過売状況を判断する.MACD信号線の上を横切るMACDヒストグラムは上昇信号であり,下を横切るMACDヒストグラムは下落信号である.
-
ストキャスティックKDは過買い/過売ゾーンを判断します.K線が20を超えると上昇信号で,80を下回ると下落信号です.
-
移動平均は中期トレンドを判断します.MAを超える価格の接近は上昇信号であり,下を横切るのは下落信号です.
-
上記の指標からの信号を統合して,いくつかの誤った信号をフィルタリングし,高い確率の持続的なトレンド信号を形成します.
-
ストップ・ロスを計算し,利益を取るためにATRを使用します.リスクを制御するために,ストップ・ロスを計算し,利益を取るためにATRの一定倍数を使用します.
利点
-
信号の正確性を向上させるため,複数のタイムフレームのトレンドを特定します.
-
誤った信号を効果的にフィルタリングするために,インジケーターコンボを広く使用します.
-
ATRベースのストップ・ロスト&テイク・プロフィット 取引損失に対する重要な制限
-
入国条件の厳格さは 異なるリスク欲求に対応します
リスク
-
自然に続く傾向は ブラック・スワン事件による逆転を検出できていません
-
理想的なATRストップロスは ライブ取引で完全に複製するのは難しい
-
パラメータの設定が正しくない場合,過剰取引または信号の正確性が不十分になる可能性があります.
-
パラメータの調整は 異なる製品や市場環境に合わせて 必要になります
強化 分野
-
傾向の逆転点を判断するのに役立つ機械学習を導入します
-
異なる製品に対してATR倍数パラメータ値を最適化する.
-
突破信号の精度を向上させるため 音量変化などの他の要因を組み込む
-
バックテスト結果に基づいて パラメータを最適化して 最高のパラメータの組み合わせを見つけます
概要
この戦略は,マルチタイムフレームのトレンド識別のためにIchimoku Cloud,MACD,ストカスティックなどを利用し,ブラック・スワンイベントに囚われないようにしながらトレンドを把握する.ATRベースのストップ・ロスト&テイク・プロフィートは,取引損失を効果的に制限する.より多くの補助判断と機械学習方法が導入され,この戦略はさらなる最適化可能性を秘めている.
/*backtest
start: 2024-01-05 00:00:00
end: 2024-02-04 00:00:00
period: 4h
basePeriod: 15m
exchanges: [{"eid":"Futures_Binance","currency":"BTC_USDT"}]
*/

// This source code is subject to the terms of the Mozilla Public License 2.0 at https://mozilla.org/MPL/2.0/
// © FXFUNDINGMATE

//@version=4
strategy(title="FXFUNDINGMATE TREND INDICATOR", overlay=true)

//Ichimoku Cloud
conversionPeriods = input(9, minval=1, title="Conversion Line Length")
basePeriods = input(26, minval=1, title="Base Line Length")
laggingSpan2Periods = input(52, minval=1, title="Lagging Span 2 Length")
displacement = input(26, minval=1, title="Displacement")
donchian(len) => avg(lowest(len), highest(len))
conversionLine = donchian(conversionPeriods)
baseLine = donchian(basePeriods)
leadLine1 = avg(conversionLine, baseLine)[displacement - 1]
leadLine2 = donchian(laggingSpan2Periods)[displacement - 1]


//macd
fast_length = input(title="Fast Length", type=input.integer, defval=12)
slow_length = input(title="Slow Length", type=input.integer, defval=26)
src = input(title="Source", type=input.source, defval=close)
signal_length = input(title="Signal Smoothing", type=input.integer, minval = 1, maxval = 50, defval = 9)
sma_source = input(title="Simple MA (Oscillator)", type=input.bool, defval=false)
sma_signal = input(title="Simple MA (Signal Line)", type=input.bool, defval=false)

fast_ma = sma_source ? sma(src, fast_length) : ema(src, fast_length)
slow_ma = sma_source ? sma(src, slow_length) : ema(src, slow_length)
macd = fast_ma - slow_ma
signal = sma_signal ? sma(macd, signal_length) : ema(macd, signal_length)
hist = macd - signal


//kd
periodK = input(5, title="%K Length", minval=1)
smoothK = input(3, title="%K Smoothing", minval=1)
periodD = input(3, title="%D Smoothing", minval=1)
k = sma(stoch(close, high, low, periodK), smoothK)
d = sma(k, periodD)


//atr
atrlength = input(title="Atr Length", defval=8, minval=1)
SMulti = input(title="Stop loss multi Atr", defval=1.0)
TMulti = input(title="Take profit multi Atr", defval=1.0)
smoothing = input(title="Smoothing", defval="RMA", options=["RMA", "SMA", "EMA", "WMA"])
ma_function(source, length) =>
	if smoothing == "RMA"
		rma(source, length)
	else
		if smoothing == "SMA"
			sma(source, length)
		else
			if smoothing == "EMA"
				ema(source, length)
			else
				wma(source, length)
atr = ma_function(tr(true), atrlength)


operation_type = input(defval = "Both", title = "Position side", options = ["Long", "Short", "Both"])
operation = operation_type == "Long" ? 1 : operation_type == "Short" ? 2 : 3
showlines = input(true,  title="Show sl&tp lines")

// MA
sma_len = input(100, title="MA Length", type=input.integer)
sma = sma(close, sma_len)

longCond = crossover(k, 20) and macd > 0 and close > sma and close > leadLine1 and close > leadLine2
shortCond = crossunder(k, 80)  and macd < 0 and close < sma and close < leadLine1 and close < leadLine2

entry_price  = float(0.0) //set float
entry_price := strategy.position_size != 0 or longCond or shortCond ? strategy.position_avg_price : entry_price[1]
entry_atr = valuewhen(longCond or shortCond, atr,0)
short_stop_level     = float(0.0)   //set float
short_profit_level   = float(0.0)   //set float
long_stop_level      = float(0.0)   //set float
long_profit_level    = float(0.0)   //set float
short_stop_level    := entry_price + SMulti * entry_atr
short_profit_level  := entry_price - TMulti * entry_atr
long_stop_level     := entry_price - SMulti * entry_atr
long_profit_level   := entry_price + TMulti * entry_atr


//  Strategy Backtest Limiting Algorithm
i_startTime = input(defval = timestamp("1 Jan 2020 00:00 +0000"), title = "Backtesting Start Time", type = input.time)
i_endTime = input(defval = timestamp("31 Dec 2025 23:59 +0000"), title = "Backtesting End Time", type = input.time)
timeCond = true

if (operation == 1 or operation == 3)
    strategy.entry("long" , strategy.long , when=longCond and timeCond, alert_message = "Long")
    strategy.exit("SL/TP", from_entry = "long" , limit = long_profit_level , stop = long_stop_level , alert_message = "Long exit")

if (operation == 2 or operation == 3)
    strategy.entry("short", strategy.short, when=shortCond and timeCond, alert_message="Short")
    strategy.exit("SL/TP", from_entry = "short", limit = short_profit_level , stop = short_stop_level , alert_message = "Short exit")

if time > i_endTime
    strategy.close_all(comment = "close all", alert_message = "close all")

plot(showlines and strategy.position_size <= 0 ? na : long_stop_level,    color=color.red,  style=plot.style_linebr, linewidth = 2)
plot(showlines and strategy.position_size <= 0 ? na : long_profit_level,  color=color.lime, style=plot.style_linebr, linewidth = 2)
plot(showlines and strategy.position_size >= 0 ? na : short_stop_level,   color=color.red,  style=plot.style_linebr, linewidth = 2)
plot(showlines and strategy.position_size >= 0 ? na : short_profit_level, color=color.lime, style=plot.style_linebr, linewidth = 2)

//}
- 移動平均値に基づく戦略をフォローするスーパートレンド
- RSIの取引戦略を把握する
- RSI に 基づく ボリンジャー バンド と トレンド トレーキング 戦略
- 安定した二重移動平均取引戦略
- ボリンジャー・バンド・モメンタム・ブレークアウト・トレード・戦略
- 5日間の移動平均帯域とGBSの買い/売るシグナルに基づいた定量的な取引戦略
- 2つの移動平均オシレーター株式戦略
- モメントスウィング・トレーディング戦略
- 動的PSARストック変動追跡戦略
- 閉じる価格比較 双向移動平均のクロスオーバー戦略
- MACD ボリュームリバース取引戦略
- 動的移動平均のクロスオーバーコンボ戦略
- ウィリー・ウォンカ 脱出戦略
- 指数関数移動平均値と相対強度指数の組み合わせ トレンド 戦略に従う
- 逆転傾向のキャッチとダイナミックストップロスのコンボ戦略
- ゴールデンパラボラのブレイクアウト戦略
- SARモメント逆転追跡戦略
- ダイナミックなRSI取引戦略
- 複数の移動平均値間のクロスオーバー戦略
- 2つの移動平均のブレイクアウト戦略