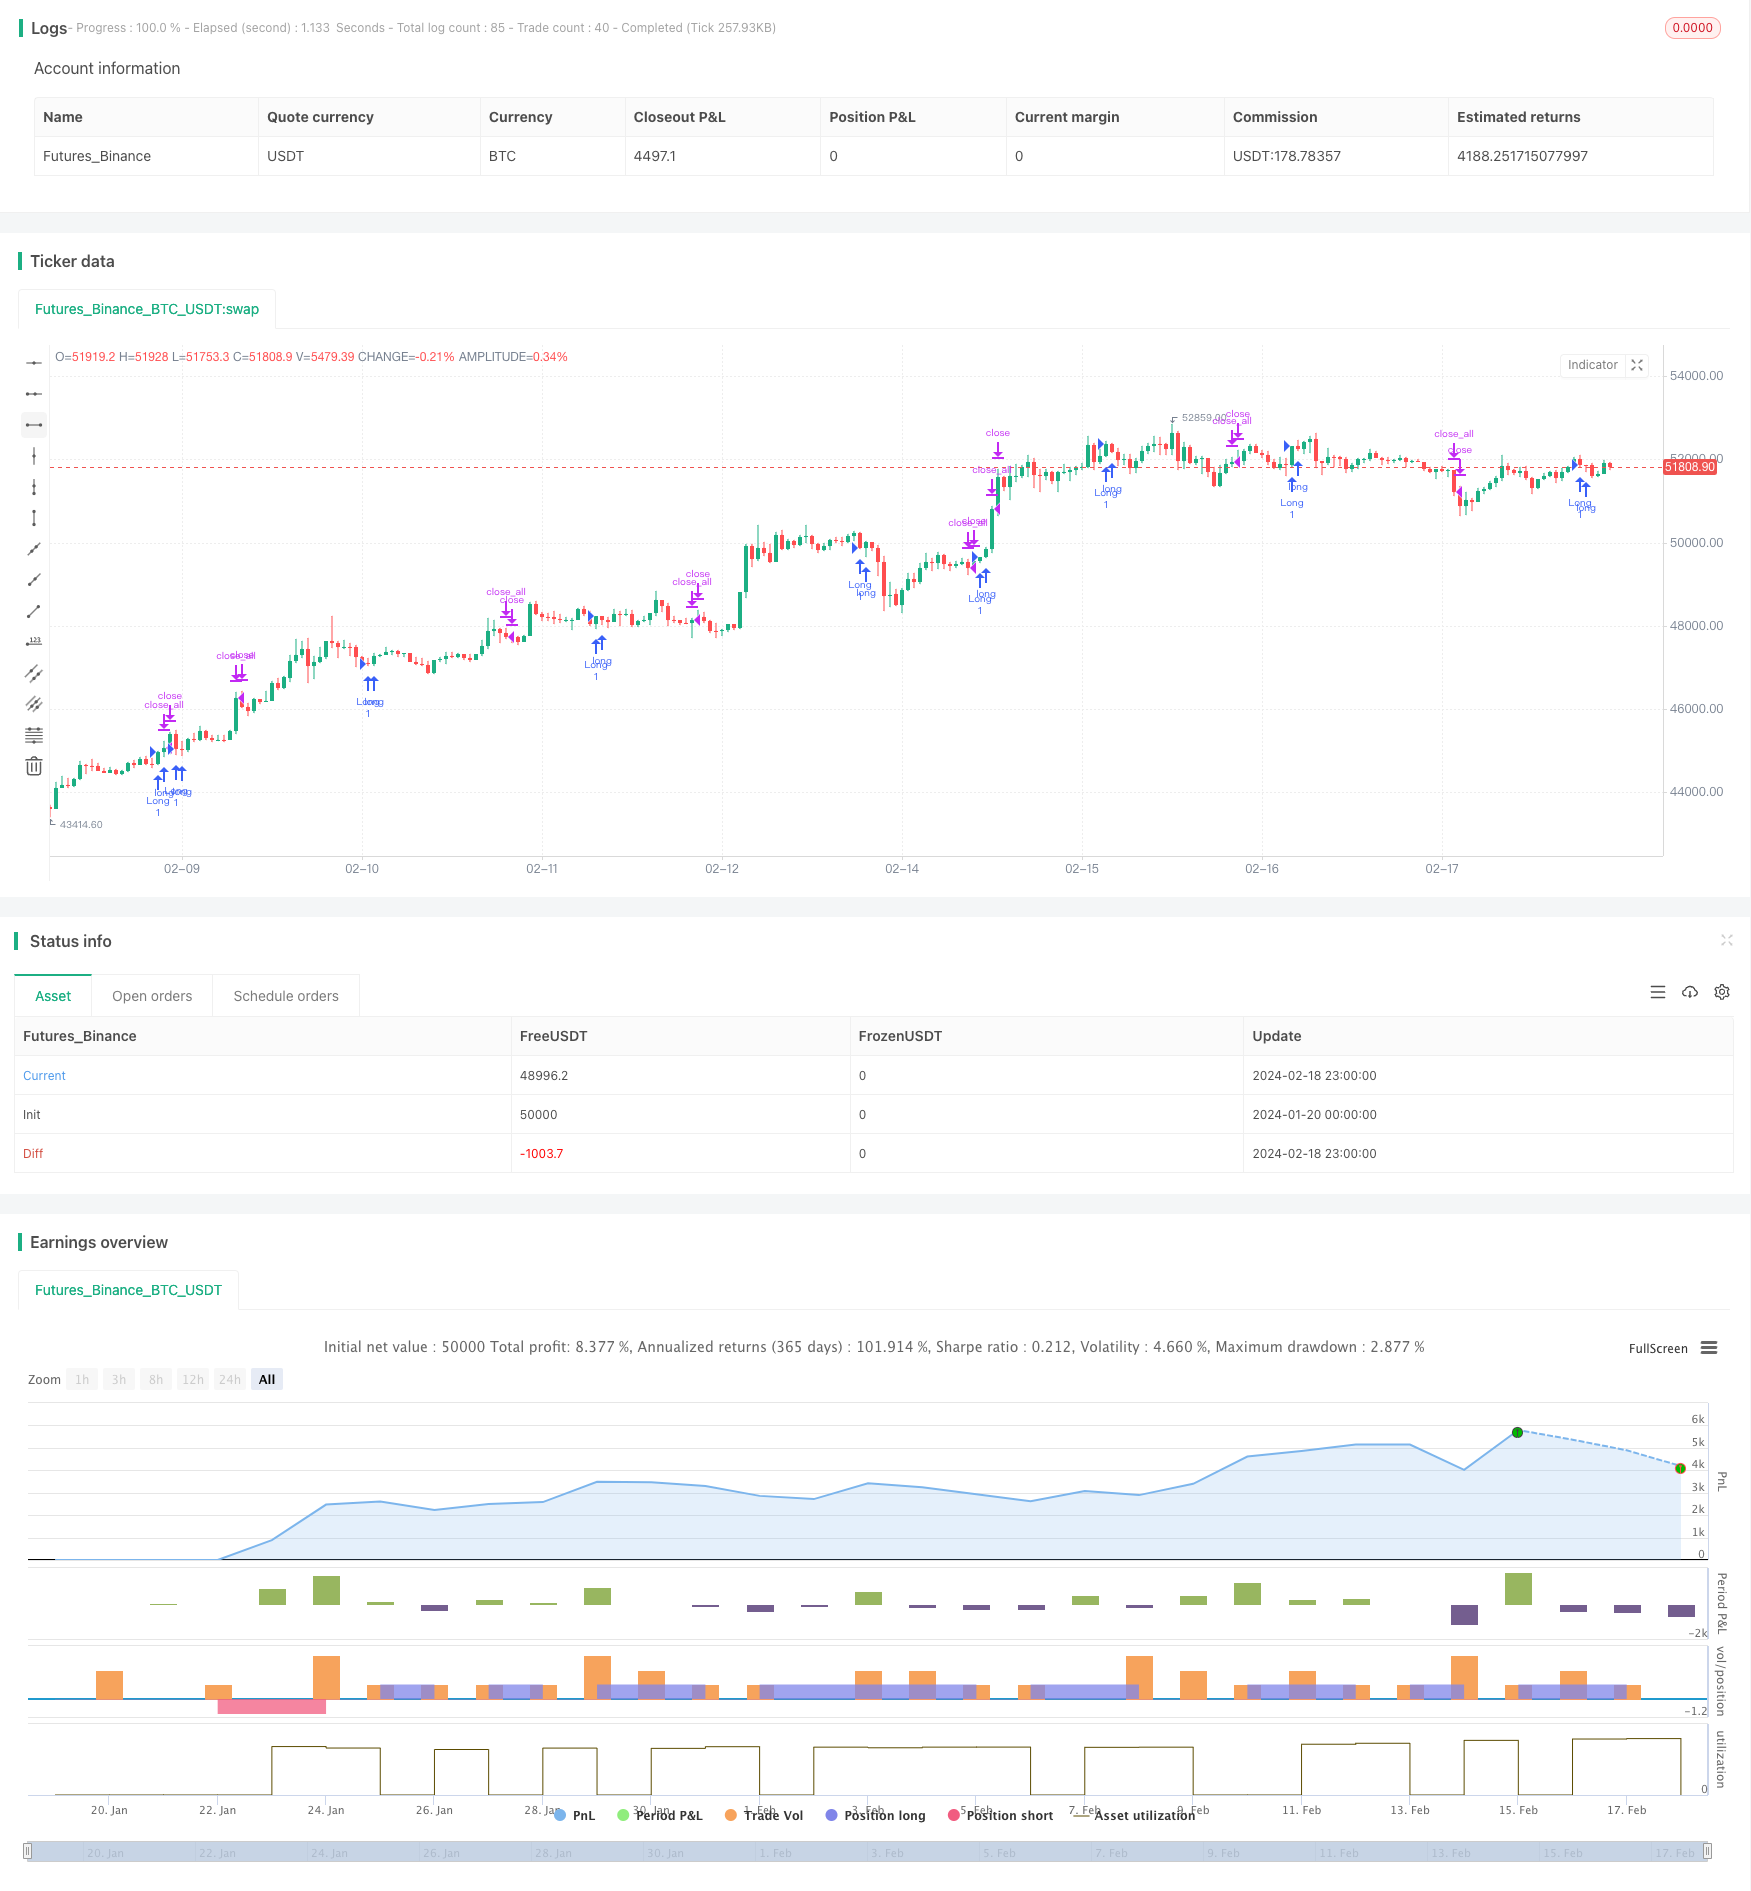
双重確認の逆転モメンタム戦略
作者: リン・ハーンチャオチャン,日付: 2024-02-20 15:27:02タグ:

概要
リバースモメント戦略は,トレンド取引を実施するために価格逆転信号と変動逆転信号を組み合わせます.主に123パターンを用いて価格逆転点を決定し,ドンチアンチャネル波動性を偽信号のフィルターとして使用します.この戦略は中長期保有に適しています.逆転の二重確認により,市場のターニングポイントを効果的に把握し,過剰なリターンを達成することができます.
戦略原則
価格逆転の部分は123パターンを判断するために使用する.このパターンは,最初の2つのKラインの価格が反対方向 (上下) に移動し,第3のKラインが再び (下下) に逆転することを意味します.したがって,123パターンと呼ばれます.価格が3つのKラインが逆転しているときに,通常は短期トレンドが転換しようとしていることを示します.価格逆転の信頼性をさらに検証するために,この戦略はストーキャスティック指標もストーキャスティック指標も逆転するときにのみ取引を誘発するためにストーキャスティック指標を使用します.
波動性逆転部分では,ドンチアンチャネル波動性を利用する.ドンチアンチャネルは主に価格変動範囲を反映する.価格変動が増加すると,ドンチアンチャネルの幅も拡大し,価格変動が減少すると,ドンチアンチャネルの幅も狭くなります.ドンチアンチャネル波動性 (幅) は,市場の波動度とリスクレベルを効果的に測定できます.この戦略は,偽信号をフィルタリングするためにドンチアンチャネル波動性の逆転を使用し,波動性と価格が同時に逆転するときにのみ取引信号を発行し,コールバック操作に巻き込まれないようにします.
この戦略は,取引信号の信頼性を確保し,二重逆転検証によってリスクを制御し,比較的強力なトレンド戦略となっています.
利点
- 二重フィルタリングメカニズムは,取引信号の信頼性を確保し,偽のブレイクを回避します.
- リスクをコントロールし,損失の可能性を減らす
- 中期から長期にわたる保有に適しており,市場の騒音を回避し,過剰な収益を収める
- 最適な状態のために調整できるパラメータのための大きな最適化空間
- ユニークなスタイルは,共通の技術指標と組み合わせてうまく機能します
リスク
- パラメータ最適化に依存し,不適切なパラメータは戦略のパフォーマンスに影響を与える
- ストップ・ロスの戦略はさらに強化され,最大引き上げ制御は改善されなければなりません
- 取引頻度が低く,高周波のアルゴリズム取引に適応できない
- 適した製品と時間枠の選択,限られた適用範囲を必要とします
- 最適なパラメータを見つけるために機械学習を使用できます
オプティマイゼーションの方向性
- 最大引き上げを大幅に減らすために適応ストップ損失モジュールを増やす
- 取引量の指標を導入し,高額ブレイクアウトへの入力を確保する
- 最良の安定性のためにパラメータを最適化
- 最適な製品や時間枠を試して
- 1+1>2のシネージーのための他の指標や戦略と組み合わせてみてください
概要
リバースモメント戦略は,価格逆転と変動逆転の二重確認を通じて良いリスク制御を達成する.単一指標と比較して,多くのノイズをフィルターし,より安定性があります.パラメータ最適化,ストップ損失モジュール,ボリューム導入などを強化することにより,この戦略は信号品質と利益安定性をさらに向上させることができます.株式,暗号通貨などのための中長期戦略の構成要素として適しており,他のモジュールと適切に組み合わせると良い過剰収益を得ることができます.
/*backtest
start: 2024-01-20 00:00:00
end: 2024-02-19 00:00:00
period: 1h
basePeriod: 15m
exchanges: [{"eid":"Futures_Binance","currency":"BTC_USDT"}]
*/

//@version=4
////////////////////////////////////////////////////////////
//  Copyright by HPotter v1.0 06/03/2020
// This is combo strategies for get a cumulative signal.
//
// First strategy
// This System was created from the Book "How I Tripled My Money In The
// Futures Market" by Ulf Jensen, Page 183. This is reverse type of strategies.
// The strategy buys at market, if close price is higher than the previous close
// during 2 days and the meaning of 9-days Stochastic Slow Oscillator is lower than 50.
// The strategy sells at market, if close price is lower than the previous close price
// during 2 days and the meaning of 9-days Stochastic Fast Oscillator is higher than 50.
//
// Second strategy
// The Donchian Channel was developed by Richard Donchian and it could be compared
// to the Bollinger Bands. When it comes to volatility analysis, the Donchian Channel
// Width was created in the same way as the Bollinger Bandwidth technical indicator was.
//
// As was mentioned above the Donchian Channel Width is used in technical analysis to measure
// volatility. Volatility is one of the most important parameters in technical analysis.
// A price trend is not just about a price change. It is also about volume traded during this
// price change and volatility of a this price change. When a technical analyst focuses his/her
// attention solely on price analysis by ignoring volume and volatility, he/she only sees a part
// of a complete picture only. This could lead to a situation when a trader may miss something and
// lose money. Lets take a look at a simple example how volatility may help a trader:
//
//    Most of the price based technical indicators are lagging indicators.
//    When price moves on low volatility, it takes time for a price trend to change its direction and
// it could be ok to have some lag in an indicator.
//    When price moves on high volatility, a price trend changes its direction faster and stronger.
// An indicator's lag acceptable under low volatility could be financially suicidal now - Buy/Sell signals could be generated when it is already too late.
//
// Another use of volatility - very popular one - it is to adapt a stop loss strategy to it:
//    Smaller stop-loss recommended in low volatility periods. If it is not done, a stop-loss could
// be generated when it is too late.
//    Bigger stop-loss recommended in high volatility periods. If it is not done, a stop-loss could
// be triggered too often and you may miss good trades.
//
// WARNING:
// - For purpose educate only
// - This script to change bars colors.
////////////////////////////////////////////////////////////
Reversal123(Length, KSmoothing, DLength, Level) =>
    vFast = sma(stoch(close, high, low, Length), KSmoothing)
    vSlow = sma(vFast, DLength)
    pos = 0.0
    pos := iff(close[2] < close[1] and close > close[1] and vFast < vSlow and vFast > Level, 1,
	         iff(close[2] > close[1] and close < close[1] and vFast > vSlow and vFast < Level, -1, nz(pos[1], 0)))
	pos

DCW(length, smoothe) =>
    pos = 0.0
    xUpper = highest(high, length)
    xLower = lowest(low, length)
    xDonchianWidth = xUpper - xLower
    xSmoothed = sma(xDonchianWidth, smoothe)
    pos := iff(xDonchianWidth > xSmoothed, -1,
              iff(xDonchianWidth < xSmoothed, 1, nz(pos[1], 0)))
    pos

strategy(title="Combo Backtest 123 Reversal & Donchian Channel Width", shorttitle="Combo", overlay = true)
Length = input(14, minval=1)
KSmoothing = input(1, minval=1)
DLength = input(3, minval=1)
Level = input(50, minval=1)
//-------------------------
LengthDCW = input(20, minval=1)
SmootheSCW = input(22, minval=1)
reverse = input(false, title="Trade reverse")
posReversal123 = Reversal123(Length, KSmoothing, DLength, Level)
posDCW = DCW(LengthDCW, SmootheSCW)
pos = iff(posReversal123 == 1 and posDCW == 1 , 1,
	   iff(posReversal123 == -1 and posDCW == -1, -1, 0))
possig = iff(reverse and pos == 1, -1,
          iff(reverse and pos == -1 , 1, pos))
if (possig == 1)
    strategy.entry("Long", strategy.long)
if (possig == -1)
    strategy.entry("Short", strategy.short)
if (possig == 0)
    strategy.close_all()
barcolor(possig == -1 ? #b50404: possig == 1 ? #079605 : #0536b3 )
- イチモク・キンコ・ヒョウ・クラウド+QQE 定量戦略
- 金のストップ・ロスのモメンタム・トレーディング戦略について
- パラボラオシレーター 高値と低値戦略を探し
- ボリンジャー・バンドのブレイクアウト戦略
- 画期的な公平価値格差戦略
- モメント・ブレイク付きの適応型移動平均クロスオーバーシステム
- トレーディング戦略はピーク・トゥ・ピーク・パターンをベースに
- マルチプル EMA 購入戦略
- OBV EMAのクロスオーバートレンド 戦略をフォローする
- RSIとMAのクロスオーバートレンド追跡戦略
- EMAのクロスオーバーは,長距離量策について
- 極端な逆転追跡戦略
- Bollinger Band Mean Reversal Strategy with Intraday Intensity Index (ボリンジャー・バンド・メアンの逆転戦略と日中の強度指数)
- B-Xtrender 指数関数移動平均クロスオーバー戦略
- 移動平均傾向追跡戦略
- 移動平均値とMACDを組み合わせたRSI戦略
- EMA,RSI,MACDをベースにした多期期間の取引戦略
- ピボットポイントに基づくピボット逆転量的な戦略
- 3色クロストレンド追跡戦略
- ダイナミックなポジション構築戦略