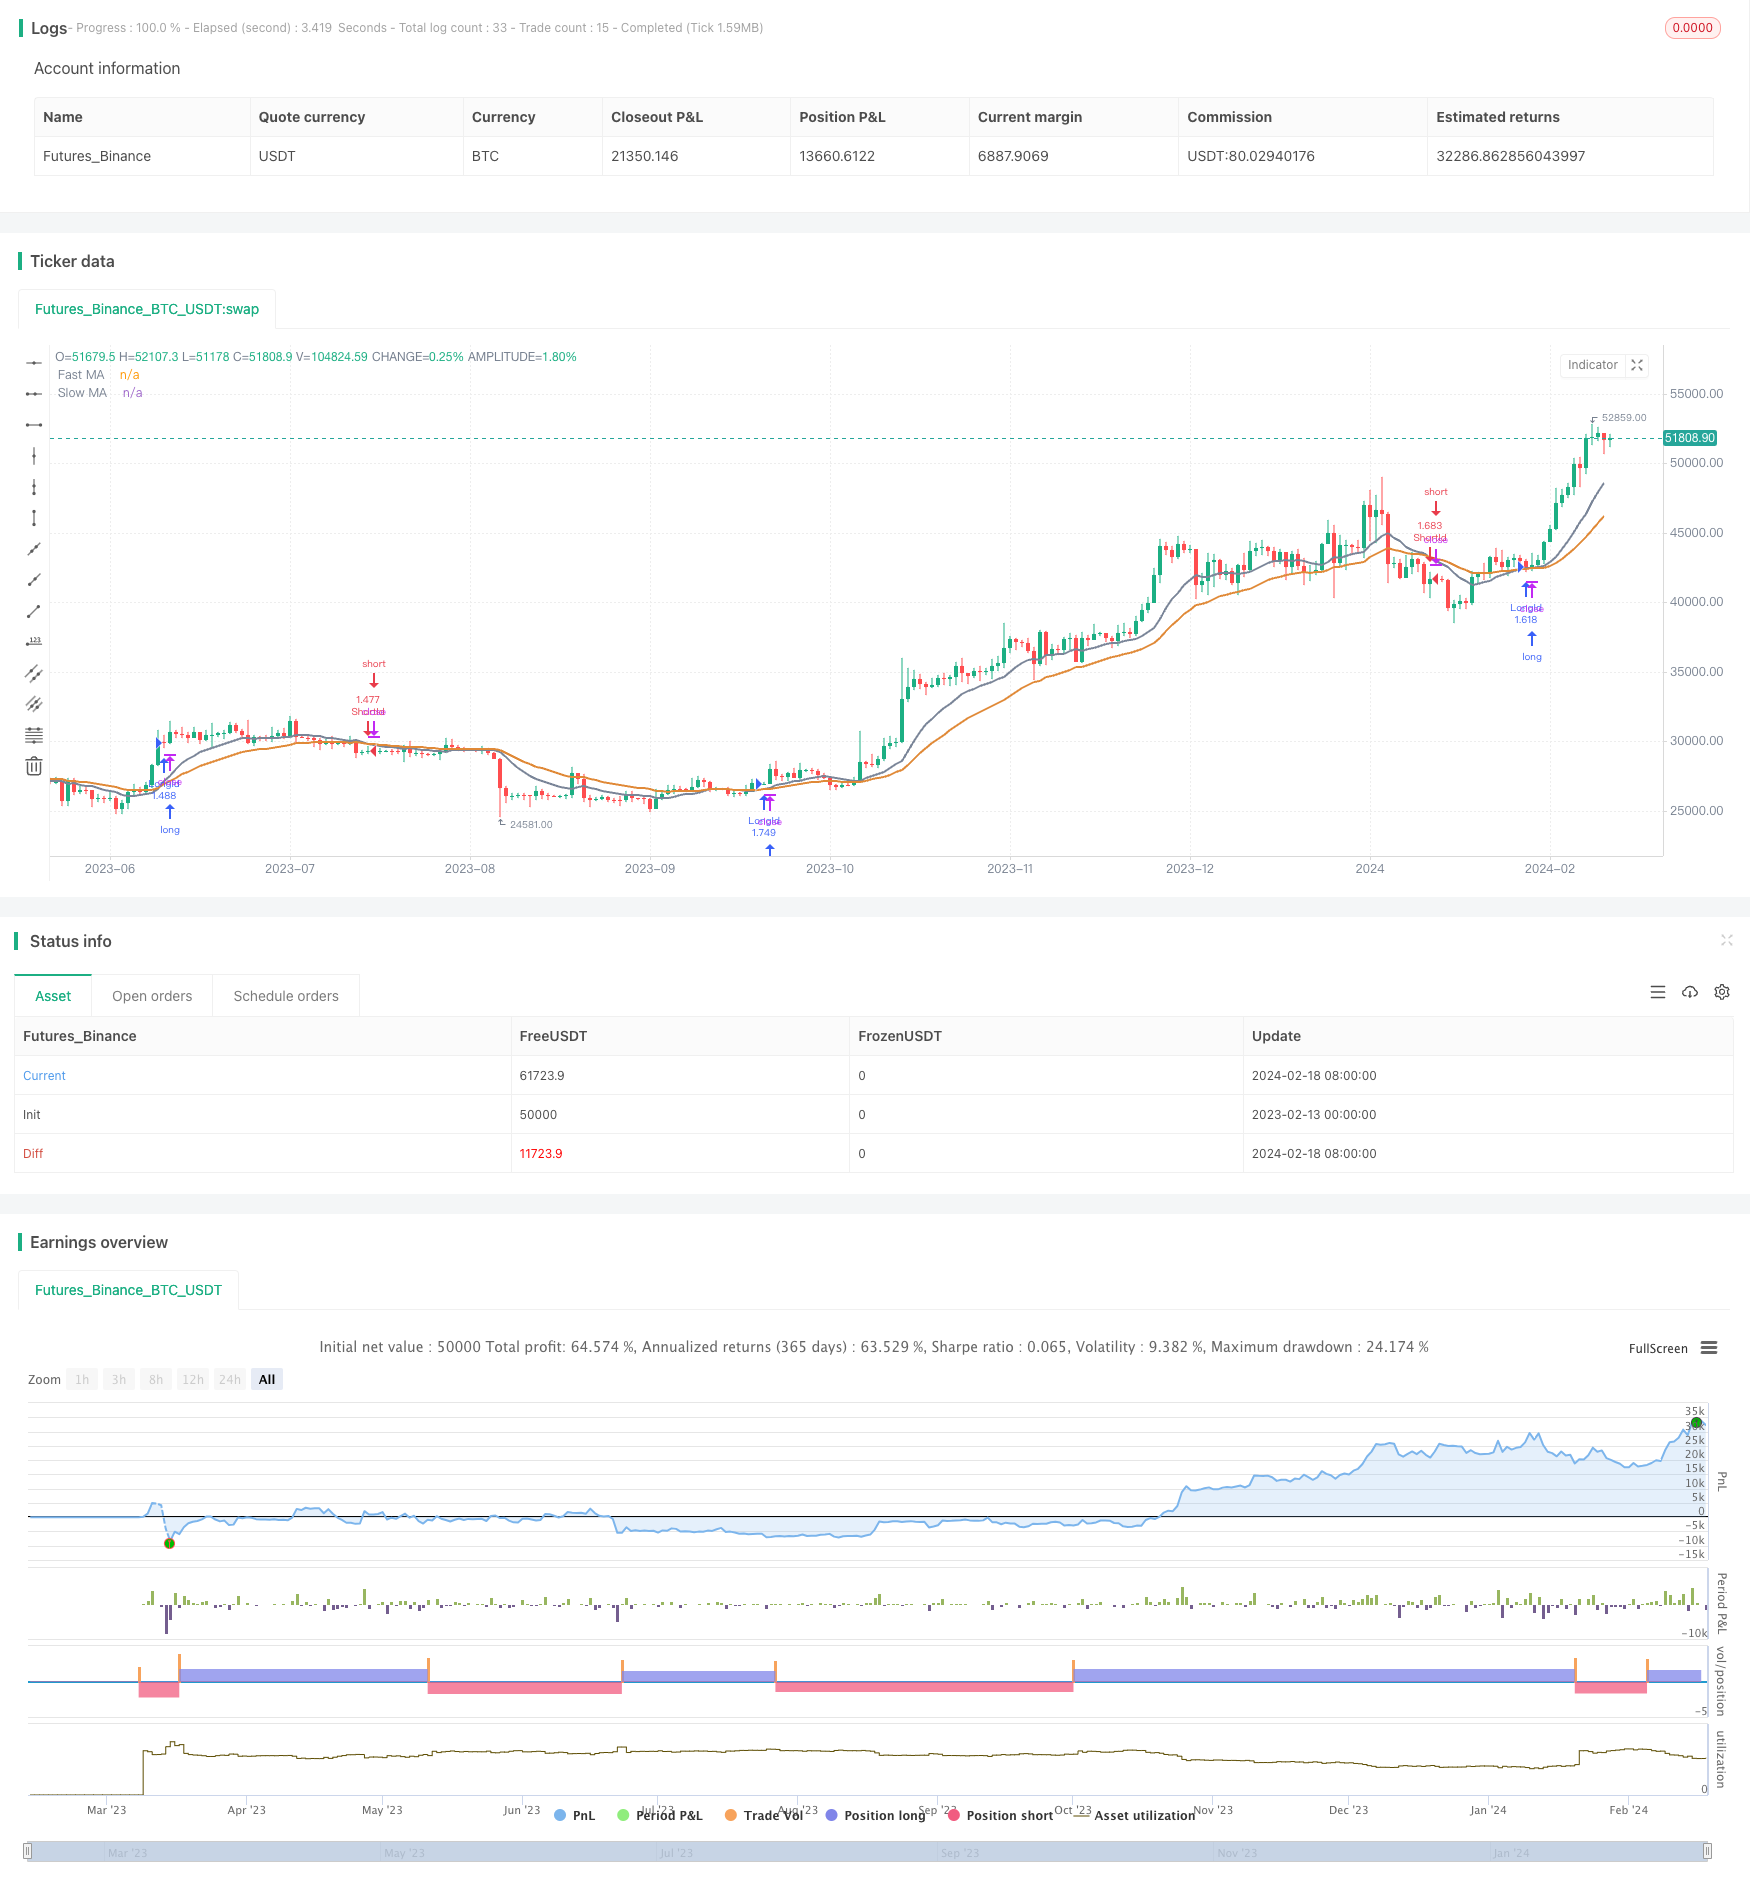
RSIとMAの平均線を交差するトレンド追跡戦略
作者: リン・ハーンチャオチャン開催日:2024年2月20日15時31分15秒タグ:

概要
この戦略は,RSIが2つの異なるサイクルのMA平均線と交差して市場トレンドとエントラ入場時期を判断する.戦略は,RSIが26サイクルの平均線より高く,RSIが26サイクルの平均線より低く,リスクを制御するために空白を行うのみ.
戦略の原理
この戦略は12サイクルと26サイクルの両MA均線を使用する. 12サイクル快線で26サイクルスローラインを横切ると,市場は上向きに進むと考えられる. 快線下を横切ると,市場は下向きに進むと考えられる. 平均線で黄金交差が発生すると多行,死亡交差時に空行する.
同時に,戦略は,RSI指標が超買超売領域を判断するRSIを導入する.RSIが自社の26サイクル平均線より上にある場合にのみ,平均線が金交差時に多額の取引を開く.RSIが自社の26サイクル平均線より下にある場合にのみ,平均線が死交差時に多額の取引を開く.これは,市場が超買または超売されている場合に強要取引を開くのを避けるため,リスクを制御する.
優位性分析
この戦略は,均線とRSI指標の判断と入場タイミングを組み合わせて,トレンドを効果的に追跡することができる. RSI指標をフィルタリング条件として導入することで,開場数を減らすことができ,波動的な市場で套金されない.停止損失を設定せずに,トレンドを十分に追跡してより高い利益を得ることができる.
リスク分析
ストップ損失を設定しないため,誤判すると損失が拡大する可能性がある.また,市場が大幅な空飛躍した場合,大きな損失を引き起こす可能性がある.また,RSIのフィルタリング条件が正しく設定されていない場合,より良いエントリータイミングを逃す可能性があります.
最大損失を制御するために停止損失を設定することを検討することができる. RSIのパラメータを適切に調整し,より良いフィルタリング条件を探すことができる. 市場の波動が大きい場合,平均線のパラメータを適切に調整し,ゆっくりとした平均線を使用して傾向を判断することができます.
優化方向
この戦略は,以下のいくつかの点で最適化することができます:
異なる周期におけるMA均線組み合わせをテストし,現在の市場特性により適合する均線パラメータを探します.
RSIの異なるサイクルパラメータ,異なるフィルタリング条件,エントリータイミングを最適化する.
システム安定性を高めるために他の指標またはフィルタリング条件を追加します.例えば,傾向判断に関連する指標,例えば量力指標,取引量指標などを追加します.
ストップ損失戦略を最適化し,トレンドを追跡しながらリスクを制御する.ストップ損失を追跡,百分比ストップ損失,ダイナミックストップ損失などのストップ損失戦略をテストすることができます.
概要
この戦略は全体的に比較的単純で直接的なもので,均線を交差して傾向を判断することで,RSIは強要開場を避け,傾向を追跡してより良い収益を得ることができる.この戦略は,パラメータの最適化,他の指標の追加などによってさらに改良され,複雑な多変性市場環境に適している.
/*backtest
start: 2023-02-13 00:00:00
end: 2024-02-19 00:00:00
period: 1d
basePeriod: 1h
exchanges: [{"eid":"Futures_Binance","currency":"BTC_USDT"}]
*/

//@version=2

strategy(title = "EMA Cross Strategy", shorttitle = "EMA Cross",calc_on_order_fills=true,calc_on_every_tick =true, initial_capital=21000,commission_value=.25,overlay = true,default_qty_type = strategy.percent_of_equity, default_qty_value = 100)
StartYear = input(2018, "Backtest Start Year")
StartMonth = input(1, "Backtest Start Month")
StartDay = input(1, "Backtest Start Day")
UseStopLoss = input(false,"UseStopLoss")
//rsiLong = true
rsi1 = rsi(close, 14)

window() => true

stopLoss = input(20, title = "Stop loss percentage(0.1%)")
//stopLoss = input(200, title = "Stop loss percentage(0.1%)")

maFastSource   = input(defval = open, title = "Fast MA Source")
maFastLength   = input(defval = 12, title = "Fast MA Period", minval = 1)
// long ma
maSlowSource   = input(defval = open, title = "Slow MA Source")
maSlowLength   = input(defval = 26, title = "Slow MA Period", minval = 1)

maFast = ema(maFastSource, maFastLength)
maSlow = ema(maSlowSource, maSlowLength)

//12 and 26=9%; 3 and8=2%; 26 and 55=2%; when selling on a cross under
//maFastRSI = ema(rsi1, 12)
//maSlowRSI = ema(rsi1, 26)

fast = plot(maFast, title = "Fast MA", color = #7a8598, linewidth = 2, style = line, transp = 50)
slow = plot(maSlow, title = "Slow MA", color = #e08937, linewidth = 2, style = line, transp = 50)


longEMA = crossover(maFast, maSlow)
exitLong = crossunder(maFast, maSlow) // 5% in 2018
//exitLong = crossunder(close, maFast) // 15% in 2018
//exitLong = crossunder(rsi1, maFastRSI) // 13%

shortEMA = crossover(maSlow, maFast)
exitShort = crossover(maFast, maSlow)

//if (rsi1 < ema(rsi1,7))
//rsiLong = false

//if (longEMA and (rsi1 >= highest(rsi1,10)))
//if (longEMA)
if (longEMA and (rsi1 > ema(rsi1,26)))  //RSI ema values optimal from 19 to 35
    strategy.entry("LongId", strategy.long, when=window())

//strategy.close_all(when = rsi1 > 60) // 80=26%, 90=n/a, 70=15%, 60=16% long only
//strategy.close_all(when = (shortEMA and (rsi1 <= ema(rsi1,26)))) //10% gain in 2018 long only
//strategy.close_all(when = (rsi1 <= ema(rsi1,120))) //26=17% 14=2% 42=15%
//strategy.close_all(when = (shortEMA)) // 5% gain in 2018 long only
//strategy.close_all(when = exitLong)

//if (shortEMA and not(rsiLong))
//if (shortEMA)
if (shortEMA and (rsi1 <= ema(rsi1,26)))
    strategy.entry("ShortId", strategy.short, when=window())

if (UseStopLoss)
    strategy.exit("StopLoss", "LongId", loss = close * stopLoss / 1000 / syminfo.mintick)
    strategy.exit("StopLoss", "ShortId", loss = close * stopLoss / 1000 / syminfo.mintick)
- ボルフォはソナー戦略を繰り返す
- 一見バランス+シフト・オーバープレス量化戦略
- 動力と標準差に基づく金取引戦略
- パラポーラオイジレーターは高低戦略を探している
- ブリン・ベルト指数に基づいた簡単な量化取引戦略
- 画期的な格差の公平策
- ダイナミック・ブレークスルー 自律的な均線交差システム
- 頂点形状に基づく取引戦略
- 多EMAによる購入戦略
- OBV指標に基づくトレンド追跡戦略
- 双反転率戦略に基づいた
- 均線を横切る長線と量化戦略
- 極値反転追跡戦略
- ブリン帯と日内強度指数の均値回帰戦略
- 指数均線交差B-Xtrender戦略
- 移動平均のトレンド追跡戦略
- 移動平均線とMACDを組み合わせたRSI指標の取引戦略
- EMA,RSI,MACDをベースにした多時間枠取引戦略
- 中枢軸点逆転に基づく量化戦略
- 3色クロストレンド追跡戦略