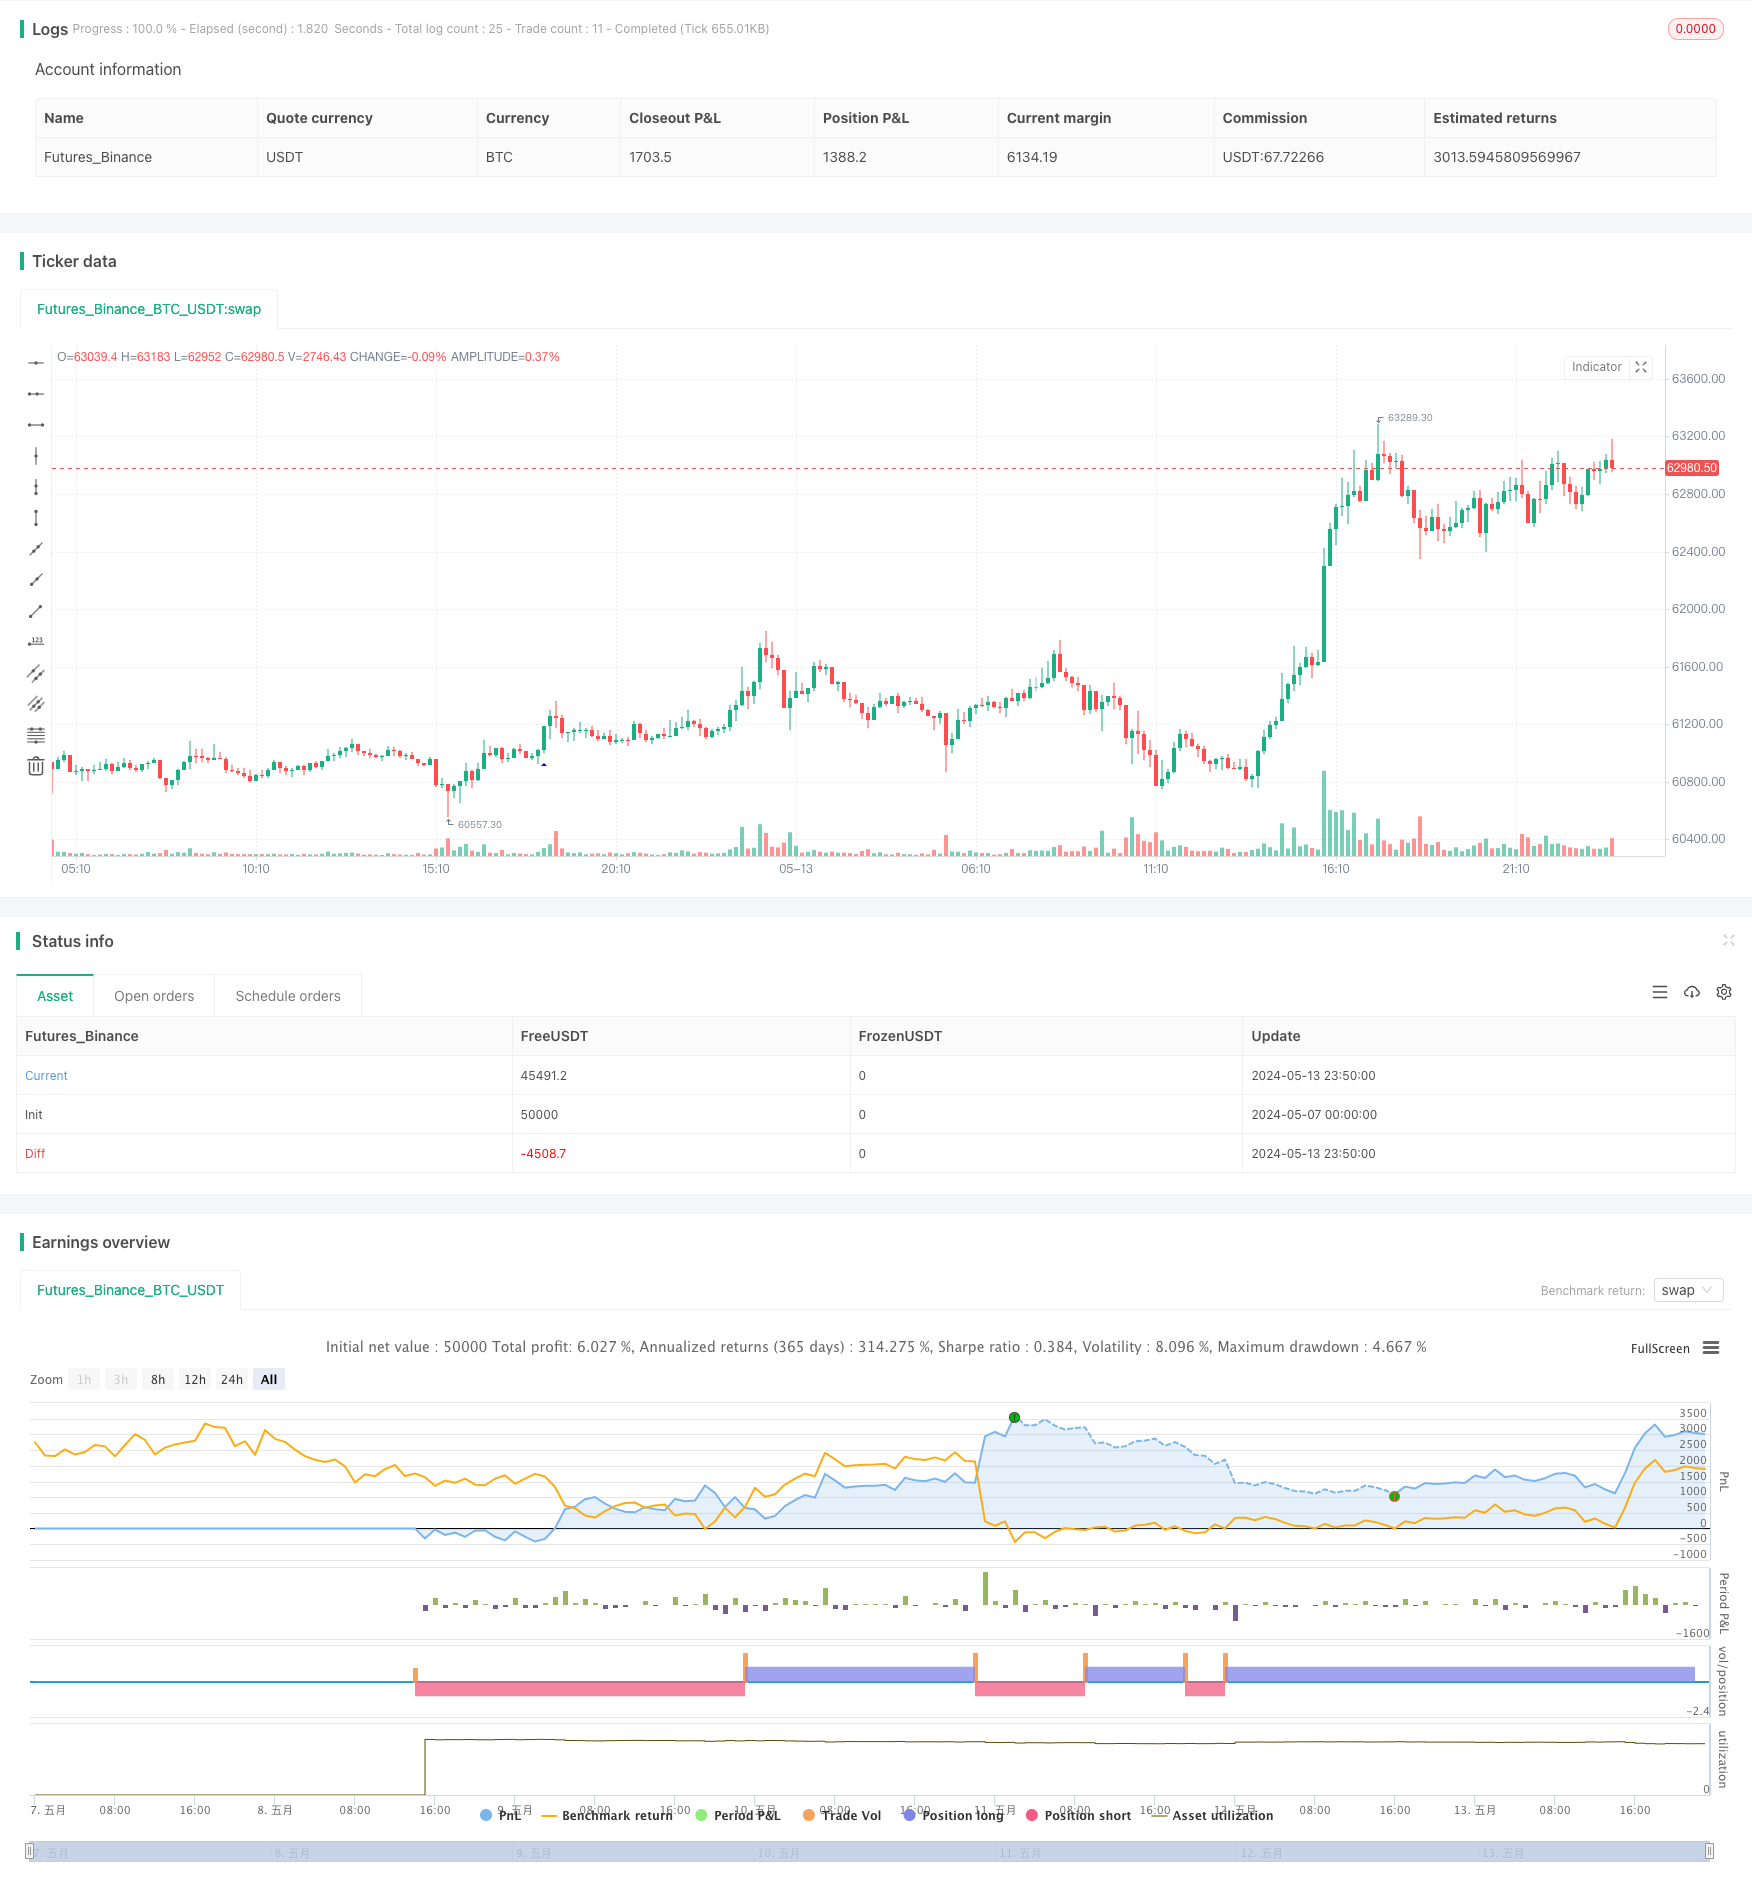
SR 脱退戦略
作者: リン・ハーンチャオチャン開催日:2024年5月15日 16時30分タグ:

概要
SRブレークアウト戦略は,LonesomeTheBlue
戦略原則
- 特定の期間における高値と低値を計算し,配列に格納します.
- 現在の閉じる価格がレジスタンスレベルより高いかどうかを判断します.そうであれば,それは上昇ブレイクとして判断され,ロング信号が生成されます.
- 現在の閉じる価格がサポートレベルを下回っているかどうかを判断します.そうであれば,それは下落突破として判断され,ショート信号が生成されます.
- トレーディング・シグナルを生成した後に,設定されたストップ・ロスト・アンド・テイク・プロフィート比率に基づいてストップ・ロスト・アンド・テイク・プロフィート価格を計算し,対応するストップ・ロスト・アンド・テイク・プロフィート・オーダーを設定します.
- 突破方向に従って対応する突破範囲を描く.
戦略 の 利点
- サポートとレジスタンスのブレイクは,ある程度の実用的な基盤を持つ典型的な取引戦略です.
- サポートとレジスタンスレベルを計算するためにピボットハイとピボットロー関数を用いることで,ブレイクチャンスが比較的正確に捉えられます.
- この戦略のコード構造は明確で,高値と低値を配列に保存することで,バックテストと最適化に便利です.
- ストップ・ロストとテイク・プロフィットが設定され,リスクは比較的うまくコントロールできます.
戦略リスク
- サポートとレジスタンスのブレイクストラテジーは,不安定な市場では不具合で,頻繁に誤ったブレイクになる傾向があります.
- 固定ストップ・ロースとテイク・プロフィート比は,異なる市場状況に適応できない可能性があり,その結果リスクと収益の不均衡が生じる.
- この戦略は価格要因のみを考慮し,取引量などの他の重要な指標を考慮しない.これは重要な信号を見逃す可能性があります.
戦略の最適化方向
- 信号の正確性と信頼性を向上させるために,取引量,MACDなどより多くの技術指標を導入することを検討します.
- ストップ・ロスの場合,トレーリング・ストップまたはダイナミック・ストップ・ロスの場合,異なる市場状況に適したストップ・ロスの割合を考慮してください.
- トレンドフィルタリング,波動性フィルタリングなどフィルタリング条件を導入することを検討し,不安定な市場における偽ブレイクを減らす.
- サポートとレジスタンスのレベルを最適化することを検討します.例えば適応期間の使用,フィボナッチレベルの導入などです.
概要
SRブレイクアウト戦略は,サポートとレジスタンスブレイクアウトという古典的な考えに基づいた取引戦略である.ピボットハイとピボットロー関数を用いてサポートとレジスタンスレベルを計算し,閉じる価格がこれらのレベルを突破して取引信号を生成するかどうかを判断することによって.この戦略の利点は,アイデアが明確で,実装し最適化するのが簡単である.同時に,不安定な市場でパフォーマンスが悪いことや,固定ストップ損失と利益率によって引き起こされるリスクなどのリスクもあります.将来,この戦略の技術指標,ストップ損失と利益,フィルタリング条件,サポートと抵抗最適化などの側面から最適化および改善することを検討し,安定性と収益性を向上させることができます.
/*backtest
start: 2024-05-07 00:00:00
end: 2024-05-14 00:00:00
period: 10m
basePeriod: 1m
exchanges: [{"eid":"Futures_Binance","currency":"BTC_USDT"}]
*/

// This source code is subject to the terms of the Mozilla Public License 2.0 at https://mozilla.org/MPL/2.0/
// © LonesomeTheBlue © chanu_lev10k

//@version=5
strategy('SR Breakout Strategy', overlay=true, max_bars_back=500, max_lines_count=400)
prd = input.int(defval=5, title='Period', minval=2)
bo_len = input.int(defval=71, title='Max Breakout Length', minval=30, maxval=300)
cwidthu = input.float(defval=3., title='Threshold Rate %', minval=1., maxval=10) / 100
mintest = input.int(defval=2, title='Minimum Number of Tests', minval=1)
bocolorup = input.color(defval=color.blue, title='Breakout Colors', inline='bocol')
bocolordown = input.color(defval=color.red, title='', inline='bocol')
// lstyle = input.string(defval=line.style_solid, title='Line Style')
issl = input.bool(title='SL', inline='linesl1', group='Stop Loss / Take Profit:', defval=false)
slpercent = input.float(title=', %', inline='linesl1', group='Stop Loss / Take Profit:', defval=18.0, minval=0.0, step=0.1)
istp = input.bool(title='TP', inline='linetp1', group='Stop Loss / Take Profit:', defval=false)
tppercent = input.float(title=', %', inline='linetp1', group='Stop Loss / Take Profit:', defval=18.0, minval=0.0, step=0.1)

//width
lll = math.max(math.min(bar_index, 300), 1)
float h_ = ta.highest(lll)
float l_ = ta.lowest(lll)
float chwidth = (h_ - l_) * cwidthu

// check if PH/PL
ph = ta.pivothigh(prd, prd)
pl = ta.pivotlow(prd, prd)

//keep Pivot Points and their locations in the arrays
var phval = array.new_float(0)
var phloc = array.new_int(0)
var plval = array.new_float(0)
var plloc = array.new_int(0)

// keep PH/PL levels and locations
if bool(ph)
    array.unshift(phval, ph)
    array.unshift(phloc, bar_index - prd)
    if array.size(phval) > 1  // cleanup old ones
        for x = array.size(phloc) - 1 to 1 by 1
            if bar_index - array.get(phloc, x) > bo_len
                array.pop(phloc)
                array.pop(phval)

if bool(pl)
    array.unshift(plval, pl)
    array.unshift(plloc, bar_index - prd)
    if array.size(plval) > 1  // cleanup old ones
        for x = array.size(plloc) - 1 to 1 by 1
            if bar_index - array.get(plloc, x) > bo_len
                array.pop(plloc)
                array.pop(plval)

// check bullish cup
float bomax = na
int bostart = bar_index
num = 0
hgst = ta.highest(prd)[1]
if array.size(phval) >= mintest and close > open and close > hgst
    bomax := array.get(phval, 0)
    xx = 0
    for x = 0 to array.size(phval) - 1 by 1
        if array.get(phval, x) >= close
            break
        xx := x
        bomax := math.max(bomax, array.get(phval, x))
        bomax
    if xx >= mintest and open <= bomax
        for x = 0 to xx by 1
            if array.get(phval, x) <= bomax and array.get(phval, x) >= bomax - chwidth
                num += 1
                bostart := array.get(phloc, x)
                bostart
        if num < mintest or hgst >= bomax
            bomax := na
            bomax

// if not na(bomax) and num >= mintest
//     line.new(x1=bar_index, y1=bomax, x2=bostart, y2=bomax, color=bocolorup)
//     line.new(x1=bar_index, y1=bomax - chwidth, x2=bostart, y2=bomax - chwidth, color=bocolorup)
//     line.new(x1=bostart, y1=bomax - chwidth, x2=bostart, y2=bomax, color=bocolorup)
//     line.new(x1=bar_index, y1=bomax - chwidth, x2=bar_index, y2=bomax, color=bocolorup)

plotshape(not na(bomax) and num >= mintest, location=location.belowbar, style=shape.triangleup, color=bocolorup, size=size.small)
//alertcondition(not na(bomax) and num >= mintest, title='Breakout', message='Breakout')

// check bearish cup
float bomin = na
bostart := bar_index
num1 = 0
lwst = ta.lowest(prd)[1]
if array.size(plval) >= mintest and close < open and close < lwst
    bomin := array.get(plval, 0)
    xx = 0
    for x = 0 to array.size(plval) - 1 by 1
        if array.get(plval, x) <= close
            break
        xx := x
        bomin := math.min(bomin, array.get(plval, x))
        bomin
    if xx >= mintest and open >= bomin
        for x = 0 to xx by 1
            if array.get(plval, x) >= bomin and array.get(plval, x) <= bomin + chwidth
                num1 += 1
                bostart := array.get(plloc, x)
                bostart
        if num1 < mintest or lwst <= bomin
            bomin := na
            bomin

// if not na(bomin) and num1 >= mintest
//     line.new(x1=bar_index, y1=bomin, x2=bostart, y2=bomin, color=bocolordown)
//     line.new(x1=bar_index, y1=bomin + chwidth, x2=bostart, y2=bomin + chwidth, color=bocolordown)
//     line.new(x1=bostart, y1=bomin + chwidth, x2=bostart, y2=bomin, color=bocolordown)
//     line.new(x1=bar_index, y1=bomin + chwidth, x2=bar_index, y2=bomin, color=bocolordown)

plotshape(not na(bomin) and num1 >= mintest, location=location.abovebar, style=shape.triangledown, color=bocolordown, size=size.small)

//alertcondition(not na(bomin) and num1 >= mintest, title='Breakdown', message='Breakdown')
//alertcondition(not na(bomax) and num >= mintest or not na(bomin) and num1 >= mintest, title='Breakout or Breakdown', message='Breakout or Breakdown')

// Long Short conditions
longCondition = not na(bomax) and num >= mintest
if longCondition
    strategy.entry('Long', strategy.long)
shortCondition = not na(bomin) and num1 >= mintest
if shortCondition
    strategy.entry('Short', strategy.short)

// Entry price / Take Profit / Stop Loss
//entryprice = strategy.position_avg_price
entryprice = ta.valuewhen(condition=longCondition or shortCondition, source=close, occurrence=0)
pm = longCondition ? 1 : shortCondition ? -1 : 1 / math.sign(strategy.position_size)
takeprofit = entryprice * (1 + pm * tppercent * 0.01)
stoploss = entryprice * (1 - pm * slpercent * 0.01)
strategy.exit(id='Exit Long', from_entry='Long', stop=issl ? stoploss : na, limit=istp ? takeprofit : na, alert_message='Exit Long')
strategy.exit(id='Exit Short', from_entry='Short', stop=issl ? stoploss : na, limit=istp ? takeprofit : na, alert_message='Exit Short')
もっと
- RSI と MACD の組み合わせた長期短期戦略
- イチモク雲と移動平均戦略
- ウィリアム・アリガター 移動平均トレンドキャッチャー戦略
- ダイナミックMACDとイチモク・クラウド・トレーディング・戦略
- ADXフィルターによるMA拒絶戦略
- ボリンジャー・バンド戦略: 最大利益のための精密取引
- ATR平均脱出戦略
- KNN機械学習戦略:K-近隣アルゴリズムに基づくトレンド予測取引システム
- CCI+RSI+KC トレンドフィルター 二方向取引戦略
- BMSBの脱出戦略
- ボリンジャー・バンド ダイナミック・ブレークアウト戦略
- 8時間エマ
- RSI 量的な取引戦略
- Bollinger Band ATR トレンド 戦略をフォローする
- デルタ・ボリュームとフィボナッチレベル 取引戦略
- 2つのRSI差分戦略
- クリプト・ビッグ・ムーブ ストカスティック・RSI戦略
- 3倍相対強度指数 定量的な取引戦略
- トレンドフォローとモメント・トレードを組み合わせたダブルMACD最適化戦略
- 連続して3つの下落のキャンドルと2つの移動平均値に基づいた取引戦略