모보 밴드
저자:차오장, 날짜: 2022-05-13 14:27:58태그:SMA
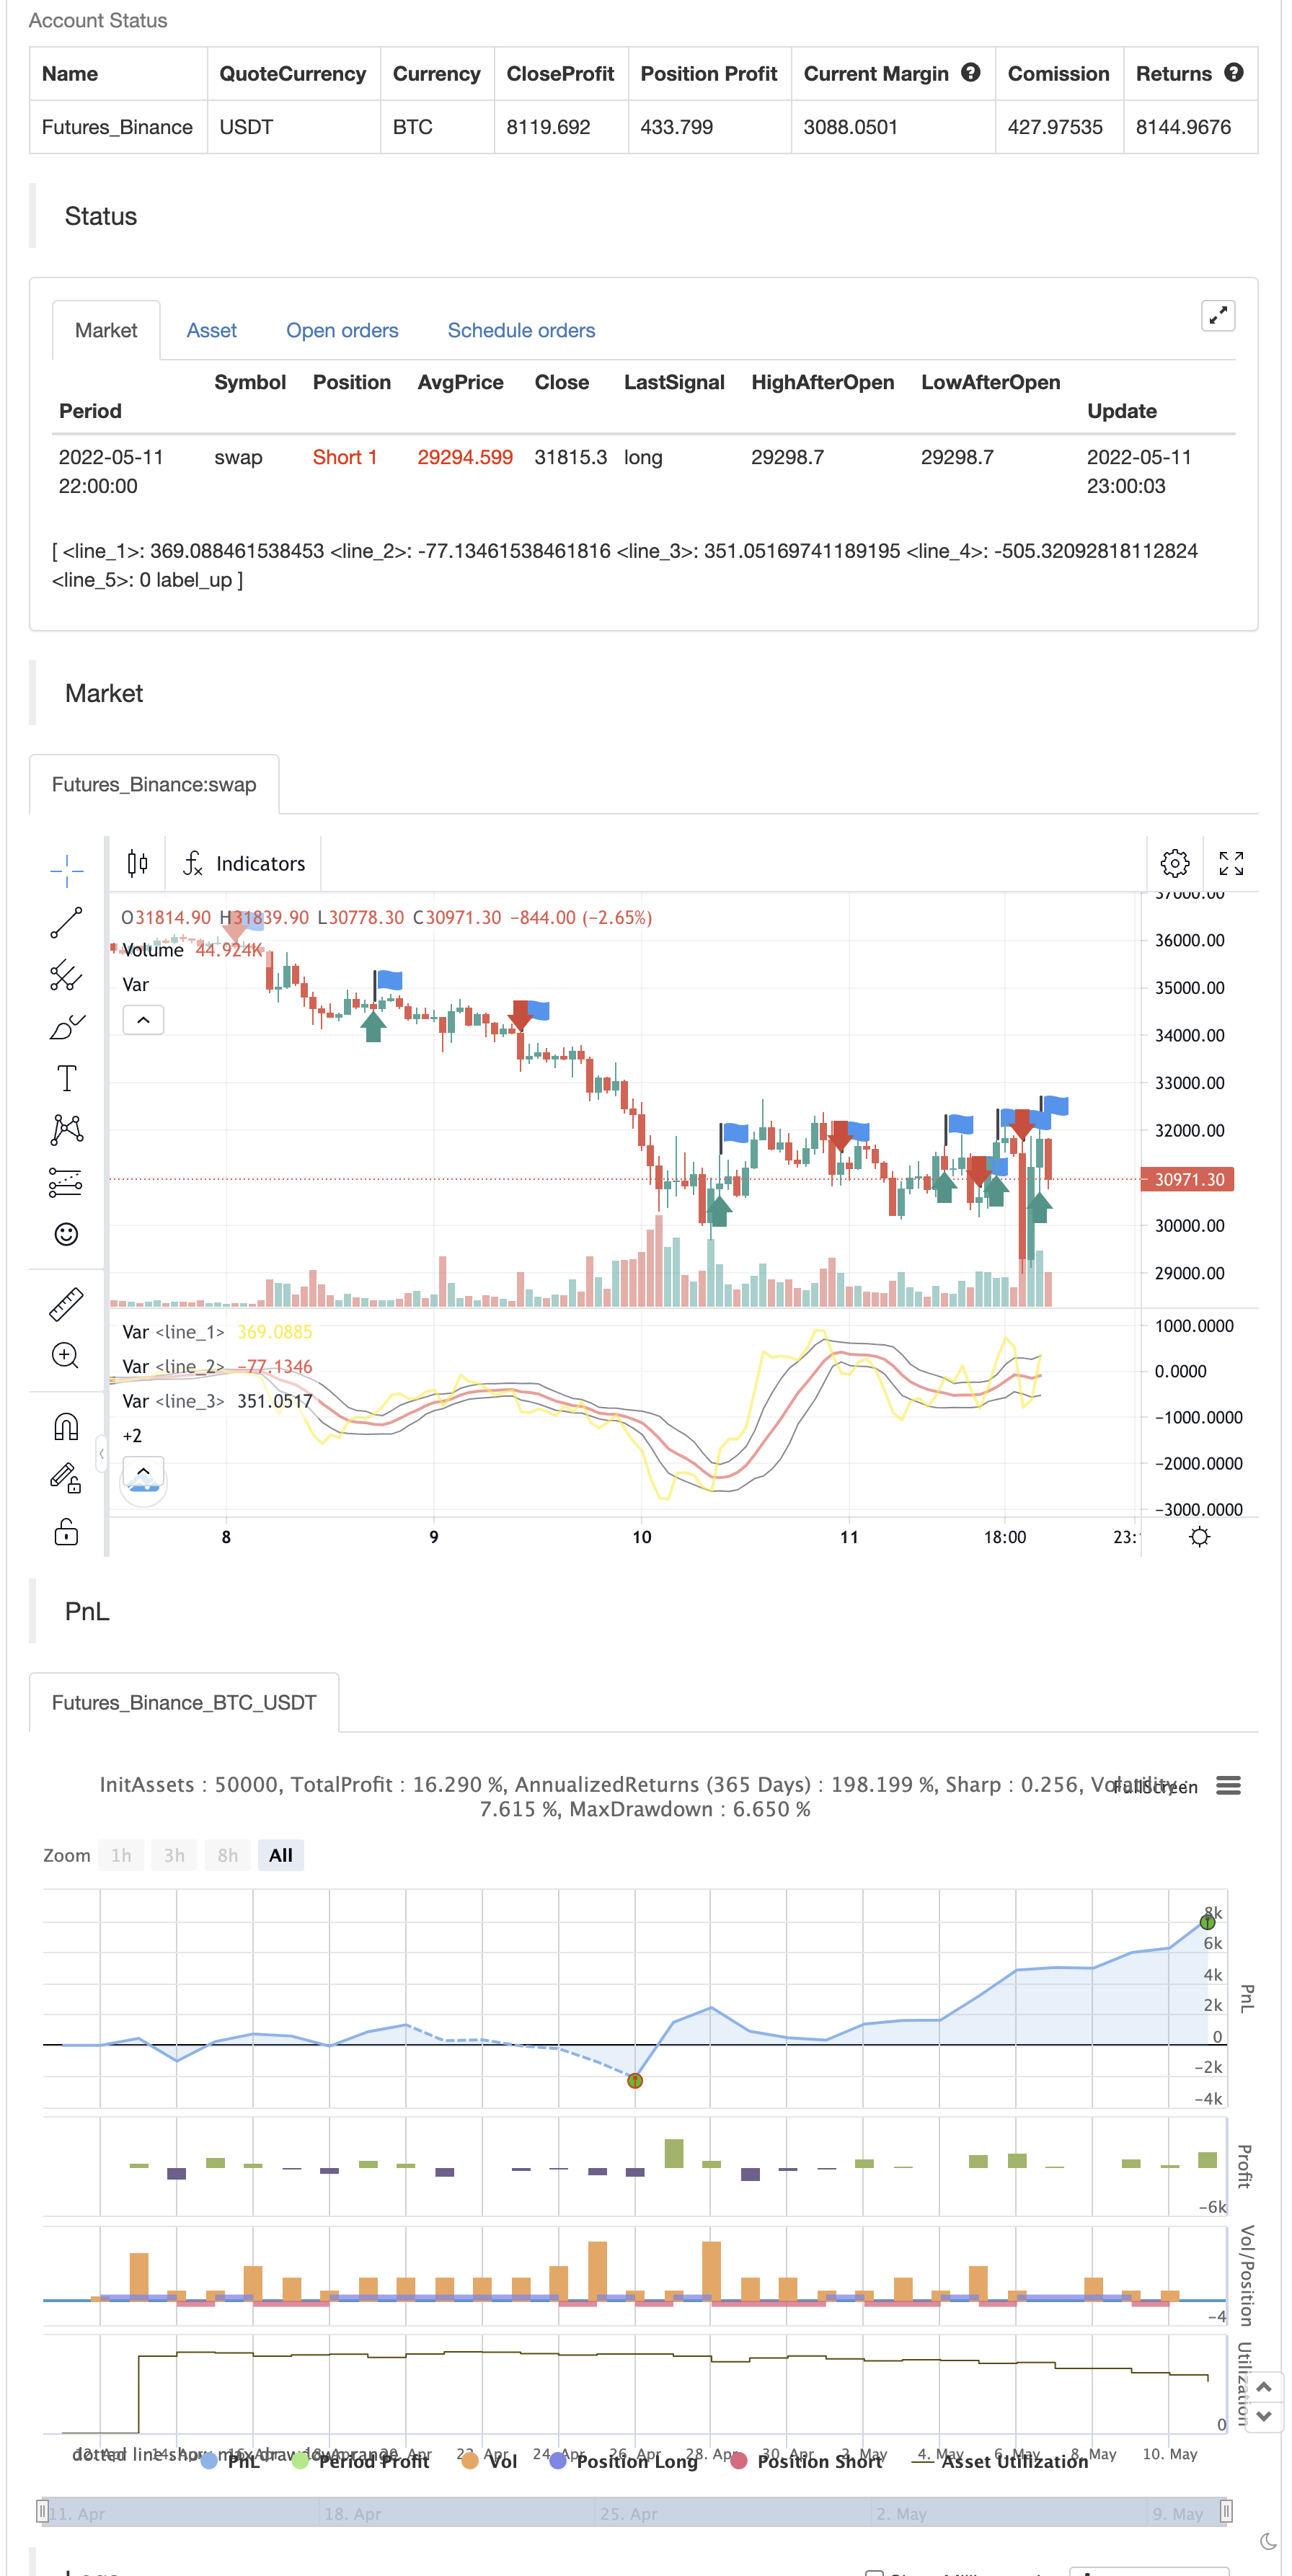
이 지표는 모보 밴드 (Momentum Breakout Bands) 이다. 이 밴드는 조정된 표준 편차를 가진 볼링거 밴드이다. 상승으로 이동하기 위해 밴드 위에 추진력 파열이있을 때 구매 신호가 있고 하향으로 이동하기 위해 밴드 아래에 추진력 파열이있을 때 판매 신호가 있습니다. 밴드는 단순히 모든 시장이 우리가 모두 알 수 있는 시기를 가지고 있음을 제안합니다. 가격이 밴드 안에있을 때 트렌드없는 것으로 알려집니다. 브레이크가 발생하면 브레이크 방향으로 거래를 할 수 있습니다. 나는 이것을 시간적 시간 프레임에서 트레이드 옵션을 스윙하는 데 사용하는 것을 좋아합니다. 그러나 밴드는 대부분의 도구와 시간 프레임에서 작동해야합니다. 나는 엔트리를 위해 1 시간 SPY 차트에서 스윙하는 것을 사용하고 트렌드 확인을 위해 매일 차트를 사용하는 것을 좋아합니다.
백테스트

/*backtest
start: 2022-04-12 00:00:00
end: 2022-05-11 23:59:00
period: 1h
basePeriod: 15m
exchanges: [{"eid":"Futures_Binance","currency":"BTC_USDT"}]
*/

//@version=4
study("Mobo Bands", overlay=false)

price           = input(hl2, "Price")
colorNormLength = input(3, "colorNormLength", input.integer)
dpoLength       = input(13, "dpoLength", input.integer)
moboDisplace    = input(0, "moboDisplace", input.integer)
moboLength    = input(10, "moboLength", input.integer)

numDevDn  = input(-0.8, "numDevDn", input.float)
numDevUp  = input(0.8, "numDevUp", input.float)

coloredMobo     = input(true, "coloredMobo")
coloredFill     = input(true, "coloredFill")
breakArrows     = input(true, "breakArrows")
moboShowMid     = input(true, "moboShowMid")


//def DPO = price - Average(price[DPO_length / 2 + 1], DPO_length);
xsma = sma(price[int(dpoLength / 2 + 1)], dpoLength)
//alert(int(dpoLength / 2 + 1))
//xsma = sma(price, dpoLength)
DPO = price - xsma


Midline = sma(DPO, moboLength)

sDev = stdev(DPO, moboLength)

LowerBand = Midline + numDevDn * sDev
UpperBand = Midline + numDevUp * sDev

plot(DPO, color=color.yellow,linewidth=2)

plot(Midline, color=Midline > Midline[1] ? color.lime : color.red,linewidth=2)

Upper = plot(UpperBand, color=color.black,linewidth=1)
Lower = plot(LowerBand, color=color.black,linewidth=1)

plot(0, color=color.white,linewidth=1)

Signal1 = DPO > UpperBand and DPO[1] < UpperBand[1]
Signal2 = DPO < LowerBand and DPO[1] > LowerBand[1]

wasUp = 1
wasDn = 1

wasUp := Signal1 ? 1 : (Signal2 ? 0 : nz(wasUp[1]))
wasDn := Signal2 ? 1 : (Signal1 ? 0 : nz(wasDn[1]))

//plotshape(Signal1 and wasDn[1] ? UpperBand : na, style=shape.arrowup, location=location.absolute, size=size.normal, color=color.red)
//plotshape(Signal2 and wasUp[1] ? LowerBand : na, style=shape.arrowdown, location=location.absolute, size=size.normal, color=color.green)

plotshape(Signal1 and wasDn[1] ? UpperBand : na, style=shape.labelup, location=location.absolute, size=size.normal, color=color.green, text="Buy",textcolor=color.white)
plotshape(Signal2 and wasUp[1] ? LowerBand : na, style=shape.labeldown, location=location.absolute, size=size.normal, color=color.red, text="Sell",textcolor=color.white)


//fill(Upper, Lower, color=color.purple)

alertcondition(Signal1 and wasDn[1], "Break Out Arrow", "Break Out Arrow")
alertcondition(Signal2 and wasUp[1], "Break Down Arrow", "Break Down Arrow")


if Signal1 and wasDn[1]
    strategy.entry("Enter Long", strategy.long)
else if Signal2 and wasUp[1]
    strategy.entry("Enter Short", strategy.short)
관련 내용
- 다차원적인 트렌드 판단과 ATR 동적 스톱 및 손실 전략
- 브린 벨트 트렌드에 적응하는 거래 전략
- 고도의 다지표 트렌드 확인 거래 전략
- 쌍평선-RSI 다중 신호 트렌드 거래 전략
- 적응 추세 추적 및 다중 확인 거래 전략
- 동적 조정 스톱 손실 코끼리 기둥 모양 트렌드 추적 전략
- 다일리얼 크로스 보조 RSI 동적 매개 변수 정량화 거래 전략
- 다차원 K 근접 알고리즘과
타이 형태의 양적 가격 분석 거래 전략 - 이동평균 및 일일 모형에 기반한 스마트 추적 중지 손실 전략
- 적응형 다전략 동적 스위치 시스템: 융합 트렌드 추적과 구간 격변에 대한 양적 거래 전략
- 다 지표 다 차원 트렌드 크로스 고급 정량화 전략
더 많은 내용
- 유령 트렌드 추적 전략 비즈니스 데이터베이스
- 유령 트렌드 추적 전략
- 레인보우 오시레이터
- 주식 곡선 위치 사이징 거래 예제
- KLineChart 데모
- 빌라 다이내믹 피보트 슈퍼트렌드 전략
- 크롤의 슈퍼트렌드
- zdmre의 RSI
- FTL - 범위 필터 X2 + EMA + UO
- 브라마스트라
- SAR + 3SMMA와 SL & TP
- SSS
- 달 발사 경고 템플릿 [지표]
- HALFTREND + HEMA + SMA (거짓 신호의 전략)
- RSI: 피보트, BB, SMA, EMA, SMMA, WMA, VWMA와의 분차
- RSI와 BB와 동시에 과판
- 롤링 하이킨 아시 촛불
- 콤보 2/20 EMA & 밴드 패스 필터
- ESSMA
- 3EMA