SWING 트레이드 신호
저자:차오장, 2022-05-26 17:28:12태그:RSISMAEMA
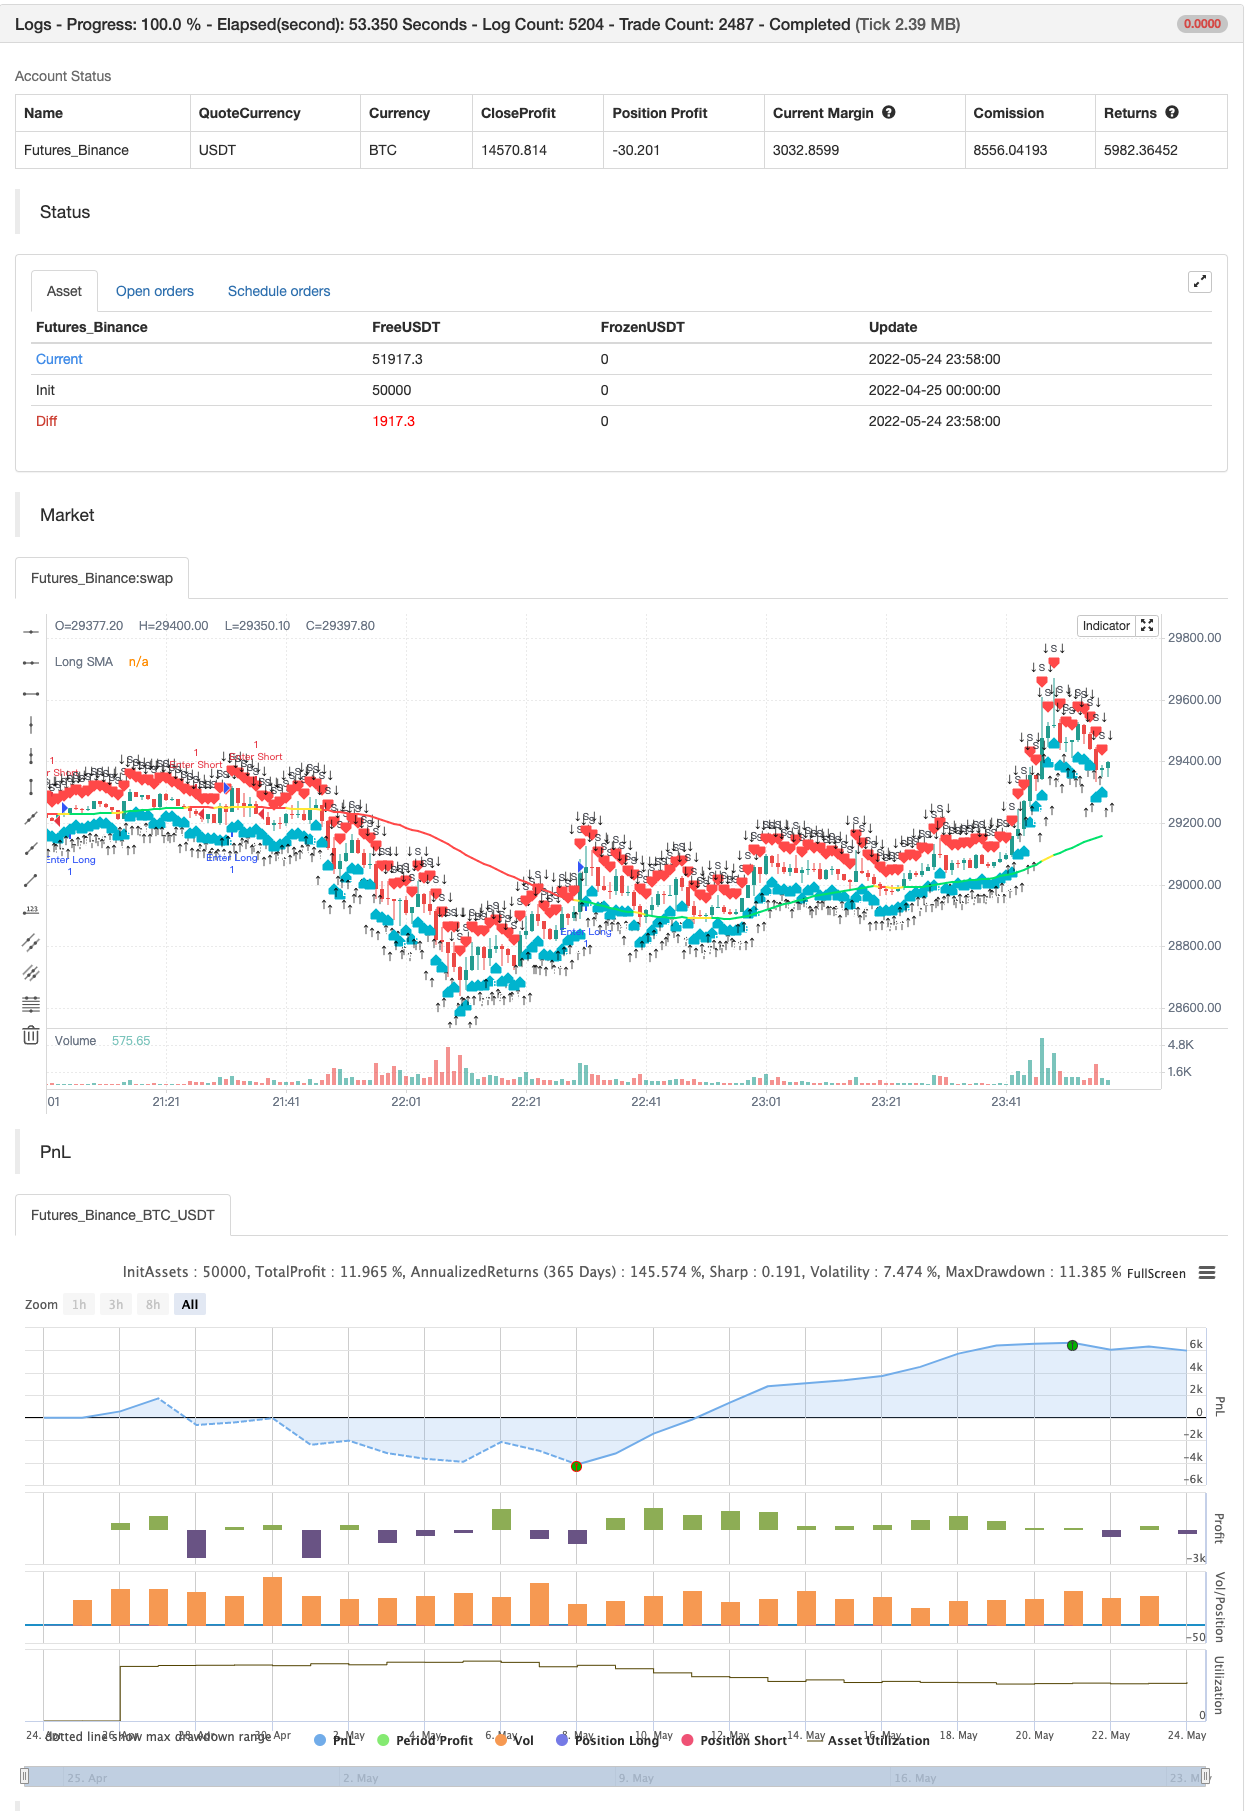
BUY & SELL EMA & Sma를 기반으로 더 높은 시간 프레임에 대한 신호, 가능한 반전을 나타내는 RSI 과잉 구매/ 과잉 판매 점.
그것은 기존 거래에서 이익을 기록하는 데 사용될 수 있으며 새로운 촛불이 측면에 따라 경고 촛불의 높은 / 낮은 부분을 깨면 새로운 위치를 차지 할 수 있습니다.
1시간 이상의 시간 프레임으로 가장 잘 작동합니다.
백테스트

/*backtest
start: 2022-04-25 00:00:00
end: 2022-05-24 23:59:00
period: 1m
basePeriod: 1m
exchanges: [{"eid":"Futures_Binance","currency":"BTC_USDT"}]
*/

// This source code is subject to the terms of the Mozilla Public License 2.0 at https://mozilla.org/MPL/2.0/
// © nicks1008
//@version=4
study("SWING CALLS",title="SMA call buy/sale",shorttitle = "SWING CALL",precision=1, overlay=true)
ema_value=input(5)
sma_value=input(50)
ema1=ema(close,ema_value)
sma2= sma(close,sma_value)
rs=rsi(close,14)

mycolor= iff(rs>=85 or rs<=15,color.yellow,iff(low> sma2,color.lime,iff(high<sma2,color.red,color.yellow)))

hl=input(80,title="Overbought limit of RSI",step=1)
ll=input(20,title="Oversold limit of RSI",step=1)


buyexit= crossunder(rs,hl)
sellexit=crossover(rs,ll)


plot(sma2,title="Long SMA",color=mycolor,linewidth=2,transp=40)

plotshape(buyexit,title="RSI alert Bearish", style=shape.triangledown,
                 location=location.abovebar, color=color.teal, text="↓\n ↓")
plotshape(sellexit,title="RSI alert Bullish", style=shape.triangleup,
                 location=location.belowbar, color=color.teal, text="↑ \n ↑")

sellcall= crossover(sma2,ema1)and open>close
buycall=crossunder (sma2,ema1)and high>sma2

plotshape(buycall,title="BuyShape", style=shape.labelup,
                   location=location.belowbar, color=color.aqua, text="B",textcolor=color.white)
plotshape(sellcall,title="SellShape", style=shape.labeldown,
                   location=location.abovebar, color=color.red,transp=20, text="S",textcolor=color.black)

alertcondition(buyexit or sellexit,title="Reversal", message="Possible Reversal on Swing Signal Alert")
alertcondition(buycall or sellcall,title="Buy/Sale Swing Signal", message="Swing Signal Entry Alert")


if buycall
    strategy.entry("Enter Long", strategy.long)
else if sellcall
    strategy.entry("Enter Short", strategy.short)
관련
- QQE MOD + SSL 하이브리드 + 와다 아타르 폭발
- RSI 쌍방향 거래 전략
- RSI 필터와 TP/SL를 가진 SMA 및 9 EMA 크로스오버 전략
- RSI 트렌드 전략
- 이중 동적 지표 최적화 전략
- 이치모쿠 클라우드 브레이크오웃 및 스톱-러스 시스템과 함께 전략에 따른 다기술 지표 트렌드
- ATR 변동성 전략과 함께 다중 지표 동적 적응 위치 사이징
- 다중 지표 변동성 거래 RSI-EMA-ATR 전략
- 다중 지표 트렌드 모멘텀 크로스오버 양적 전략
- 다중 지표 양적 거래 전략 - 슈퍼 지표 7대1 전략
더 많은