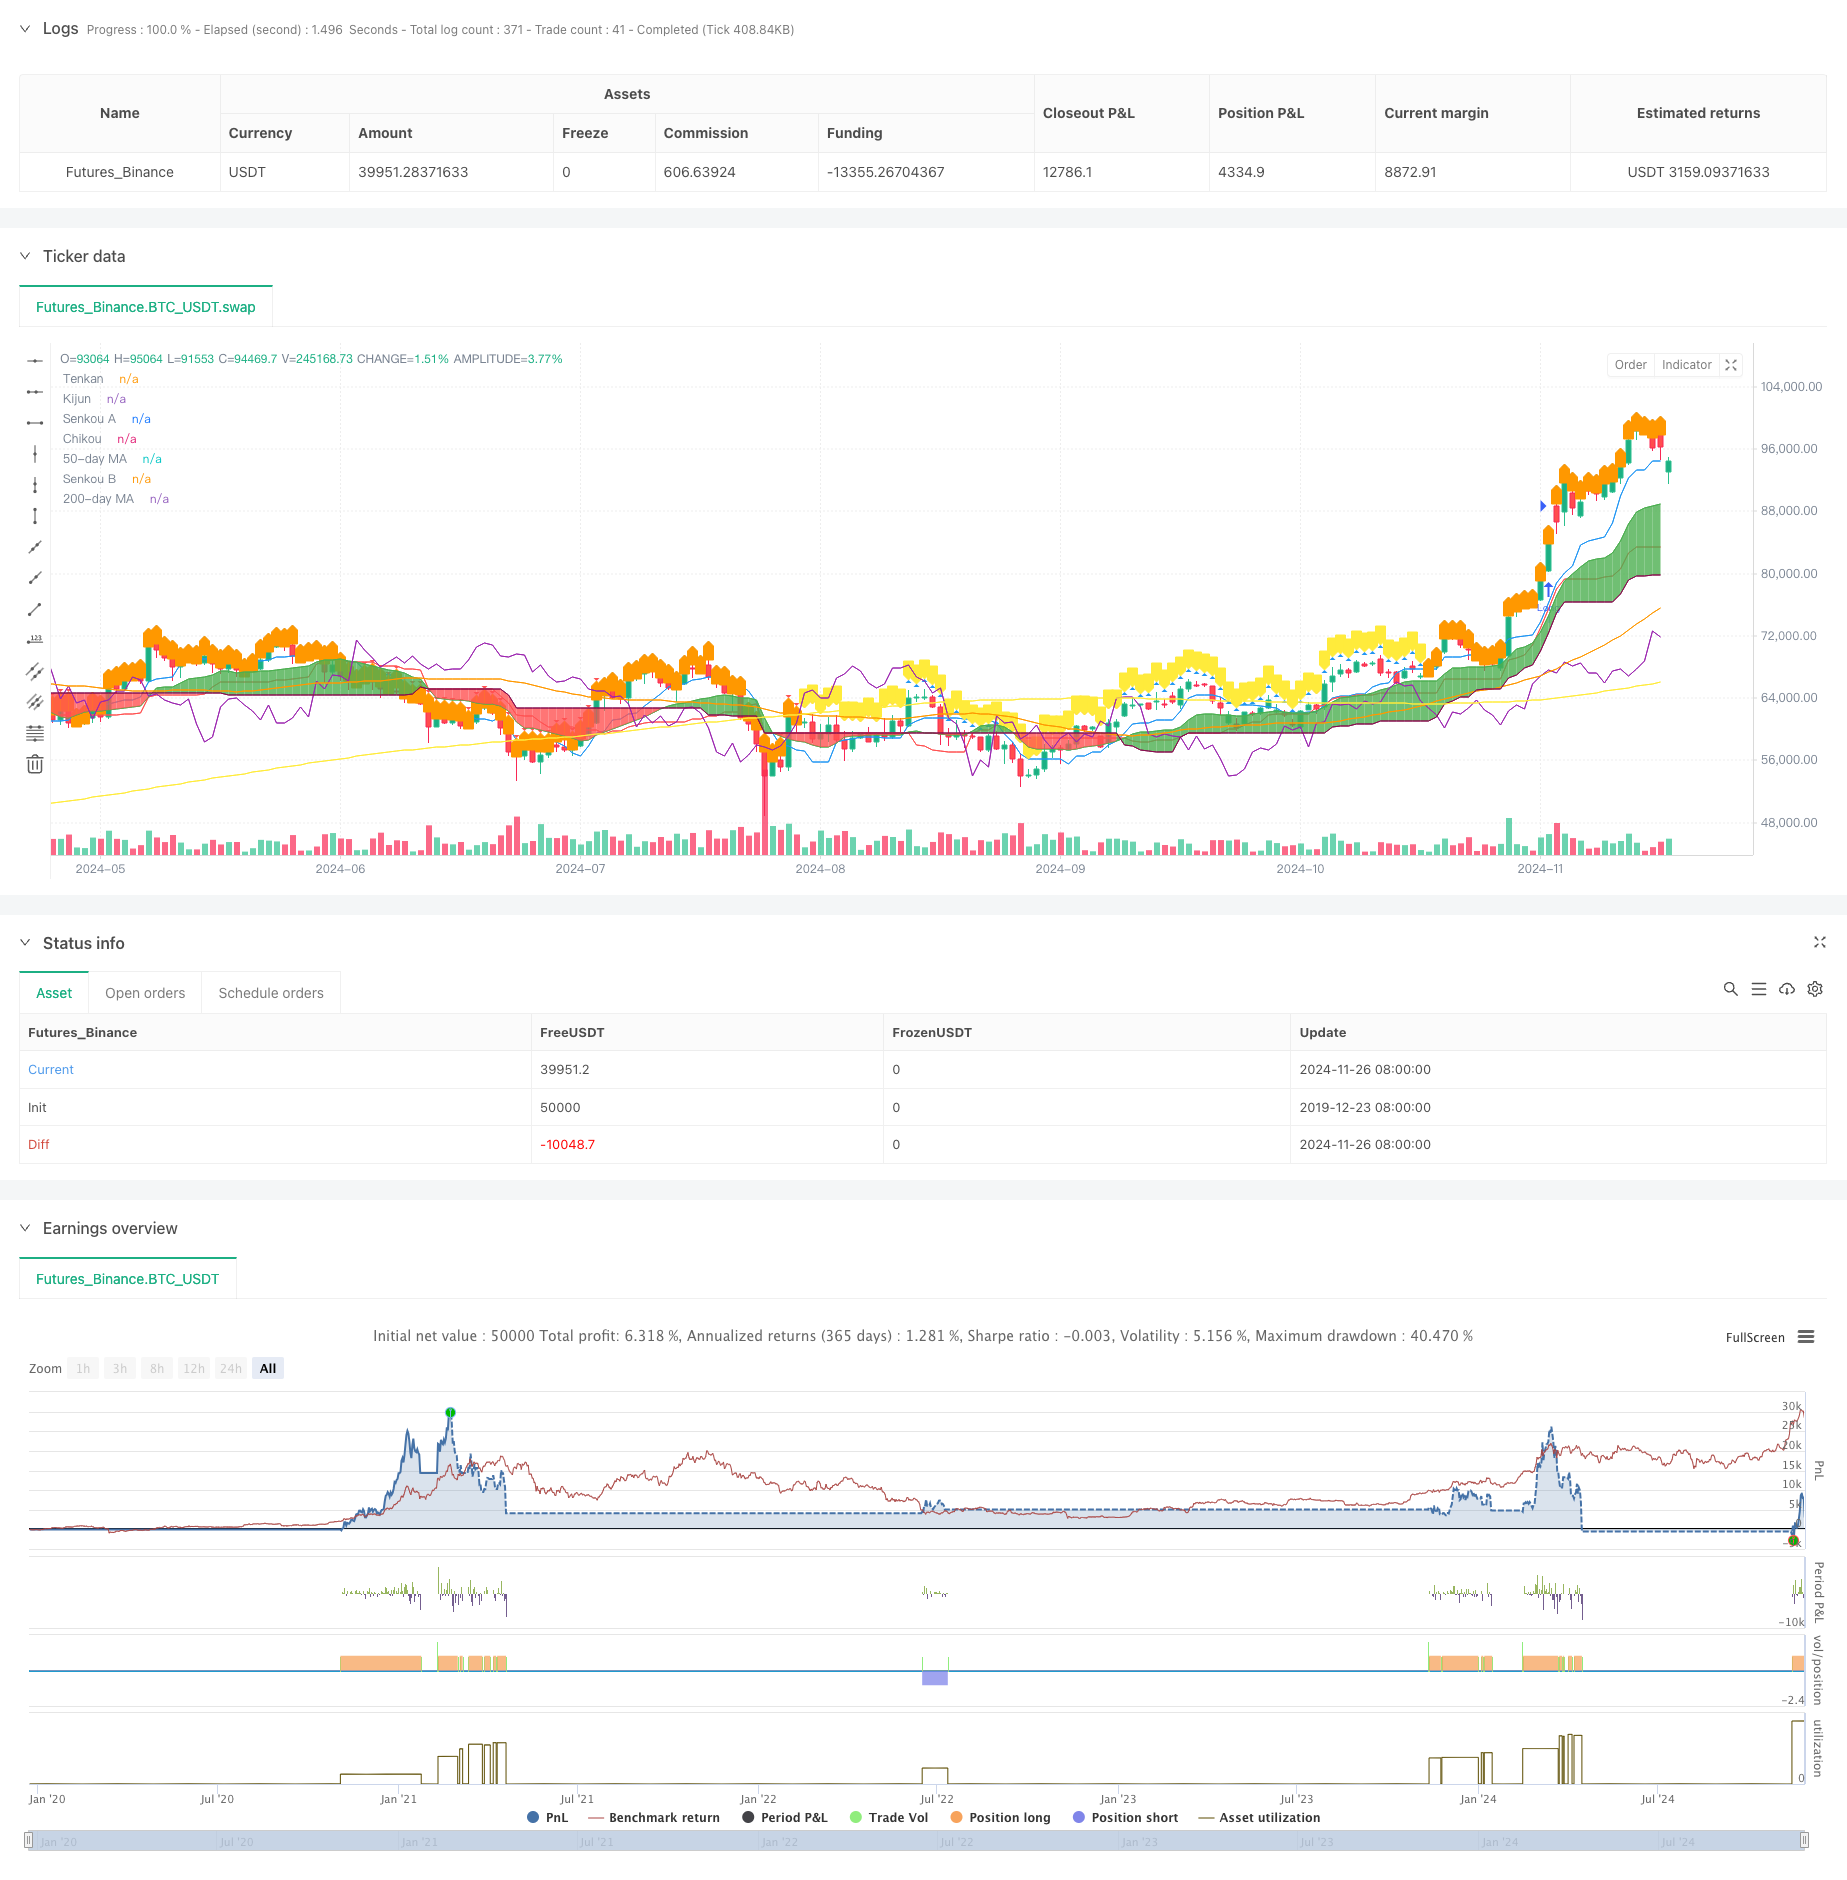
概述
该策略是一个结合了一系列技术指标的完整交易系统,主要基于一目云图(Ichimoku Cloud)指标进行交易决策。系统通过天线(Tenkan)与基准线(Kijun)的交叉来确定入场时机,同时结合相对强弱指数(RSI)和移动平均线(MA)作为辅助过滤条件。策略采用云图组件作为动态止损位,形成了一个完整的风险控制体系。
策略原理
策略的核心逻辑基于以下几个关键要素: 1. 入场信号由天线与基准线的交叉产生,上穿形成做多信号,下穿形成做空信号 2. 价格位置相对于云层(Kumo)的关系作为趋势确认,价格在云层之上做多,价格在云层之下做空 3. 50日与200日移动平均线的位置关系作为趋势过滤条件 4. 周线RSI指标作为市场强弱确认,过滤假信号 5. 使用云层上下边界作为动态止损位置,实现风险动态管理
策略优势
- 多重技术指标的组合提供了更可靠的交易信号,显著降低了假信号的影响
- 采用云图作为动态止损位,能够根据市场波动自动调整止损位置,既保护利润又给予价格足够的波动空间
- 通过周线RSI过滤,有效避免了在过度超买超卖区域的不利交易
- 移动平均线交叉提供了额外的趋势确认,提高了交易的成功率
- 完整的风险控制体系,包括入场、持仓和出场的各个环节
策略风险
- 多重指标过滤可能导致错过一些潜在的好机会
- 在震荡市场中可能产生频繁的假突破信号
- 云图指标本身具有一定的滞后性,可能影响入场时机
- 在快速波动的市场中,动态止损位可能过于宽松
- 过多的过滤条件可能导致交易机会减少,影响策略的整体收益
策略优化方向
- 引入波动率指标,根据市场波动调整策略参数
- 优化云图参数设置,使其更适合不同的市场环境
- 增加交易量分析,提高信号的可靠性
- 引入时间过滤机制,避开波动较大的时间段
- 开发自适应的参数优化系统,实现策略的动态调整
总结
该策略通过结合多个技术指标,构建了一个完整的交易系统。策略不仅注重信号的产生,还包含了完善的风险控制机制。通过多重过滤条件的设置,有效提高了交易的成功率。同时,动态止损的设计也为策略提供了良好的风险收益比。虽然存在一些优化空间,但整体而言是一个结构完整、逻辑清晰的策略系统。
策略源码
/*backtest
start: 2019-12-23 08:00:00
end: 2024-11-27 00:00:00
period: 1d
basePeriod: 1d
exchanges: [{"eid":"Futures_Binance","currency":"BTC_USDT"}]
*/

//@version=5
strategy("Ichimoku Strategy with Optional RSI, MA Filters and Alerts", overlay=true)

// Input for date and time filter
startDate = input(timestamp("2020-01-01 00:00"), title="Start Date")
endDate = input(timestamp("2023-01-01 00:00"), title="End Date")

// Inputs for Ichimoku settings
tenkanPeriod = input.int(9, title="Tenkan Period")
kijunPeriod = input.int(26, title="Kijun Period")
senkouBPeriod = input.int(52, title="Senkou B Period")

// Inputs for Moving Average settings
useMAFilter = input.bool(true, title="Enable Moving Average Filter?")
ma50Period = input.int(50, title="50-day MA Period")
ma200Period = input.int(200, title="200-day MA Period")

// Inputs for RSI settings
useRSIFilter = input.bool(true, title="Enable RSI Filter?")
rsiPeriod = input.int(14, title="RSI Period")
rsiOverbought = input.int(70, title="RSI Overbought Level")
rsiOversold = input.int(30, title="RSI Oversold Level")

// Ichimoku Cloud components
tenkan = (ta.highest(high, tenkanPeriod) + ta.lowest(low, tenkanPeriod)) / 2
kijun = (ta.highest(high, kijunPeriod) + ta.lowest(low, kijunPeriod)) / 2
senkouA = ta.sma(tenkan + kijun, 2) / 2
senkouB = (ta.highest(high, senkouBPeriod) + ta.lowest(low, senkouBPeriod)) / 2
chikou = close[26]

// Moving Averages
ma50 = ta.sma(close, ma50Period)
ma200 = ta.sma(close, ma200Period)

// Weekly RSI
rsiSource = request.security(syminfo.tickerid, "W", ta.rsi(close, rsiPeriod))

// Plotting the Ichimoku Cloud components
pTenkan = plot(tenkan, color=color.blue, title="Tenkan")
pKijun = plot(kijun, color=color.red, title="Kijun")
pSenkouA = plot(senkouA, color=color.green, title="Senkou A")
pSenkouB = plot(senkouB, color=color.maroon, title="Senkou B")
plot(chikou, color=color.purple, title="Chikou")
plot(ma50, color=color.orange, title="50-day MA")
plot(ma200, color=color.yellow, title="200-day MA")

// Corrected fill function
fill(pSenkouA, pSenkouB, color=senkouA > senkouB ? color.green : color.red, transp=90)

// Debugging: Output values on the chart to see if conditions are ever met
plotshape(series=(tenkan > kijun), color=color.blue, style=shape.triangleup, title="Tenkan > Kijun")
plotshape(series=(tenkan < kijun), color=color.red, style=shape.triangledown, title="Tenkan < Kijun")
plotshape(series=(ma50 > ma200), color=color.orange, style=shape.labelup, title="MA 50 > MA 200")
plotshape(series=(ma50 < ma200), color=color.yellow, style=shape.labeldown, title="MA 50 < MA 200")

// Define the trailing stop loss using Kumo
var float trailingStopLoss = na

// Check for MA conditions (apply only if enabled)
maConditionLong = not useMAFilter or (useMAFilter and ma50 > ma200)
maConditionShort = not useMAFilter or (useMAFilter and ma50 < ma200)

// Check for Ichimoku Cloud conditions
ichimokuLongCondition = close > math.max(senkouA, senkouB)
ichimokuShortCondition = close < math.min(senkouA, senkouB)

// Check for RSI conditions (apply only if enabled)
rsiConditionLong = not useRSIFilter or (useRSIFilter and rsiSource > rsiOverbought)
rsiConditionShort = not useRSIFilter or (useRSIFilter and rsiSource < rsiOversold)

// Combine conditions for entry
longCondition = maConditionLong and tenkan > kijun and ichimokuLongCondition and rsiConditionLong
shortCondition = maConditionShort and tenkan < kijun and ichimokuShortCondition and rsiConditionShort

// Date and time filter
withinDateRange = true

// Check for Long Condition
if (longCondition and withinDateRange)
    strategy.entry("Long", strategy.long)
    trailingStopLoss := math.min(senkouA, senkouB)
    alert("Buy Signal: Entering Long Position", alert.freq_once_per_bar_close)

// Check for Short Condition
if (shortCondition and withinDateRange)
    strategy.entry("Short", strategy.short)
    trailingStopLoss := math.max(senkouA, senkouB)
    alert("Sell Signal: Entering Short Position", alert.freq_once_per_bar_close)

// Exit conditions
exitLongCondition = close < kijun or tenkan < kijun
exitShortCondition = close > kijun or tenkan > kijun

if (exitLongCondition and strategy.position_size > 0)
    strategy.close("Long")
    alert("Exit Signal: Closing Long Position", alert.freq_once_per_bar_close)

if (exitShortCondition and strategy.position_size < 0)
    strategy.close("Short")
    alert("Exit Signal: Closing Short Position", alert.freq_once_per_bar_close)

// Apply trailing stop loss
if (strategy.position_size > 0)
    strategy.exit("Trailing Stop Long", stop=trailingStopLoss)
else if (strategy.position_size < 0)
    strategy.exit("Trailing Stop Short", stop=trailingStopLoss)
相关推荐