개요
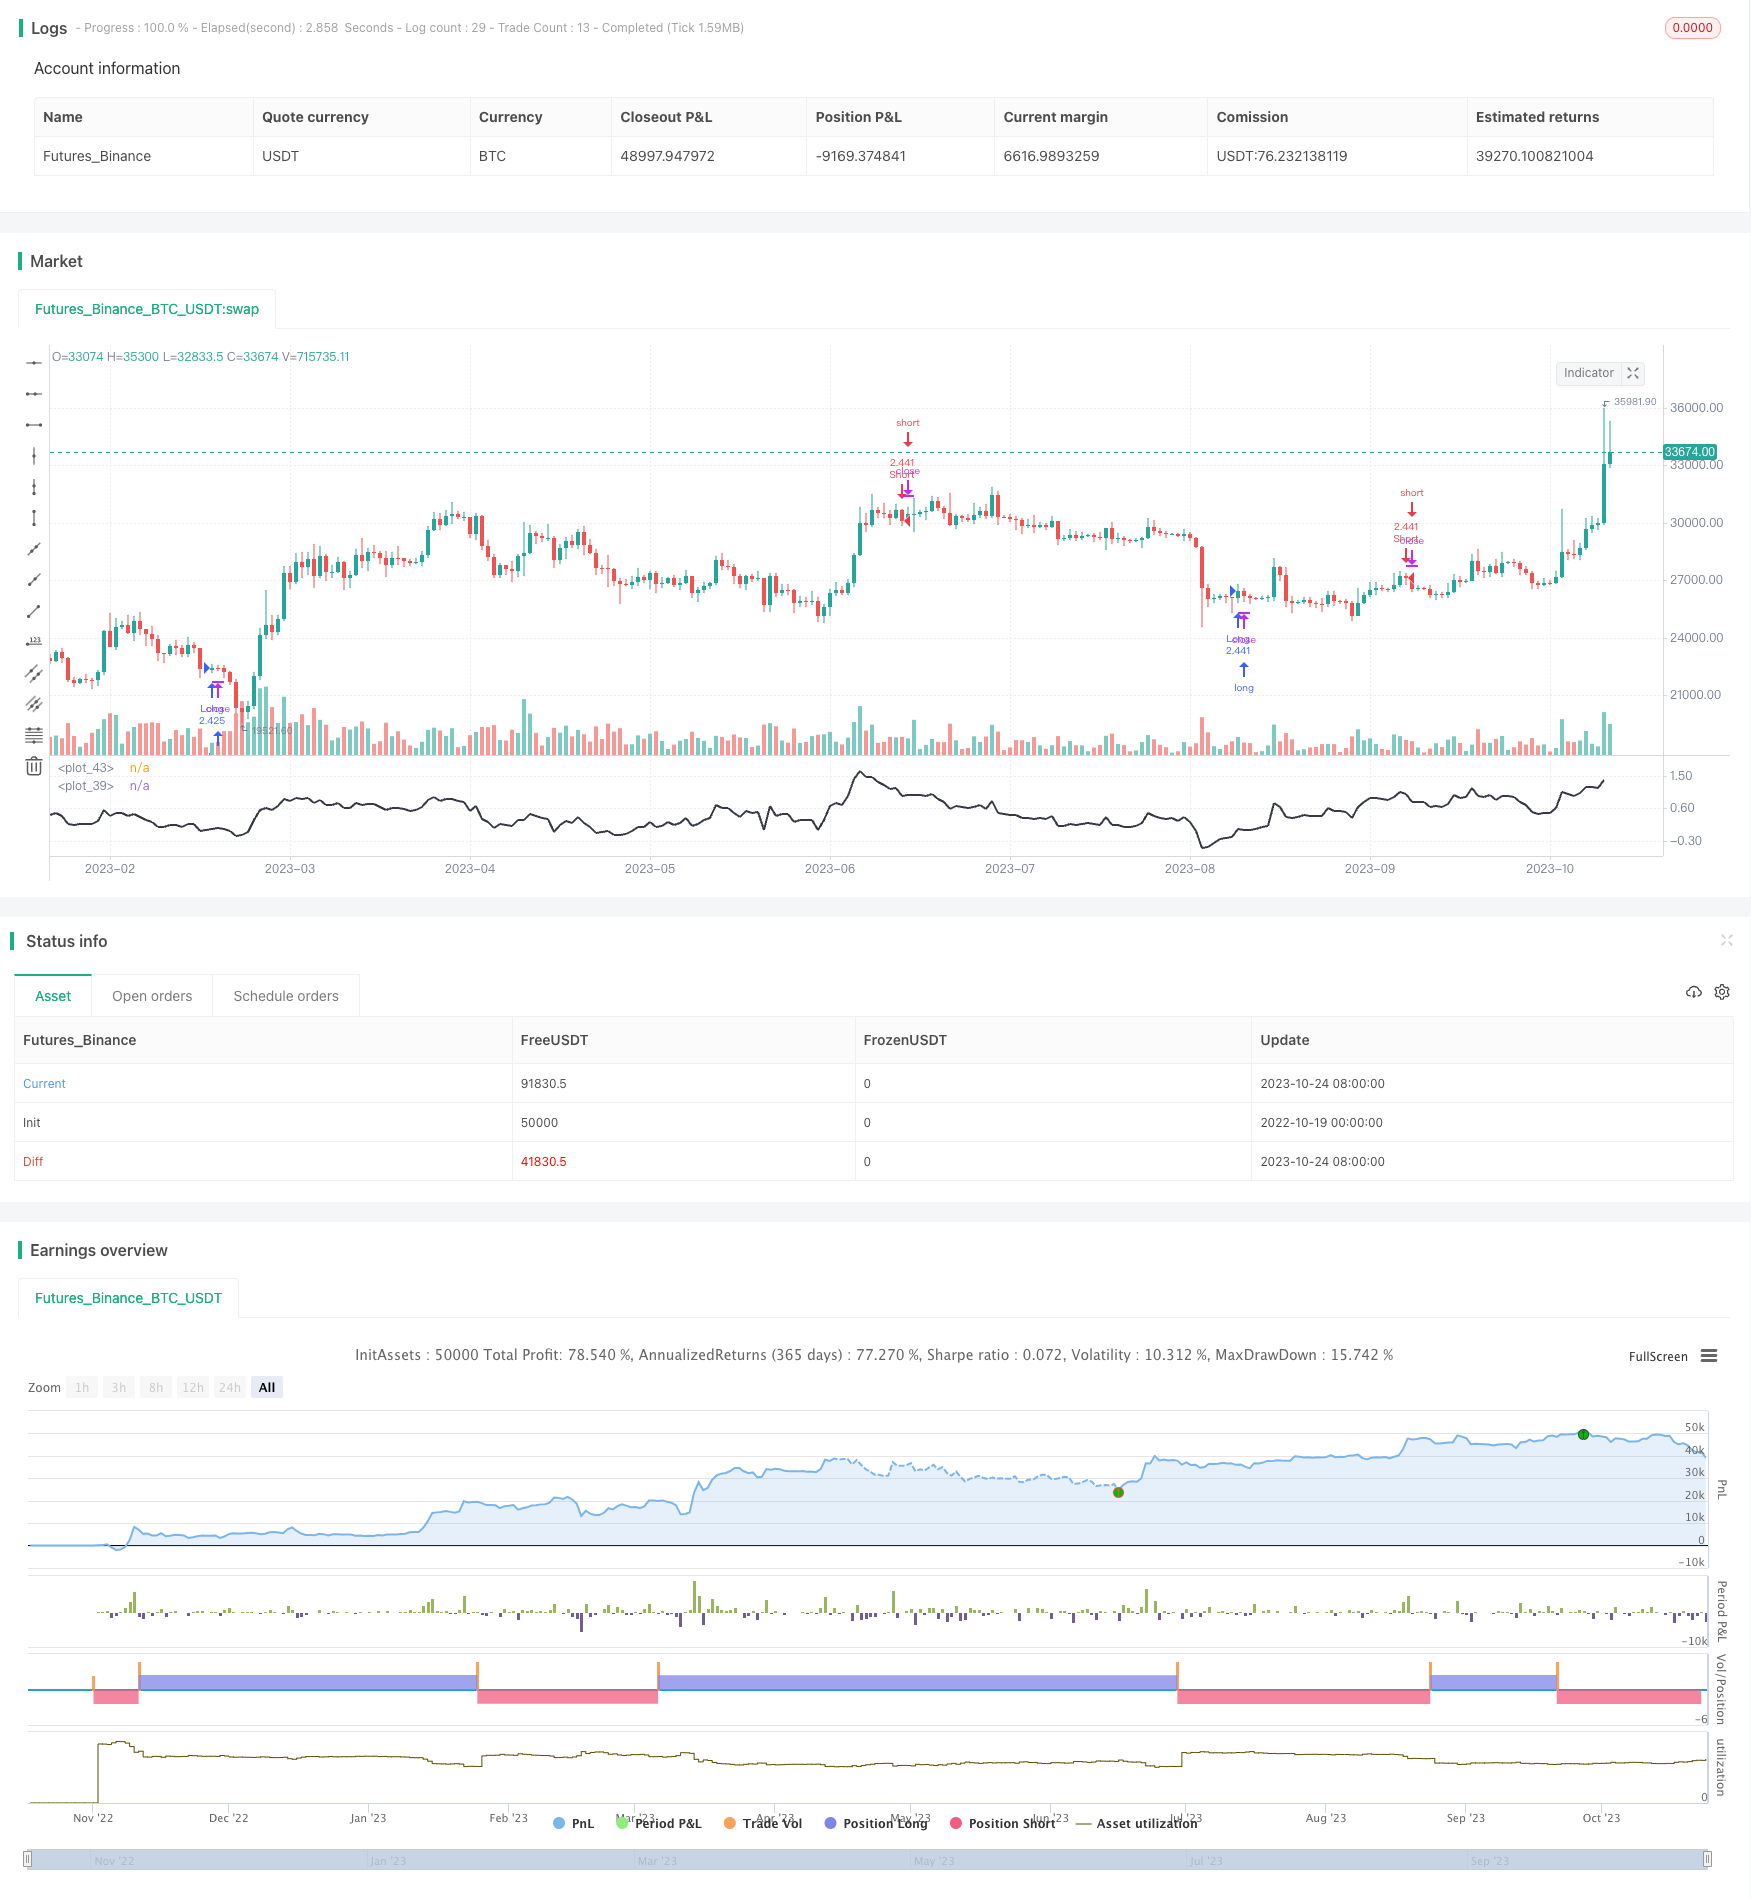
이 전략은 RSI 지표에 기반한 간단한 트렌드 따라 거래 시스템을 설계하여 특정 날짜 범위에서 RSI 지표를 통해 시장 추세 방향을 판단하여 자동으로 더 많은 공백을 수행 할 수 있습니다.
전략 원칙
이 전략은 RSI 지표를 사용하여 시장의 추세를 판단하고, 부린 벨트 통로를 통해 과매매 영역을 판단한다.
먼저, RSI 값을 계산하고, RSI의 이동 평균과 표준 차이를 RSI로 계산하여 부린 밴드 상하 궤도를 밟습니다. RSI 지표는 0 ~ 1 사이로 변동합니다. 부린 밴드는 표준 차이를 통해 오버 바이 오버 시트 영역을 결정합니다. RSI가 상하 궤도보다 높으면 오버 바이 영역이며, 하하 궤도보다 낮으면 오버 시트 영역입니다.
RSI가 하단 궤도에서 상단 궤도로 돌파할 때 구매 신호를 생성하고 상단 궤도에서 하단 궤도로 돌파할 때 판매 신호를 생성하여 트렌드를 따르십시오. 전략이 들어온 후, 정지 스톱을 설정하지 않고, 지정된 날짜가 끝날 때까지 매매하십시오.
이 전략은 간단하고 효과적으로 RSI 지표를 사용하여 트렌드 방향을 판단하고, 브린 밴드를 사용하여 특정 거래 시간을 결정한다. 거래 날짜 범위를 제한함으로써 불필요한 위험을 피할 수 있다.
우위 분석
- RSI를 사용하여 트렌드 방향을 판단하는 것은 간단하고 효과적입니다.
- 브린 띠와 함께 거래 확인 신호를 사용하여 가짜 침입을 방지합니다.
- 거래 날짜 범위를 제한하여 시장 위험을 피하는 데 도움이 됩니다.
- 스톱 스톱을 설정하지 않고 트렌드를 최대한 추적합니다.
- 다양한 시장 환경에 적용 가능한 유연하게 조정 가능한 매개 변수
위험과 최적화
- 시장의 급격한 변동으로 인해 손실이 발생할 수 있습니다.
- 정지장치가 설치되어 있지 않아서 위험을 효과적으로 제어할 수 없습니다.
- 잘못된 매개 변수 설정으로 인해 거래가 빈번하거나 기회를 놓칠 수 있습니다.
최적화 방향:
- 위험 관리 전략에 참여하세요.
- 패러미터 설정을 최적화하여 승률을 높여라
- 다른 지표와 함께 필터링 신호를 사용하여 가짜 돌파를 방지합니다.
- 동적으로 포지션 규모를 조정하는 방법
요약하다
이 전략은 전반적으로 매우 간단한 직접적인 추세를 따라가는 전략이다. RSI 판단 트렌드를 사용하여, 브린은 필터링 신호를 가지고, 거래 날짜 범위를 제한하여, 트렌드를 효과적으로 추적하고 위험을 제어 할 수 있다. 그러나 전략은 더 이상 최적화 할 수 있으며, 손실 중지, 매개 변수 최적화, 신호 필터링 등의 방법을 통해 더 이상 개선 할 수 있습니다.
/*backtest
start: 2022-10-19 00:00:00
end: 2023-10-25 00:00:00
period: 1d
basePeriod: 1h
exchanges: [{"eid":"Futures_Binance","currency":"BTC_USDT"}]
*/

//Gidra
//2018

//@version=2
strategy(title = "Gidra's RSI or MFI Strategy v0.1", shorttitle = "Gidra's RSI or MFI v0.1", overlay = false, default_qty_type = strategy.percent_of_equity, default_qty_value = 100, pyramiding = 1)

//Settings
needlong = input(true, defval = true, title = "Long")
needshort = input(true, defval = true, title = "Short")
capital = input(100, defval = 100, minval = 1, maxval = 10000, title = "Lot, %")
src = input(close, title="source")
lengthRSI = input(14, title="RSI or MFI length")
// RSI %B
useRSI = input(true, title="use RSI or MFI")
fromyear = input(2018, defval = 2018, minval = 1900, maxval = 2100, title = "From Year")
toyear = input(2100, defval = 2100, minval = 1900, maxval = 2100, title = "To Year")
frommonth = input(01, defval = 01, minval = 01, maxval = 12, title = "From Month")
tomonth = input(12, defval = 12, minval = 01, maxval = 12, title = "To Month")
fromday = input(01, defval = 01, minval = 01, maxval = 31, title = "From Day")
today = input(31, defval = 31, minval = 01, maxval = 31, title = "To Day")

//MFI
upper = sum(volume * (change(src) <= 0 ? 0 : src), lengthRSI)
lower = sum(volume * (change(src) >= 0 ? 0 : src), lengthRSI)
mf = rsi(upper, lower)

//RSI
rsi = useRSI?rsi(src, lengthRSI): mf

// %B
length = input(50, minval=1, title="BB length")
mult = input(1.618, minval=0.001, maxval=50)
basis = sma(rsi, length)
dev = mult * stdev(rsi, length)
upperr = basis + dev
lowerr = basis - dev
bbr = (rsi - lowerr)/(upperr - lowerr)

plot(bbr, color=black, transp=0, linewidth=2)
// band1 = hline(1, color=white, linestyle=dashed)
// band0 = hline(0, color=white, linestyle=dashed)
// fill(band1, band0, color=teal)
hline(0.5, color=white)

//Signals
up = bbr >= 0 and bbr[1] < 0
dn = bbr <= 1 and bbr[1] > 1
//exit = ((bbr[1] < 0.5 and bbr >= 0.5) or (bbr[1] > 0.5 and bbr <= 0.5))

lot = strategy.position_size == 0 ? strategy.equity / close * capital / 100 : lot[1]

//Trading
if up
    strategy.entry("Long", strategy.long, needlong == false ? 0 : lot, when=(time > timestamp(fromyear, frommonth, fromday, 00, 00) and time < timestamp(toyear, tomonth, today, 23, 59)))

if dn
    strategy.entry("Short", strategy.short, needshort == false ? 0 : lot, when=(time > timestamp(fromyear, frommonth, fromday, 00, 00) and time < timestamp(toyear, tomonth, today, 23, 59)))

if time > timestamp(toyear, tomonth, today, 23, 59)// or exit
    strategy.close_all()