개요
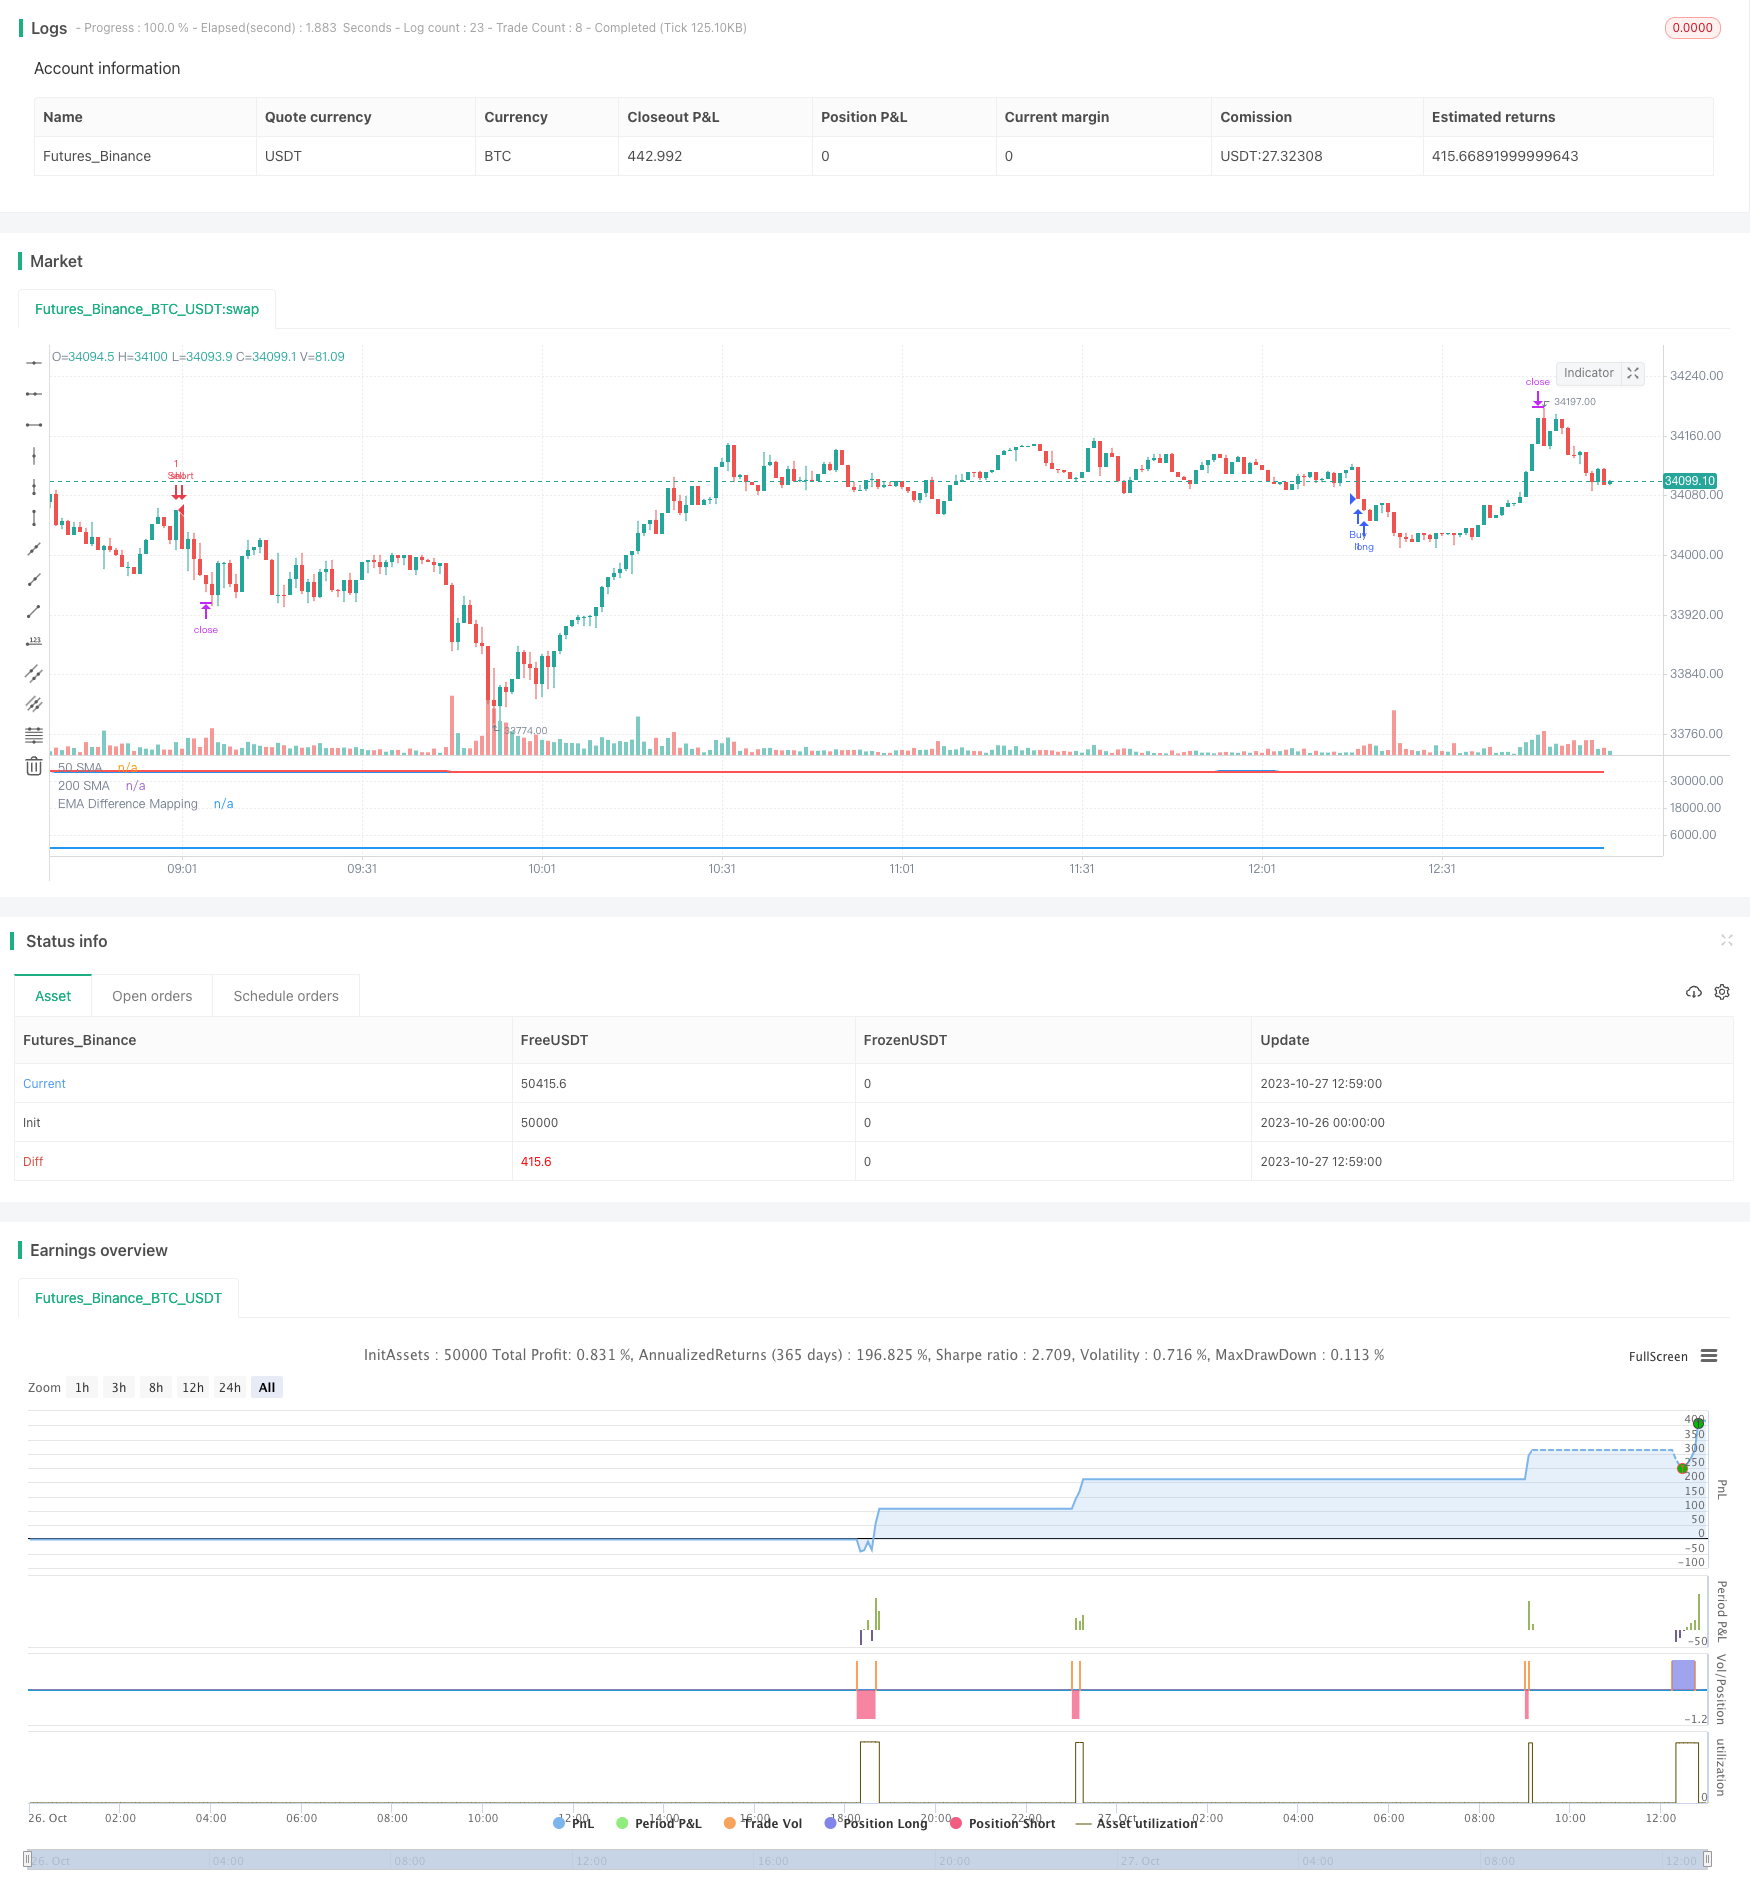
이 전략은 두 개의 이동 평균의 교차를 거래 신호로 사용하며, 파도 지표 BB와 사용자 정의 동력 지표와 결합하여 필터링을 수행하여 MA 교차 신호의 신뢰성을 높이고 가짜 신호를 줄이는 것을 목표로합니다.
원칙
50주기 EMA와 200주기 SMA를 사용하여 금叉死叉 신호를 형성한다.
가격이 상승하는 경향에 있을 때, 가격이 200 일선 이상과 사용자 정의 동력 지표 값이 25보다 작을 때 구매 신호를 생성하기 위해 요구한다.
가격이 하향 추세에 있을 때, 가격이 200 일선 아래로 요구되고 사용자 정의 동력 지표 값이 75보다 크면 판매 신호를 생성한다.
사용자 정의 동력 지표는 BB 중선과 상하철의 거리를 기준으로 0-100 범위로 매핑한다. 통계적 거리의 최대 최소값을 거슬러 올라가는 것으로 통일 처리한다.
동력 지표는 가격의 상대적인 파장의 위치 정보를 반영하고, 값을 설정하여 필터링하여 가짜 교차를 효과적으로 줄일 수 있다.
우위 분석
EMA와 SMA의 장점을 활용하여 중·장기 트렌드를 잡습니다.
동력 지표가 증가하여 필터링이 가능하며, 신뢰성이 높으며, 잘못된 신호가 감소한다.
BB 위아래 궤도 거리는 파동력을 반영하고, 역전통과 결합하여 표준화 처리하여 파라미터 의존성을 피한다.
사용자 정의 EMA 및 SMA 사이클 및 동력 지표 마이너스 값은 다른 시장 환경에 적합합니다.
전략이 명확하고 이해가 쉬우며, 변수 조정 공간이 넓고 실용성이 강하다.
위험 분석
EMA와 SMA 자체는 지연되어 있으며, 단선 기회를 놓칠 수 있습니다.
이중선 교차는 본질적으로 동향추적 전략이며, 충격적인 상황에는 적합하지 않다.
동력 지표 값은 적절한 매개 변수를 결정하기 위해 반복적으로 재검토가 필요하며, 곡선 최적화 위험이 있습니다.
대주기 평균선 전략, 수익은 상대적으로 안정적이지만 절대적인 수익은 제한적일 수 있다.
평균주기를 적절히 단축하거나, 다른 지표들을 추가하여 판단을 보조하고, 전략의 적응성을 향상시킬 수 있다.
최적화 방향
다양한 평행선 조합을 테스트하여 최적의 변수를 찾습니다.
MACD, KD 등과 같은 다른 지표 판단을 추가하십시오.
역 에너지 지표의 파라미터를 최적화합니다. 예를 들어 회귀 주기, 지도 범위 등.
위험 조절을 위해 스톱패스 메커니즘을 추가합니다.
다양한 품종의 파라미터가 일치하지 않는 경우, 기계 학습 특성을 추출하는 것을 고려할 수 있다.
불합리한 교차 신호를 피하기 위해 양전력 지표를 추가하십시오.
요약하다
이 전략은 통합 주기적 트렌드 추적과 사용자 정의 동력 지표의 이중 필터링의 장점이 하나, 신뢰성이 높으며 실전 가치는 강하다. 매개 변수 최적화 및 보조 기술 지표 보강을 통해 더 뛰어난 성능을 얻을 수 있다. 이 전략은 새로운 아이디어로 다른 트렌드 추적 전략에 참고 자료를 제공 할 수 있으며, 수치화 거래 전략 저장소에 귀중한 보충이다.
/*backtest
start: 2023-10-26 00:00:00
end: 2023-10-27 13:00:00
period: 1m
basePeriod: 1m
exchanges: [{"eid":"Futures_Binance","currency":"BTC_USDT"}]
*/

//@version=4
strategy(title="EMA Difference Mapping with Trades", shorttitle="EMA Diff Map", overlay=false)

// Inputs
emaLength = input(20, "EMA Length")
stdDevLength = input(2, "Standard Deviation Length")
priceSource = close
takeProfitPoints = input(1000, title="Take Profit (in Points)")
stopLossPoints = input(2500, title="Stop Loss (in Points)")

// Calculate EMA
ema = ema(priceSource, emaLength)

// Calculate Standard Deviation
stdDev = stdev(priceSource, stdDevLength)

// Calculate differences
diff1 = (ema + stdDev) - ema
diff2 = ema - (ema - stdDev)

// Calculate min and max differences from last year
lookbackPeriod = 504 // Number of trading days in a year
minDiff1 = lowest(diff1, lookbackPeriod)
maxDiff1 = highest(diff1, lookbackPeriod)
minDiff2 = lowest(diff2, lookbackPeriod)
maxDiff2 = highest(diff2, lookbackPeriod)

// Map differences based on requirements
mappedDiff1 = 50 + 50 * ((diff1 - minDiff1) / (maxDiff1 - minDiff1))
mappedDiff2 = 50 - 50 * ((diff2 - minDiff2) / (maxDiff2 - minDiff2))

// Combine mapped differences into a single line
mappedLine = if close > ema
    mappedDiff1
else
    mappedDiff2

// Plot 'mappedLine' in the main chart area conditionally
plot(mappedLine, title="EMA Difference Mapping", color=(close > ema ? color.blue : na), style=plot.style_line, linewidth=2)

// Calculate the 50EMA and 200SMA
ema50 = ema(close, 50)
sma200 = sma(close, 200)

// Plot the 50EMA and 200SMA on the main chart
plot(ema50, color=color.blue, title="50 SMA", linewidth=2)
plot(sma200, color=color.red, title="200 SMA", linewidth=2)

// Initialize trade variables
var bool waitingForBuy = na
var bool waitingForSell = na
var bool buyConditionMet = false
var bool sellConditionMet = false

if not sellConditionMet and crossunder(ema50, sma200)
    sellConditionMet := true
    waitingForBuy := false

if sellConditionMet
    waitingForSell := true
    sellConditionMet := false

if waitingForSell and close < sma200 and mappedLine > 75
    strategy.entry("Sell", strategy.short)
    strategy.exit("Sell Exit", "Sell", profit=takeProfitPoints, loss=stopLossPoints)
    waitingForSell := false

// Define the strategy conditions and execute trades
if not buyConditionMet  and crossover(ema50, sma200)
    buyConditionMet := true
    waitingForSell := false

if buyConditionMet
    waitingForBuy := true
    buyConditionMet := false

if waitingForBuy and close > sma200 and mappedLine < 25
    strategy.entry("Buy", strategy.long)
    strategy.exit("Buy Exit", "Buy", profit=takeProfitPoints, loss=stopLossPoints)
    waitingForBuy := false