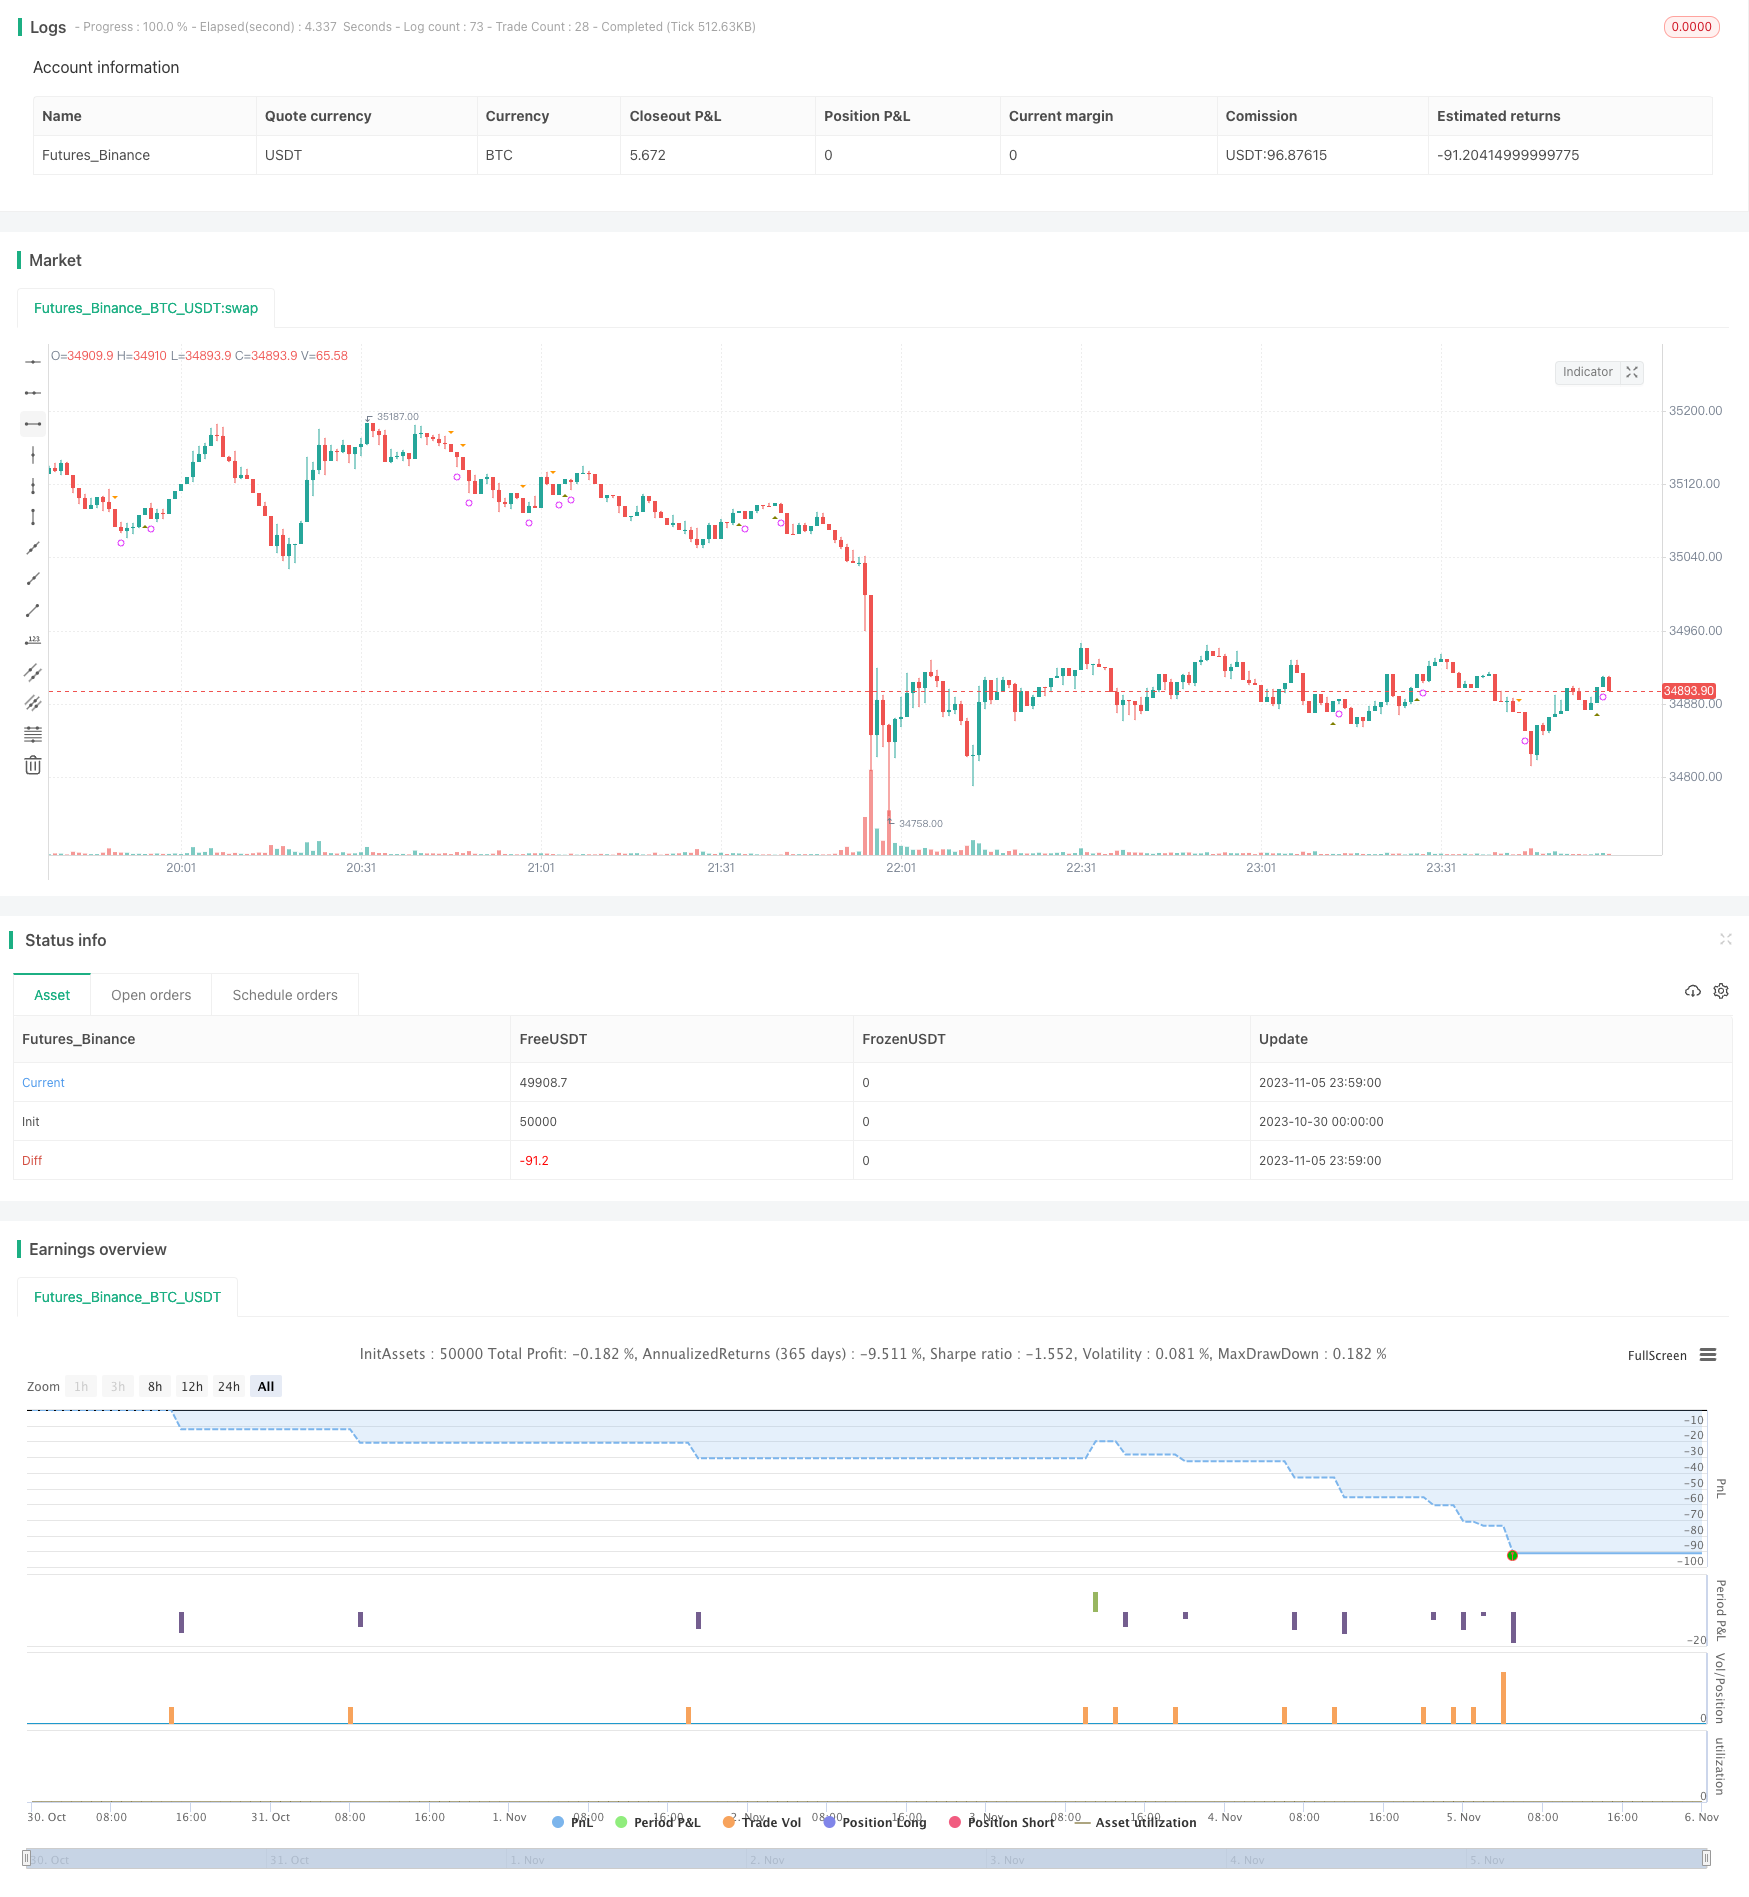
이중 그림자 역전 전략
저자:차오장, 날짜: 2023-11-07 17:00:52태그:

전반적인 설명
이중 그림자 역전 전략은 촛불 패턴을 기반으로 한 단기 거래 전략이다. 두 개의 촛불이 그림자가 없는 특별한 촛불 패턴을 탐지함으로써 잠재적 역전 기회를 식별합니다. 전략은 간단하고 간단하지만 주목해야 할 특정 위험이 있습니다.
원칙
이 전략의 핵심 논리는 이중 그림자 패턴을 식별하는 것입니다. 구체적으로, 현재 촛불이
기술 분석 이론에 따르면 이 이중 그림자 패턴은 종종 임박한 트렌드 반전을 암시한다. 두 개의 연속 촛불에서 매우 좁은 범위 내에서 변동하는 가격은 구매력과 판매력의 평형을 나타냅니다. 이는 아마도 반전을 암시합니다.
이중 그림자 패턴을 감지하면 전략은 이전 클로즈에 따라 다음 촛불에서 장 또는 단점에 진입하고 일정 수의 바 후에 포지션을 닫습니다.
장점
-
전략 논리는 간단하고 이해하기 쉬우며, 간단한 패턴 인식이 구현하기 쉽습니다.
-
그것은 몇 가지 기술적 분석 논리를 가지고 있는 고전적인 이중 그림자 반전 패턴을 이용합니다.
-
빈번한 거래는 비용과 위험을 줄이는 데 도움이 됩니다.
-
백테스팅 기능을 추가하고 매개 변수를 최적화하기 쉽습니다.
위험성
-
패턴 거래는 역사적인 차트 통계와 확률에 의존하고 있으며 오차가 발생할 수 있습니다.
-
이중 그림자는 반전을 암시하지만 실제 반전은 일어나지 않거나 지속되지 않을 수 있습니다.
-
고정 수익 구역은 빠르게 변화하는 시장에 잘 대처하지 못할 수 있습니다.
-
제한된 촛불 정보를 보는 것은 너무 열광적인 항목으로 이어질 수 있습니다.
개선 방법
-
트렌드 지표를 포함하여 역 트렌드 거래를 피합니다.
-
확인을 기다리는 항목을 사용하여 실제 반전을 확인합니다.
-
일정한 기간 대신 ATR에 기반한 동적 스톱 손실을 설정합니다.
-
기계 학습을 사용하여 어떤 이중 그림자 패턴이 더 신뢰할 수 있는지 결정합니다.
요약
이중 그림자 역전 전략은 패턴 거래의 고전적인 개념을 간단하고 직관적인 방식으로 활용하며, 초보자에게 적합하며 알고의 모듈 구성 요소로도 사용됩니다. 그러나 리스크 관리는 여전히 필수적이며, 전략은 입시 타이밍과 수익을 취하는 방법을 최적화하여 개선 할 수 있습니다. 전반적으로이 전략의 장단점은 참조에 매우 분명합니다.
/*backtest
start: 2023-10-30 00:00:00
end: 2023-11-06 00:00:00
period: 1m
basePeriod: 1m
exchanges: [{"eid":"Futures_Binance","currency":"BTC_USDT"}]
*/

//@version=3
strategy("No Shadow Candles", overlay=true)

//set inputs
bars_until_close_trade = input(1,"Bars Until Close", minval = 1)
backtest_option = input(true,"Backtest on Twice alert?", bool)

//set conditions
up = close > close[1] and low >= open and high <= close
down = close < close[1] and low >= close and high <= open

up2 = (close > close[1] and low >= open and high <= close) and (close[1] > close[2] and low[1] >= open[1] and high[1] <= close[1])
down2 = (close < close[1] and low >= close and high <= open) and (close[1] < close[2] and low[1] >= close[1] and high[1] <= open[1])

close_trade = barssince(up or down) == bars_until_close_trade
close_trade2 = barssince(up2 or down2) == bars_until_close_trade

//plot indicators
plotshape(up,"Up Marker", shape.triangleup, location.belowbar, color = olive, size = size.tiny, transp = 50)
plotshape(down,"Down Marker", shape.triangledown, location.abovebar, color = orange, size = size.tiny, transp = 50)
plotshape(up2,"Up Twice Marker", shape.triangleup, location.belowbar, color = white, size = size.small)
plotshape(down2,"Down Twice Marker", shape.triangledown, location.abovebar, color = white, size = size.small)
plotshape(close_trade,"Close Trigger", shape.circle, location.belowbar, color = fuchsia, size = size.tiny, transp = 50)
plotshape(close_trade2,"Close Trigger2 (After Twice Alert)", shape.circle, location.belowbar, color = red, size = size.small)

//Strategy Testing


// Component Code Start
// Example usage:
// if testPeriod()
//   strategy.entry("LE", strategy.long)
testStartYear = input(2017, "Backtest Start Year")
testStartMonth = input(01, "Backtest Start Month")
testStartDay = input(2, "Backtest Start Day")
testPeriodStart = timestamp(testStartYear,testStartMonth,testStartDay,0,0)

testStopYear = input(2019, "Backtest Stop Year")
testStopMonth = input(7, "Backtest Stop Month")
testStopDay = input(30, "Backtest Stop Day")
testPeriodStop = timestamp(testStopYear,testStopMonth,testStopDay,0,0)

// A switch to control background coloring of the test period
testPeriodBackground = input(title="Color Background?", type=bool, defval=true)
testPeriodBackgroundColor = testPeriodBackground and (time >= testPeriodStart) and (time <= testPeriodStop) ? #00FF00 : na
bgcolor(testPeriodBackgroundColor, transp=97)

testPeriod() => true
// Component Code Stop

//Entry and Close settings
if testPeriod() and backtest_option == true
    strategy.entry("up2", true, when = up2, limit = close)
    strategy.close("up2", when = close_trade)

if testPeriod() and backtest_option == false
    strategy.entry("up", true,  when = up, limit = close)
    strategy.close("up", when = close_trade)
- 변동성 압축 브레이크업 전략
- 돈치안 채널 브레이크업 거래 전략
- RSI True Level Breakout 전략
- RSI 반전 브레이크업 전략
- 파라볼리 SAR 동적 브레이크오웃 삼중 SMMA 전략
- SMA 크로스오버 전략
- 변동성 조정 이동 평균 거래 전략
- 모멘텀 브레이크업 전략
- 하락 추세에서 단기 거래 전략
- 부피 가격 트렌드 반전 Forex 거래 전략
- 두 배 빠른 RSI 돌파구 전략
- 크로스 타임프레임 헐 이동 평균 구매 판매 전략
- 동력 트렌드 추적 전략
- 혼란스러운 거래 규칙 손실 중지 전략
- VWMA와 ATR 트렌드 다음 전략
- KST EMA 추진 동향 전략
- 전략에 따른 RSI 트렌드
- 이중 시간 프레임 DI 트렌드 전략에 따라
- 다중 지표 점수 거래 전략
- 트렌드 역전 및 Ehlers 선도 지표 컴보 전략