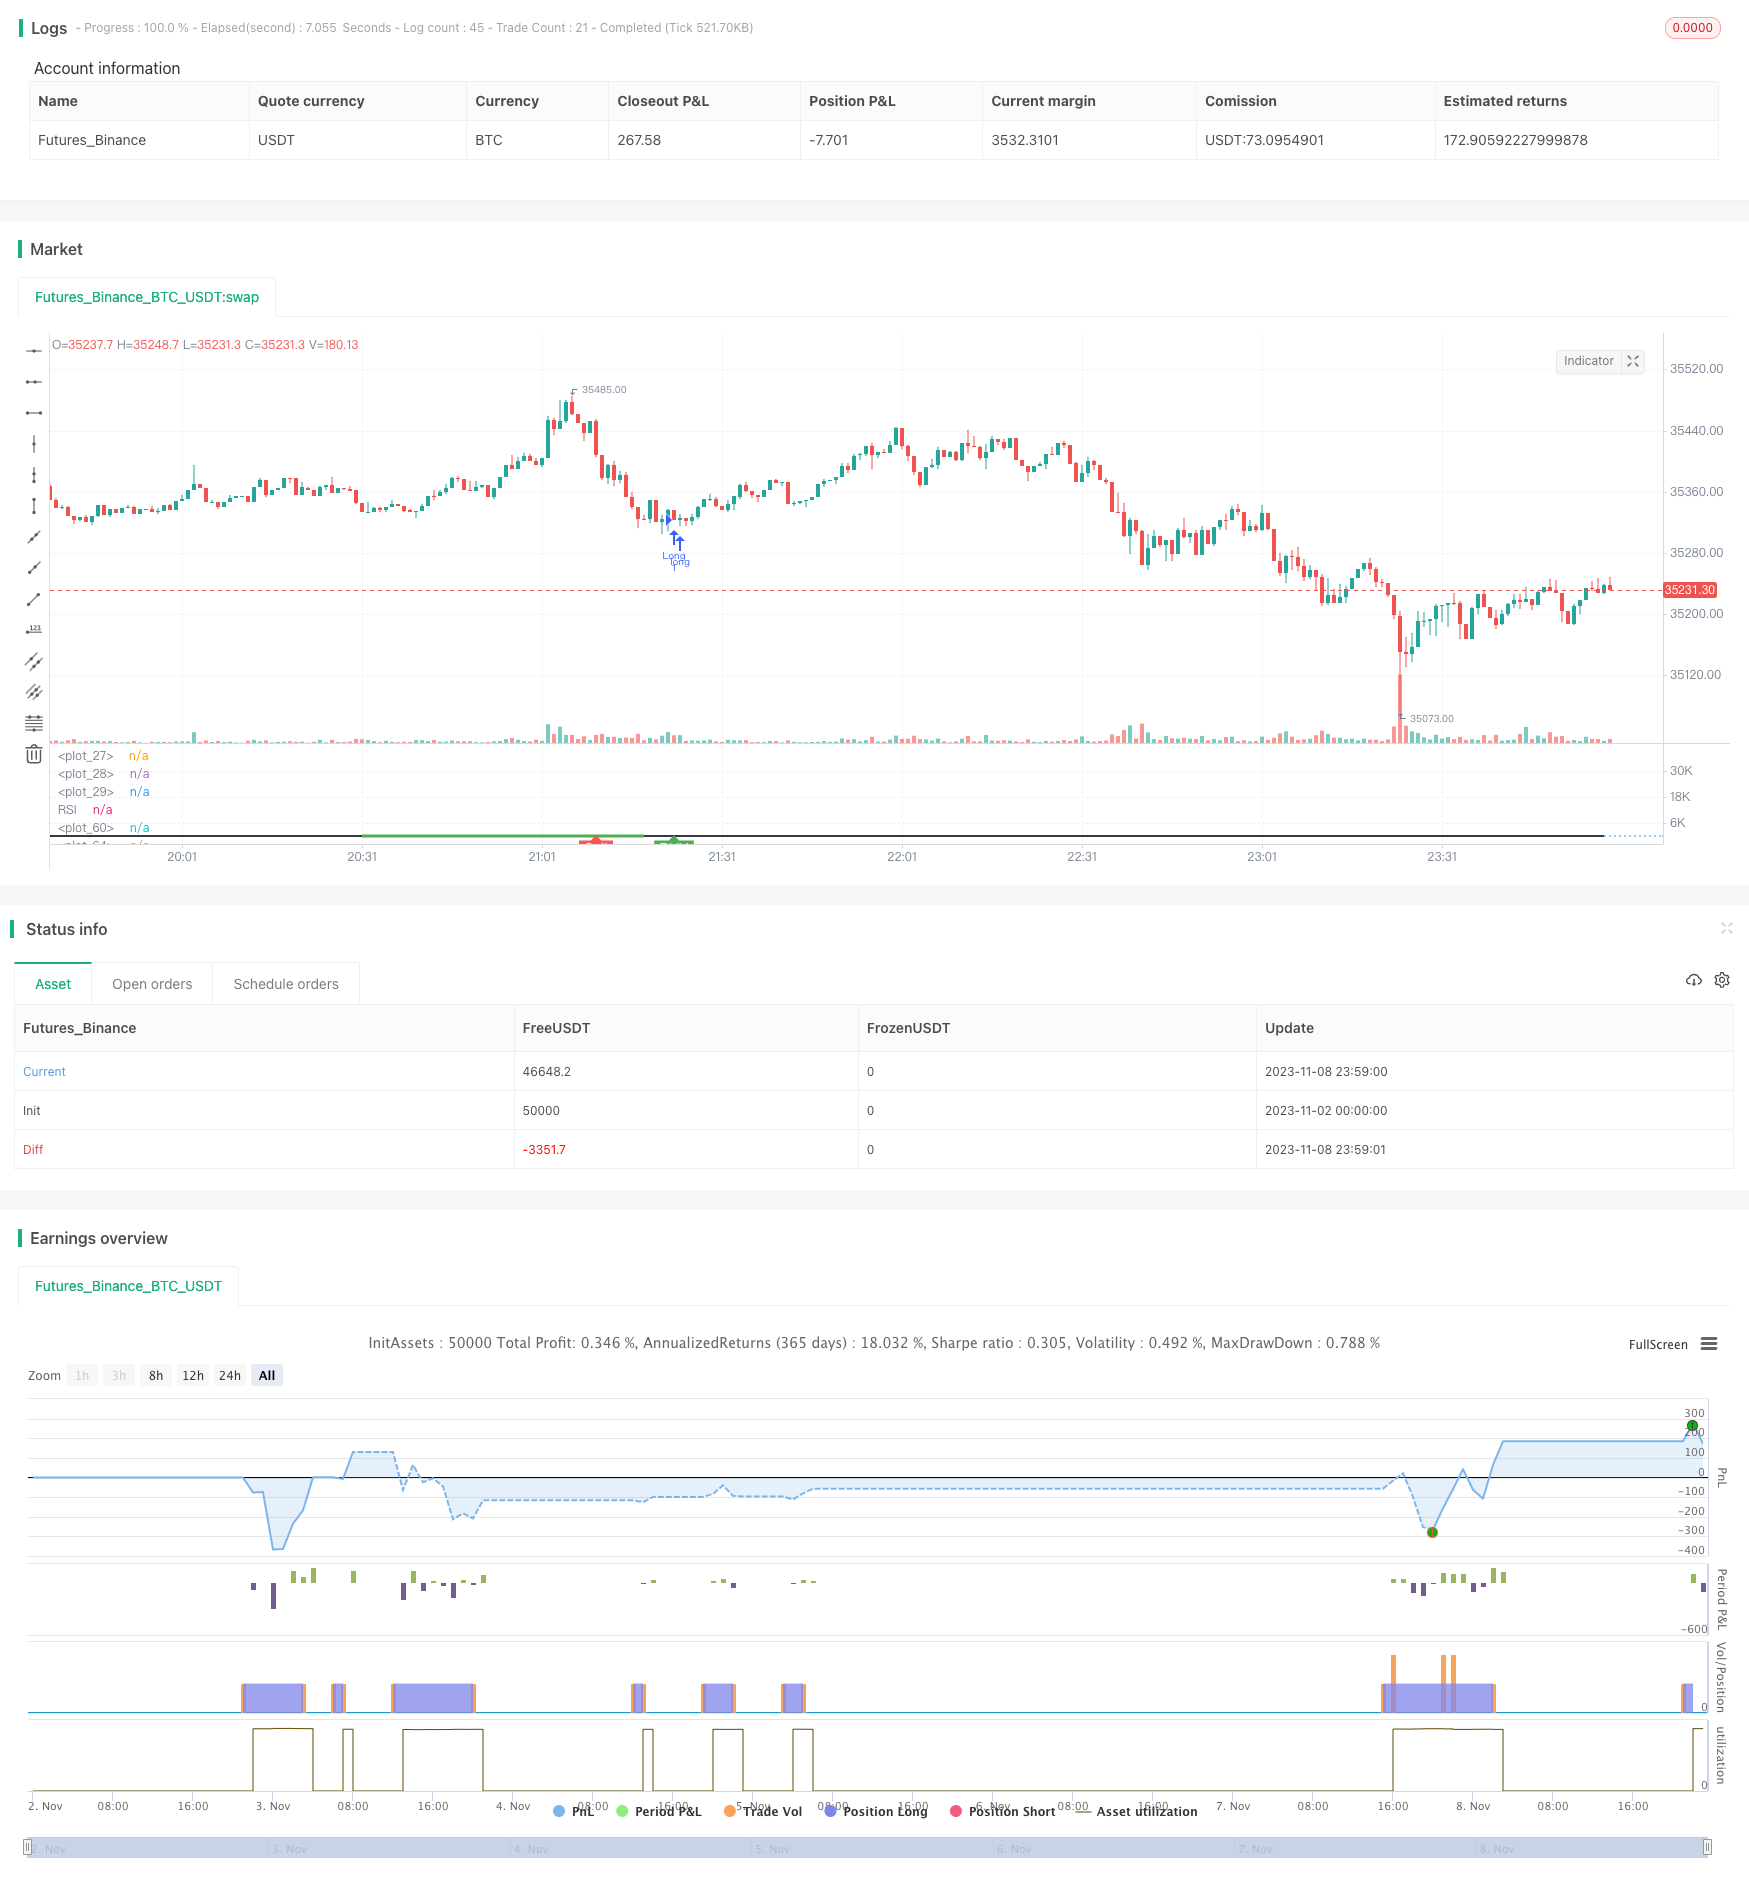
개요
이 전략은 RSI 지표의 다중 기각을 찾아서, Bitcoin 가격이 단기간에 상승하는 것을 반발할 수 있는 시점을 판단하여 적절한 구매 시점을 결정한다.
전략 원칙
RSI를 사용하여 멀티 헤드 오버탈이 있는지 판단합니다.
- RSI 지표 파라미터를 정의합니다.
- 현재 RSI 값을 계산합니다.
- 다음의 경우를 판단하세요:
- RSI 지표의 하위/하위
- 이 시점에 가격이 낮아지고 낮아집니다.
- 그리고 RSI가 상승과 하락을 나타냅니다.
- 이 시기는 가격 상승과 하락의 시점입니다.
RSI 값이 threshold 이하인지 판단하기
- RSI 하위 지점을 정의하여 임계값을 결정합니다.
- 현재 RSI 값이 이 문이 되는 값보다 낮다면, 구매할 수 있습니다.
마감값이 시작 하락점보다 낮은지 판단하기
- 만약 그렇다면, 구매 신호에서 벗어나는 것을 추가로 확인합니다.
정지 조건 정의
- 스톱 손실 비율을 설정 (예전에 설정된 5%)
- 이 비율을 다면 손실로 탈퇴합니다.
이윤 탈퇴 조건을 정의합니다.
- RSI 고점을 설정하여 임계값을 결정합니다 (기본 75).
- RSI 상승이 이 문턱에 도달하면 이윤은 퇴출됩니다.
우위 분석
RSI 지표를 사용하여 다중의 반향을 판단하여 가격의 단기 반동 시기를 효과적으로 잡을 수 있습니다.
RSI 낮은 점 판단과 함께, 부진 전에 특정 구매 지점을 결정할 수 있습니다.
거래의 위험과 수익을 관리할 수 있는 중지 및 중지 조건을 설정합니다.
이 전략은 많은 비트코인 실물 거래에서 RSI 지표의 특성을 참고하여 비트코인 단거리 거래에 적합합니다.
전략 매개 변수 설정이 합리적이고, 다양한 시장 상황에 적응할 수 있으며, 실 디스크 적용에 유리하다
위험 분석
RSI 지표의 실효성이 존재할 수 있으며, 잘못된 판단으로 거래 손실이 발생할 수 있습니다.
단일 기술 지표는 잘못된 신호를 유발할 수 있으며 다른 지표와 함께 사용해야합니다.
적절한 변수값을 선택해야 합니다. 잘못 설정하면 전략 수익률에 영향을 미칠 수 있습니다.
다방향 거래는 대대적인 추세에 주의를 기울이고 역동적인 거래를 피해야 합니다.
거래비용에 주의를 기울여야 합니다. 거래가 너무 많으면 최종 수익에 영향을 미칠 수 있습니다.
최적화 매개 변수를 주기적으로 재검토하고 다양한 시장에 따라 전략을 조정해야 합니다.
최적화 방향
이동 평균 등 다른 지표를 추가하여 필터링 조건을 설정하여 가짜 신호를 줄이는 것을 고려할 수 있습니다.
다양한 주기의 파라미터 설정을 테스트하여 최적의 파라미터 조합을 찾을 수 있습니다.
더 큰 수준의 추세 판단을 결합하여 추세가 역전될 때 더 많은 것을 피할 수 있습니다.
다이내믹 스톱로스를 설정할 수 있습니다. 이윤이 일정 수준에 도달하면 스톱로스를 단계적으로 올릴 수 있습니다.
포지션에 따라 다른 Stop Loss을 설정할 수 있습니다.
기계 학습과 같은 기술을 도입하여 매개 변수를 자동으로 최적화 할 수 있습니다.
요약하다
이 전략은 RSI 지표의 다중 헤드 이탈을 포착하여 비트코인이 단기간에 반발 상승 가능성이 있다고 판단하여 구매 시기를 결정한다. 이 전략은 간단하고 효과적이며, 많은 실장 경험을 참고하여, 비트코인 단선을 많이하는 데 적합하다. 그러나 단일 기술 지표는 가짜 신호를 발생시키는 경향이 있으며, 다른 지표와 함께 사용해야하며, 변수 최적화, 스톱 손실 설정, 거래 비용 등의 문제에 주의를 기울여야 한다. 적절하게 사용되면 이 전략은 실장에서 많은 이익을 얻을 수 있다.
/*backtest
start: 2023-11-02 00:00:00
end: 2023-11-09 00:00:00
period: 1m
basePeriod: 1m
exchanges: [{"eid":"Futures_Binance","currency":"BTC_USDT"}]
*/

//@version=5
strategy("Bullish Divergence Short-term Long Trade Finder", overlay=false)

max_range = 50
min_range = 5
///pivot_left = 25
pivot_right = 5

//Inputs
src = input(close, title="Source")
rsiBearCondMin = input.int(50, title="RSI Bearish Condition Minimum")
rsiBearCondSellMin = input.int(60, title="RSI Bearish Condition Sell Min")
rsiBullCondMin = input.int(40, title="RSI Bull Condition Minimum")
pivot_left = input.int(25, title="Look Back this many candles")
SellWhenRSI = input.int(75, title="RSI Sell Value")
StopLossPercent = input.int(5, title="Stop loss Percentage")
rsiPeriod = input.int(14, title="RSI Length")
rsiOversold = input.int(30, title="RSI Oversold Level")
rsiOverbought = input.int(70, title="RSI Overbought Level")

//RSI Function/ value
rsi_value = ta.rsi(src, rsiPeriod)
rsi_hour = request.security(syminfo.tickerid,'60',rsi_value)
rsi_4hour = request.security(syminfo.tickerid,'240',rsi_value)
rsi_Day = request.security(syminfo.tickerid,'D',rsi_value)
plot(rsi_value, title="RSI", linewidth = 2, color = color.black, display =display.all)
hline(50, linestyle = hline.style_dotted)
rsi_ob = hline(70, linestyle=hline.style_dotted)
rsi_os = hline(30, linestyle=hline.style_dotted)
fill(rsi_ob, rsi_os, color.white)
SL_percent = (100-StopLossPercent)/100

pivot_low_true = na(ta.pivotlow(rsi_value, pivot_left, pivot_right)) ? false : true

//create a function that returns truee/false
confirm_range(x) =>
    bars = ta.barssince(x == true) //counts the number of bars since thee last time condition was true
    min_range <= bars and bars <= max_range // makees sure bars is less than max_range(50) and greater than min_range(5)


// RSI higher check / low check
RSI_HL_check = rsi_value<rsiBullCondMin and rsi_value > ta.valuewhen(pivot_low_true and rsi_value<rsiBullCondMin, rsi_value,1) and confirm_range(pivot_low_true[1])

// price check for lower low
price_ll_check = low < ta.valuewhen(pivot_low_true, low, 1)

bullCond = price_ll_check and RSI_HL_check and pivot_low_true

//pivot_high_true = na(ta.pivothigh(rsi_value, pivot_left, pivot_right))  ? false : true
pivot_high_true = na(ta.pivothigh(rsi_value, pivot_left, pivot_right))   ? false : true

// RSI Lower check / high check ensuring that the RSI dips below 30 to start divergence
RSI_LH_check = rsi_value < ta.valuewhen(pivot_high_true and rsi_value>rsiBearCondMin, rsi_value,1) and confirm_range(pivot_high_true[1]) //and rsi_value[pivot_right] >= 65

// price check for lower low
price_hh_check = high > ta.valuewhen(pivot_high_true, high, 1)

bearCond = price_hh_check and RSI_LH_check and pivot_high_true and rsi_value[3] > rsiBearCondSellMin

plot(pivot_low_true ? rsi_value : na, offset=-5, linewidth=3, color=(bullCond ? color.green : color.new(color.white, 100)))

plotshape(bullCond ? rsi_value : na , text = "BUY", style =  shape.labelup, location = location.absolute, color = color.green, offset =0, textcolor = color.white )

plot(pivot_low_true ? rsi_value : na, offset=-5, linewidth=3, color=(bearCond ? color.red : color.new(color.white, 100)))

plotshape(bearCond ? rsi_value : na , text = "Sell", style =  shape.labelup, location = location.absolute, color = color.red, offset =0, textcolor = color.white )
//[bbUpperBand, bbMiddleBand, bbLowerBand] = ta.bb(src, bbPeriod, bbDev)

//Entry Condition
longCondition = false

//bullEntry = bullCond and RSI_HL_check and confirm_range(pivot_low_true[1])
if bullCond and close < ta.valuewhen(pivot_low_true, low, 1) and rsi_hour <40 ///and rsi_4hour<40 //and rsi_Day<50
    strategy.entry("Long", strategy.long)

//Exit Condition
if (strategy.position_size > 0 and close < strategy.position_avg_price*SL_percent)
    strategy.close("Long")
if (strategy.position_size > 0 and (rsi_value > SellWhenRSI or bearCond))
    strategy.close("Long")