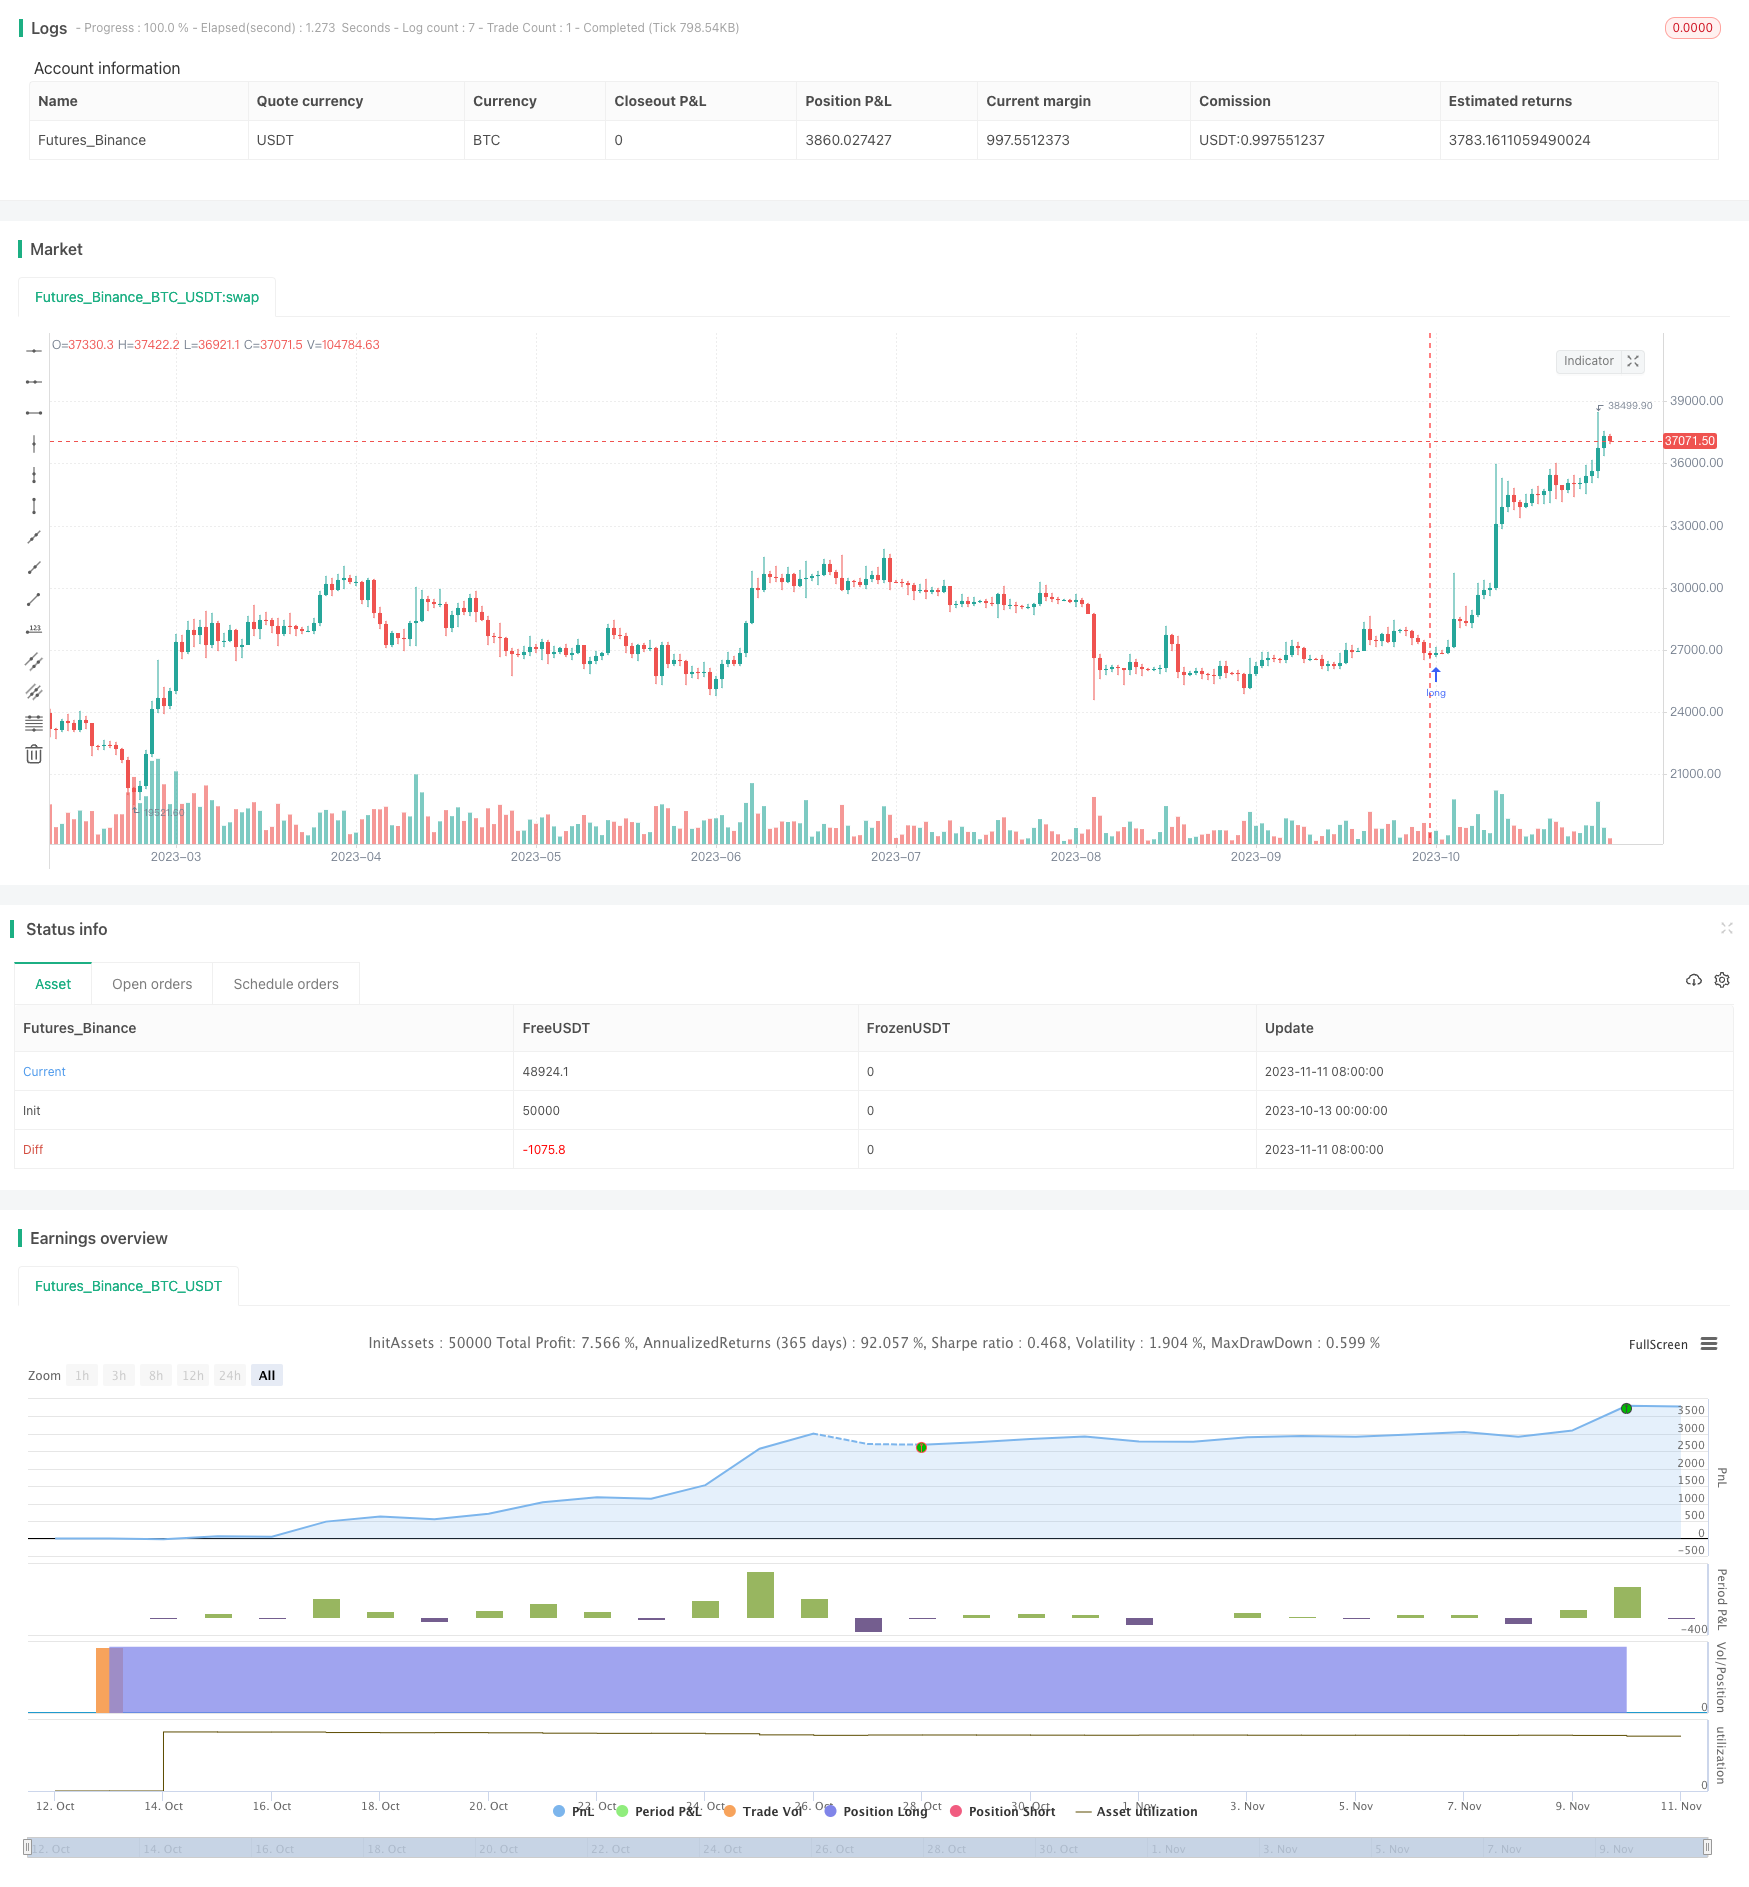
코팍 곡선 기반의 양적 거래 전략
저자:차오장, 날짜: 2023-11-13 11:44:55태그:

전반적인 설명
이 전략은 양적 거래를 구현하기 위해 덜 알려진 코팍 곡선 기술 지표를 활용합니다. 코팍 곡선은 S&P 500이나 SPY ETF와 같은 거래 동등한 시장 지수의 변화율 (ROC) 의 가중 이동 평균을 취함으로써 도출됩니다. 코팍 곡선이 0 이상으로 넘을 때 구매 신호가 생성되고 0 이하로 넘을 때 판매 신호가 생성됩니다. 수익을 잠금하기 위해 선택적 인 트레일링 스톱 로스가 제공됩니다. 전략은 $SPY 코팍 곡선을 대리자로 사용하여 다른 ETF 및 주식에서 거래 신호를 생성합니다.
원칙
이 전략은 코팍 곡선을 거래 신호를 생성하는 기술적 지표로 사용합니다. 코팍 곡선 공식은:
코팍 곡선 = 10주기 WMA (14주기 ROC + 11주기 ROC)
ROC 변화율은 다음과 같이 계산됩니다. (현재 종료 - N 기간 전 종료) / N 기간 전 종료
이 전략은 $SPY의 폐쇄 가격에 기초하여 코팍 곡선을 계산합니다. 곡선이 0을 넘을 때 구매 신호가 생성되고 0을 넘을 때 판매 신호가 생성됩니다.
장점
- 이동 평균과 같은 일반적인 지표보다 더 나은 예측 능력을 가진 독특한 Coppock 곡선 지표를 사용합니다
- WMA 기간, ROC 기간 등 최적화를 위한 구성 가능한 매개 변수
- 강력한 시장 대표성을 가진 신호 소스로 $SPY를 사용합니다.
- 선택적 인 후속 스톱 로스 (trailing stop loss) 를 통해 수익을 확보하고 마이너 다운을 줄이십시오.
위험성
- 코팍 곡선은 널리 사용되는 지표가 아니므로 효능은 검증이 필요합니다.
- 신호 지연이 있을 수 있습니다, 매개 변수를 최적화해야 합니다.
- 너무 넓은 스톱 손실은 회수 기회를 놓칠 수 있습니다.
- 단 하나의 지표에 의존하면 잘못된 신호가 발생할 수 있습니다.
최적화 방향
- 다양한 시장과 주식에서 최적의 매개 변수 조합을 테스트합니다.
- 부피 등 잘못된 신호를 필터링하기 위해 다른 지표와 결합
- 스톱 로스 비율의 동적 최적화
- 바 수나 가격 돌파구 같은 다른 입력 신호를 고려
결론
이 전략은 코팍 곡선의 독특한 곡선 모양 특성을 활용하여 거래 신호를 생성합니다. 일반적인 지표와 비교하면 코팍 곡선은 더 강력한 예측 능력을 가지고 있습니다. 그러나 독립적 인 지표로서 신뢰성은 검증이 필요합니다. 잘못된 신호를 필터하기 위해 다른 요소와 결합하는 것이 좋습니다. 매개 변수 최적화, 스톱 로스 최적화 및 다른 지표와 결합함으로써이 전략은 효과적인 양적 거래 시스템이 될 수 있습니다.
/*backtest
start: 2023-10-13 00:00:00
end: 2023-11-12 00:00:00
period: 1d
basePeriod: 1h
exchanges: [{"eid":"Futures_Binance","currency":"BTC_USDT"}]
*/

// This source code is subject to the terms of the Mozilla Public License 2.0 at https://mozilla.org/MPL/2.0/
// © RolandoSantos

//@version=4
strategy(title = "Coppock Curve", shorttitle = "Copp Curve Strat", default_qty_type=strategy.cash, default_qty_value=10000, initial_capital=10000)

///trail stop
longTrailPerc = input(title="Trail Long Loss (%)", minval=0.0, step=0.1, defval=100) * 0.01

// Determine trail stop loss prices
longStopPrice = 0.0

longStopPrice := if (strategy.position_size > 0)
    stopValue = close * (1 - longTrailPerc)
    max(stopValue, longStopPrice[1])
else
    0
//Use SPY for Copp Curve entries and exits//
security = input("SPY")
ticker = security(security, "D", close)

///Copp Curve////
wmaLength = input(title="WMA Length", type=input.integer, defval=10)
longRoCLength = input(title="Long RoC Length", type=input.integer, defval=14)
shortRoCLength = input(title="Short RoC Length", type=input.integer, defval=11)
source = ticker
curve = wma(roc(source, longRoCLength) + roc(source, shortRoCLength), wmaLength)

///Lower Band Plot///
band1 = hline(0)
band0 = hline(100)
band2 = hline(-100)
fill(band1, band0, color=color.green, transp=90)
fill(band2, band1, color=color.red, transp=90)
plot(curve, color=color.white)

///Trade Conditions///
Bull = curve > 0
Bear = curve < 0

///Entries and Exits//
if (Bull)
    strategy.entry("Long", strategy.long, comment = "LE")


if (Bear)
    strategy.close("Long", qty_percent=100, comment="close")

// Submit exit orders for trail stop loss price
if (strategy.position_size > 0)
    strategy.exit(id="Long Trail Stop", stop=longStopPrice)
더 많은
- 볼링거 밴드 범위 거래 전략과 함께 EMA 비율 채널
- 이중 EMA 크로스오버 전략
- 점진적 스톱 로스 움직임 전략
- 변동성 중지와 함께 모멘텀 브레이크 전략
- 극한 분배 스윙 전략
- 다중 지표 크로스오버 강한 트렌드 추적 전략
- 가격 파업과 평균 역전 (mean reversal) 에 기초한 모멘텀 브레이크업 거래 전략
- 동력 가격 트렌드 추적 전략
- 프랙탈파와 SMMA를 기반으로 한 FX 전략
- 이동 평균 크로스 오버 및 상부 철도 돌파구 추진 전략
- 압력 균형에 기반한 높은 확률의 돌파구 거래 전략
- 급속한 RSI 리스크 제어 복합 선물 거래 전략
- 이중 DI 크로스오버 일일 거래 전략
- 볼링거 밴드 브레이크업 전략
- 이동 평균 거래 전략
- 윌리엄스의 악어 전략
- 이중 이동 평균 크로스오버 전략
- 장기적 역행 전략
- 이중 이동 평균 크로스오버 지속 상승 추세 전략
- 종합 자동화 거래 이동 평균 무지개 전략