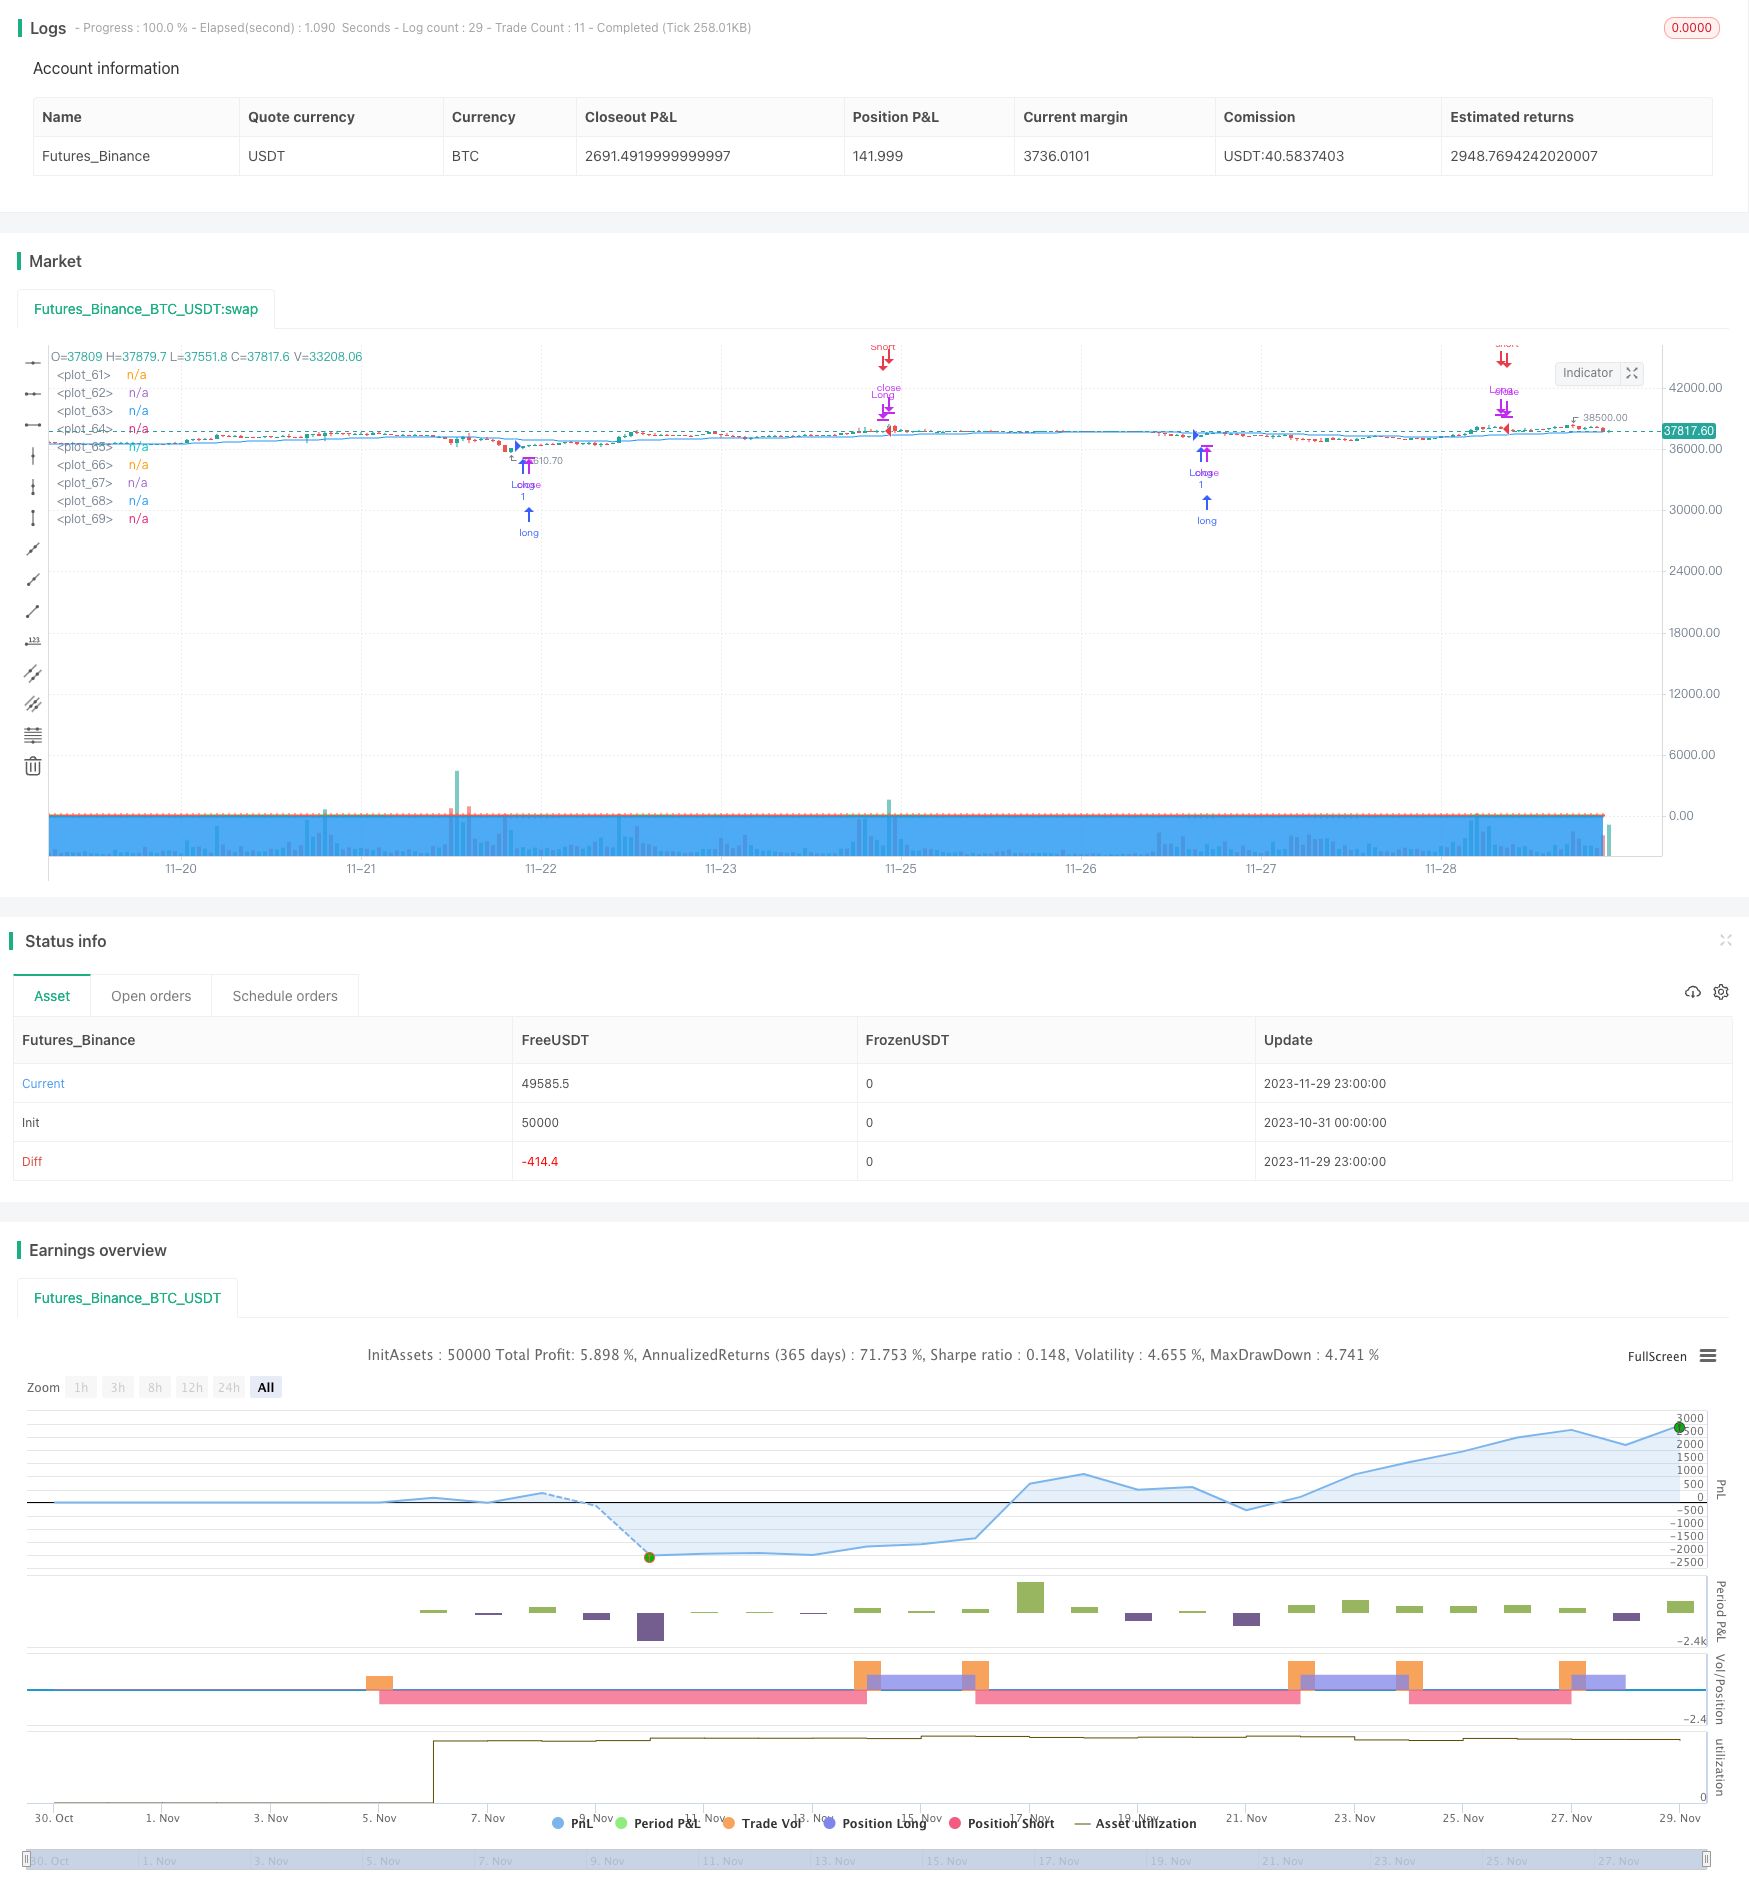
다중 취업 이익 및 손실 중지 물결전략을 따르는 트렌드
저자:차오장, 날짜: 2023-12-01 18:09:12태그:

전반적인 설명
이 전략은 라지 베어 (LazyBear) 의 원래 웨이브 트렌드 전략에 기반을 두고 있으며, 2차 스톱 로스, 복수 트레이프 레벨 및 높은 시간 프레임 EMA 필터와 같은 추가 기능이 있습니다. 거래 후 트렌드를 자동화하기 위해 EMA 필터와 스톱 로스/트레이프 관리와 결합한 웨이브 트렌드 지표를 사용하여 거래 신호를 생성합니다.
전략 논리
이 전략의 핵심 지표는 세 가지 구성 요소로 구성된 WaveTrend입니다.
-
AP: 평균 가격 = (최고 + 최저 + 닫음) / 3
-
ESA: AP의 n-period EMA
-
CI: (AP - ESA) / (0.015 * n-period EMA의 절대 값 (AP - ESA))
-
TCI: CI의 n-period EMA, 또한 WaveTrend Line 1 (WT1) 라고도 불립니다.
-
WT2: WT1의 4주기 SMA
WT1이 WT2 (황금 십자가) 를 넘어서면 긴 포지션이 열리고, WT1이 WT2 (죽음 십자가) 를 넘어서면 긴 포지션이 닫힌다.
또한, 잘못된 신호를 피하기 위해 높은 시간 프레임 EMA 필터가 구현되어 있으며, 따라서 가격이 EMA 위에 있고 짧은 거래가 EMA 아래에 있을 때만 긴 거래가 수행됩니다.
장점
-
수동 판단 없이 WaveTrend를 사용하여 트렌드를 자동으로 추적합니다
-
2차 스톱 손실은 단일 거래 손실을 효과적으로 제한합니다.
-
여러 가지 취득 레벨은 수익 포획을 극대화합니다.
-
EMA 필터는 잘못된 신호를 피함으로써 승률을 향상시킵니다.
위험 과 개선
-
트렌드 반전을 감지하지 못하면 손실이 발생할 수 있습니다.
-
매개 변수 조정이 안 되면 거래가 과다해집니다.
-
다양한 매개 변수 세트가 최적화를 위해 테스트 될 수 있습니다
-
반전 감지에 대한 추가 지표를 고려하십시오.
결론
이 전략은 웨이브트렌드 (WaveTrend) 의 자동 트렌드 검출, EMA 필터 (EMA) 를 통해 트렌드 추적, 위험 통제 및 수익 극대화를 포괄적으로 통합하고 있으며, 효율성을 향상시키고 트렌드 거래와 위험 통제를 균형 잡기 위해 스톱 로스/트랙 이윤 관리를 제공합니다. 효율적이고 안정적인 트렌드 추적 시스템입니다. 추가 매개 변수 최적화 및 역전 메커니즘은 전략의 적용 가능성을 향상시킬 수 있습니다.
/*backtest
start: 2023-10-31 00:00:00
end: 2023-11-30 00:00:00
period: 1h
basePeriod: 15m
exchanges: [{"eid":"Futures_Binance","currency":"BTC_USDT"}]
*/

// This source code is subject to the terms of the Mozilla Public License 2.0 at https://mozilla.org/MPL/2.0/
// © undacovacobra

//@version=4
strategy("WaveTrend Strategy [LazyBear] with Secondary Stop Loss", overlay=true)

// Input parameters
n1 = input(10, "Channel Length")
n2 = input(21, "Average Length")
obLevel1 = input(60, "Over Bought Level 1")
obLevel2 = input(53, "Over Bought Level 2")
osLevel1 = input(-60, "Over Sold Level 1")
osLevel2 = input(-53, "Over Sold Level 2")
useEmaFilter = input(false, "Use EMA Filter")
emaLength = input(50, "EMA Length")
emaTimeFrame = input("60", "EMA Time Frame")
tradeMode = input("Both", "Trade Mode", options=["Long Only", "Short Only", "Both"])
useSecondarySL = input(false, "Use Secondary Stop Loss")
slPercentage = input(5.0, "Stop Loss Percentage (%)")

// WaveTrend Indicator Calculations
ap = hlc3
esa = ema(ap, n1)
d = ema(abs(ap - esa), n1)
ci = (ap - esa) / (0.015 * d)
tci = ema(ci, n2)
wt1 = tci
wt2 = sma(wt1, 4)

// EMA Calculation with Selected Time Frame
getEma(timeFrame) =>
    security(syminfo.tickerid, timeFrame, ema(close, emaLength))

emaFilter = getEma(emaTimeFrame)

// Secondary Stop Loss Calculation
longStopPrice = strategy.position_avg_price * (1 - slPercentage / 100)
shortStopPrice = strategy.position_avg_price * (1 + slPercentage / 100)

// Long Entry and Exit Conditions with EMA Filter and Trade Mode
longEntry = crossover(wt1, wt2) and wt2 < osLevel1 and (not useEmaFilter or close > emaFilter) and (tradeMode == "Long Only" or tradeMode == "Both")
if (longEntry)
    strategy.entry("Long", strategy.long)
longExit = crossunder(wt1, wt2) and wt2 > obLevel1
if (longExit)
    strategy.close("Long")
if (useSecondarySL and strategy.position_size > 0 and low < longStopPrice)
    strategy.close("Long", comment="SL Hit")

// Short Entry and Exit Conditions with EMA Filter and Trade Mode
shortEntry = crossunder(wt1, wt2) and wt2 > obLevel1 and (not useEmaFilter or close < emaFilter) and (tradeMode == "Short Only" or tradeMode == "Both")
if (shortEntry)
    strategy.entry("Short", strategy.short)
shortExit = crossover(wt1, wt2) and wt2 < osLevel1
if (shortExit)
    strategy.close("Short")
if (useSecondarySL and strategy.position_size < 0 and high > shortStopPrice)
    strategy.close("Short", comment="SL Hit")

// Plotting
plot(0, color=color.gray)
plot(obLevel1, color=color.red)
plot(osLevel1, color=color.green)
plot(obLevel2, color=color.red, style=plot.style_cross)
plot(osLevel2, color=color.green, style=plot.style_cross)
plot(wt1, color=color.green)
plot(wt2, color=color.red, style=plot.style_cross)
plot(wt1-wt2, color=color.blue, style=plot.style_area, transp=80)
plot(emaFilter, color=color.blue)
- 비트코인 - MA 크로스오버 전략
- 피셔 변환 역 테스트 전략
- 123 역전 및 STARC 밴드 컴보 전략
- TFO 및 ATR 기반 트렌드 추적 중단 손실 전략
- 그레이트 델라이트 다중 요인 양적 전략
- 라인 전략을 따르세요
- 4배 지수적 이동 평균 거래 전략
- 모멘텀 기하급수적 이동 평균 크로스오버 거래 전략
- 이중 이동 평균 크로스오버 전략
- 동력 이중 이동 평균 거래 전략
- RSI와 STOCH RSI에 기반한 양방향 거래 전략
- 빠르고 느린 EMA 골든 크로스 돌파구 전략
- RSI와 이동 평균 조합 MT5 마틴게일 스칼핑 전략
- 변동성 중지 추적 전략
- 다중 지표로 오스실레이션 포지셔닝 돌파구 전략
- RSI 평균 회전 수량 거래 전략
- 이중 이동 평균 크로스오버 역전 전략
- 이동평균선 역차선 전략
- Hull MA 채널 및 선형 회귀 스윙 거래 전략
- 트리플 슈퍼트렌드 양적 거래 전략