概述
该策略是一种基于价格波动性的趋势跟踪止损策略。它利用平均真实波动幅度(ATR)来设置价格波动的止损线。ATR反映了价格的波动性和风险水平。当价格超过止损线时,该策略判断趋势发生转折,采取相应的打开头寸或止损的操作。
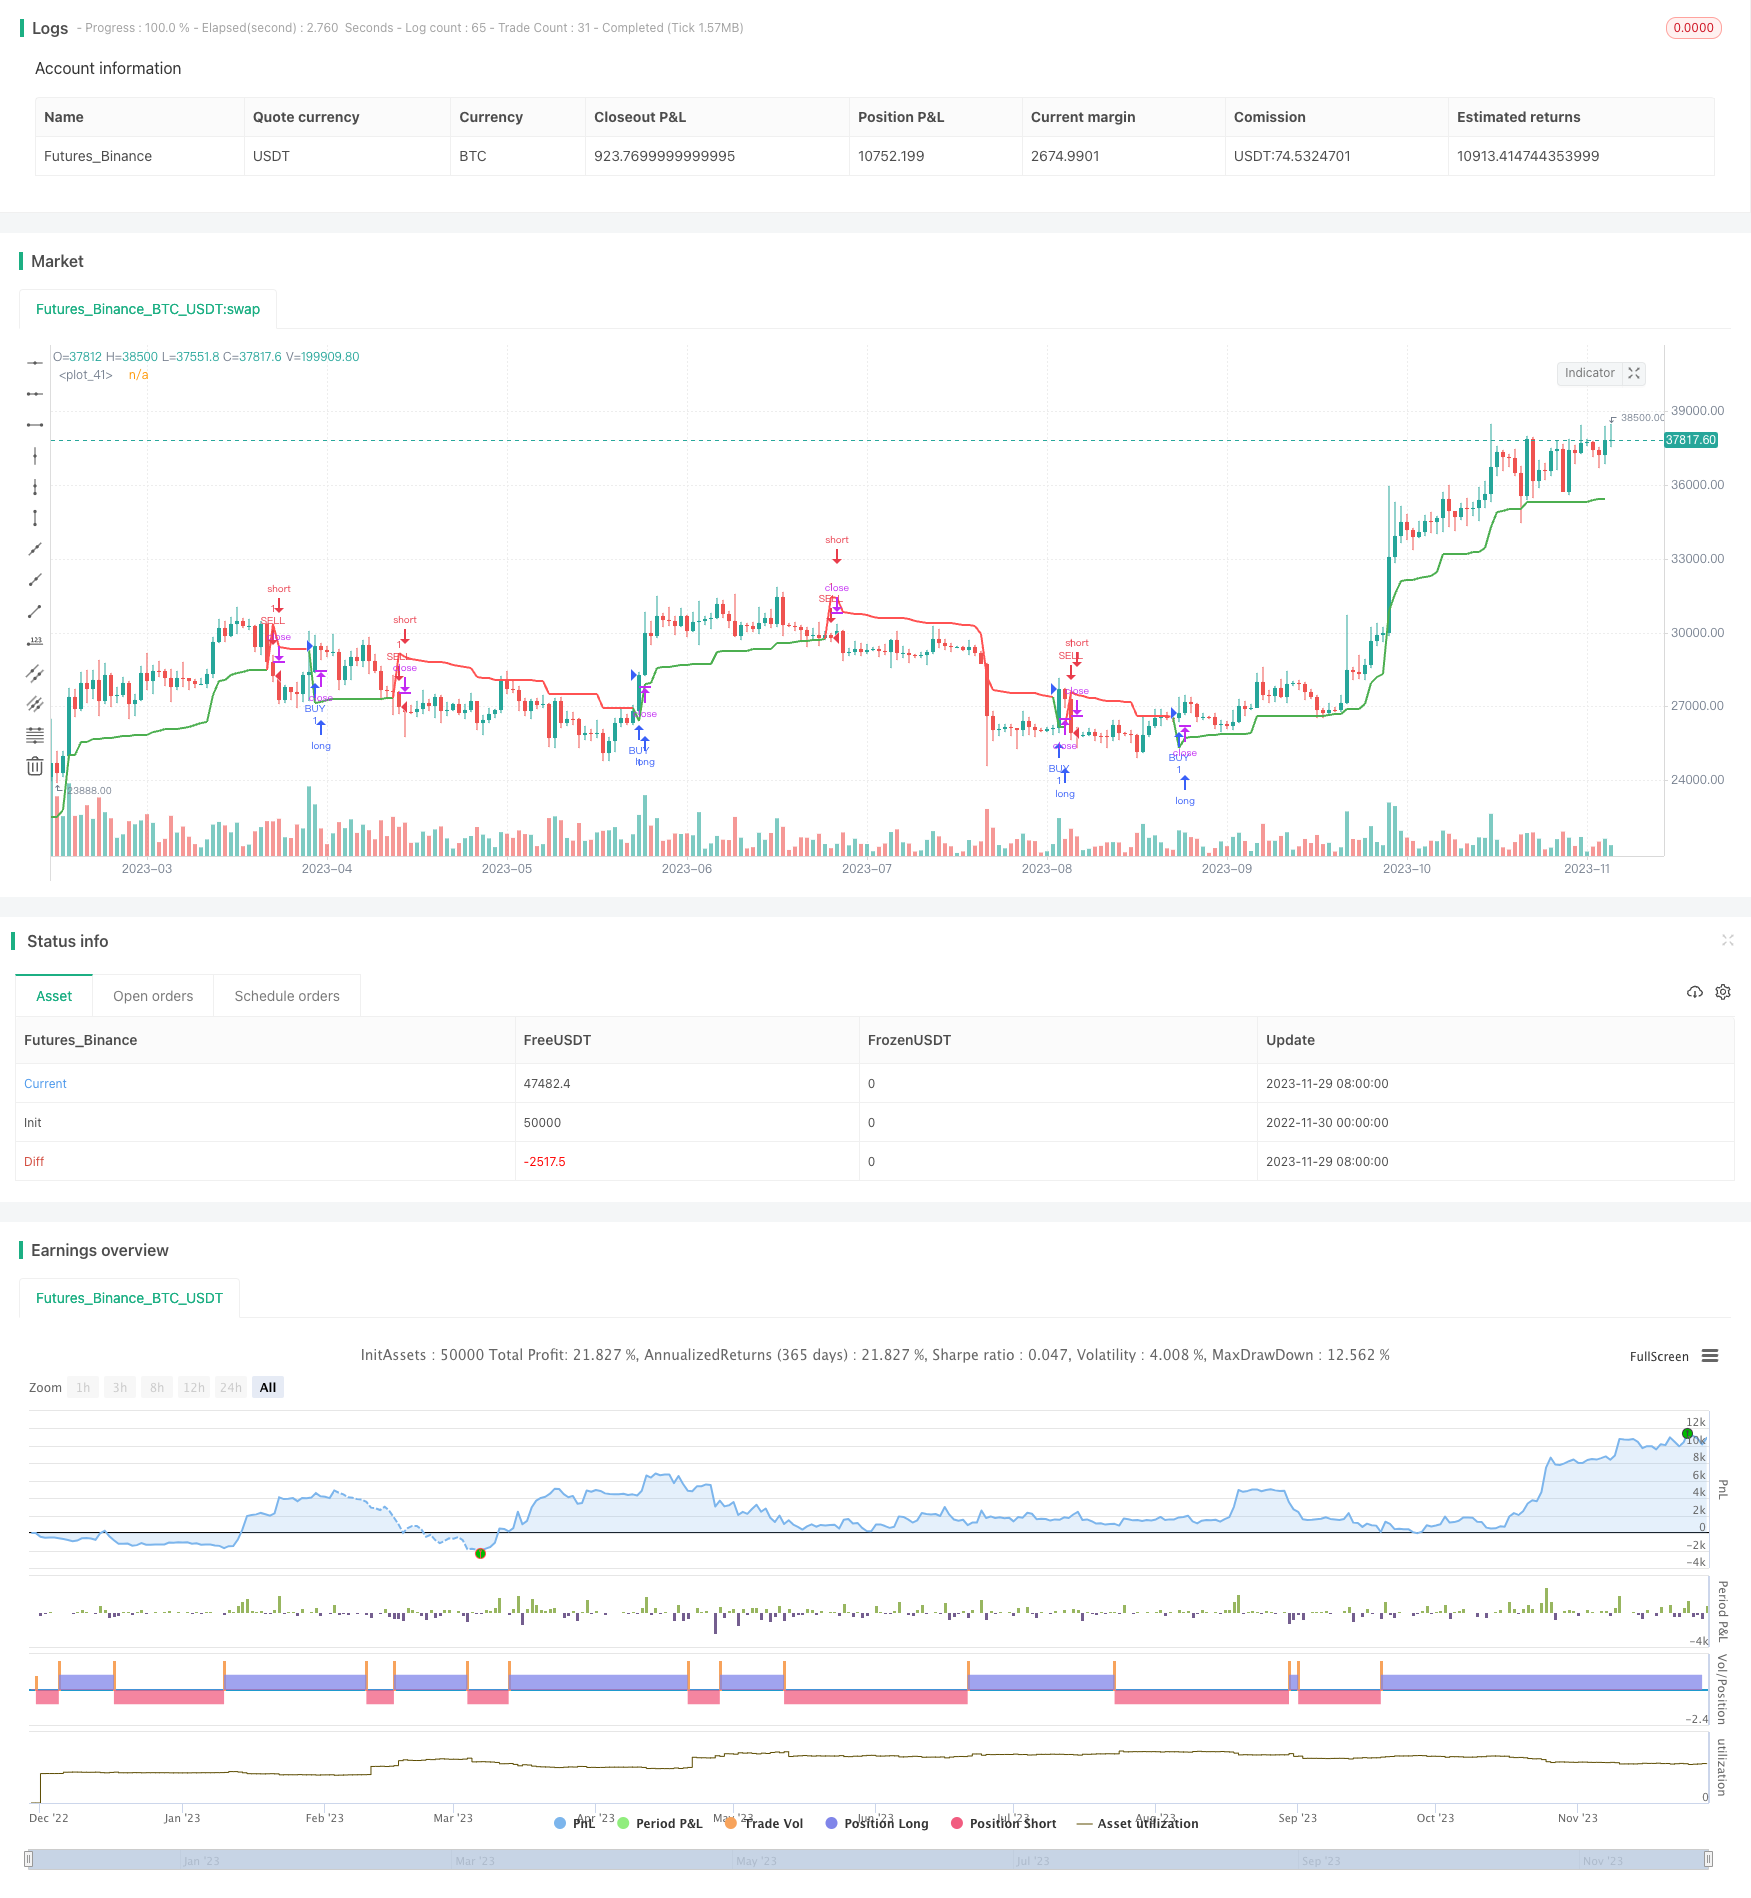
策略原理
该策略首先计算一定周期内的平均真实波动幅度ATR。然后根据目前的价格趋势方向,如果是上升趋势,则将止损线设置为当前最高价减去n倍的ATR;如果是下降趋势,则止损线为当前最低价加上n倍的ATR。其中n值可以通过参数调整,用于控制止损线与价格的距离。
当价格跌破上升趋势的止损线或涨破下降趋势的止损线时,判定趋势发生转变。这时策略清仓止损,并根据新的趋势方向设置新的止损线。
总的来说,该策略通过利用价格波动性来设置止损线,实现了精确判断趋势转变的能力。当趋势转变时及时止损,有助于策略把握新的趋势方向。
策略优势
- 利用价格波动性特征判断趋势,精确把握价格转折点
- 及时止损和切换仓位,减少行情反转的风险
- 参数调节灵活,可以控制止损线与价格波动的距离
- 可根据具体品种参数进行调优,具有较强的适应性
策略风险
- 无效突破带来的误判风险。价格可能出现无法持续的无效突破,导致误判趋势转变
- 参数设定过于激进可能加大亏损。例如n值过大时止损线过近,小震荡就可能触发
- urrencies等低波动率品种止损效果可能不佳。ATR值较小时止损线更靠近价格
策略优化
- 可以引入交易量或者波动加速等辅助指标,避免无效突破的误判
- 根据不同品种的特点调整n的值,使止损距离更合适
- ATR周期也可以进行优化,选择最合适判断价差波动率的周期参数
总结
该策略整体而言是一个较好的基于价格波动性设置止损线的算法实现。它判断价格走势的准确性较高,能够抓住趋势关键转折点。同时也提供了一定的参数空间进行调优,适应性较强。作为一种止损策略,它能够有效规避行情反转的风险,值得在实盘中应用。
策略源码
/*backtest
start: 2022-11-30 00:00:00
end: 2023-11-30 00:00:00
period: 1d
basePeriod: 1h
exchanges: [{"eid":"Futures_Binance","currency":"BTC_USDT"}]
*/

// This source code is subject to the terms of the Mozilla Public License 2.0 at https://mozilla.org/MPL/2.0/
// © laptevmaxim92

//@version=4
strategy("Volatility stop strategy", overlay=true)

length = input(20)
mult = input(2, step = 0.1)
utp = input(false, "Use take profit?")
pr = input(100, "Take profit pips")
usl = input(false, "Use stop loss?")
sl = input(100, "Stop loss pips")
fromday = input(01, defval=01, minval=01, maxval=31, title="From Day")
frommonth = input(01, defval=01, minval= 01, maxval=12, title="From Month")
fromyear = input(2000, minval=1900, maxval=2100, title="From Year")
today = input(31, defval=01, minval=01, maxval=31, title="To Day")
tomonth = input(12, defval=12, minval=01, maxval=12, title="To Month")
toyear = input(2039, minval=1900, maxval=2100, title="To Year")

use_date = (time > timestamp(fromyear, frommonth, fromday, 00, 00) and time < timestamp(toyear, tomonth, today, 00, 00))

atr_ = atr(length)
max_ = 0.0
min_ = 0.0
max1 = 0.0
max1 := max(nz(max_[1]), close)
min1 = 0.0
min1 := min(nz(min_[1]), close)
vstop = 0.0
is_uptrend = false
is_uptrend_prev = false
is_uptrend_prev := nz(is_uptrend[1], true)
stop = is_uptrend_prev ? max1 - mult * atr_ : min1 + mult * atr_
vstop_prev = nz(vstop[1])
vstop1 = is_uptrend_prev ? max(vstop_prev, stop) : min(vstop_prev, stop)
is_uptrend := close - vstop1 >= 0
is_trend_changed = is_uptrend != is_uptrend_prev
max_ := is_trend_changed ? close : max1
min_ := is_trend_changed ? close : min1
vstop := is_trend_changed ? is_uptrend ? max_ - mult * atr_ : min_ + mult * atr_ : vstop1
plot(vstop, color = is_uptrend ? color.green : color.red, linewidth=2)

longCondition = is_uptrend
if (longCondition and use_date)
    strategy.entry("BUY", strategy.long)

shortCondition = not is_uptrend
if (shortCondition and use_date)
    strategy.entry("SELL", strategy.short)

if (utp and not usl)
    strategy.exit("TP", "BUY", profit = pr)
    strategy.exit("TP", "SELL", profit = pr)

if (usl and not utp)
    strategy.exit("SL", "BUY", loss = sl)
    strategy.exit("SL", "SELL", loss = sl)

if (usl and utp)
    strategy.exit("TP/SL", "BUY", loss = sl, profit = pr)
    strategy.exit("TP/SL", "SELL", loss = sl, profit = pr)
更多内容