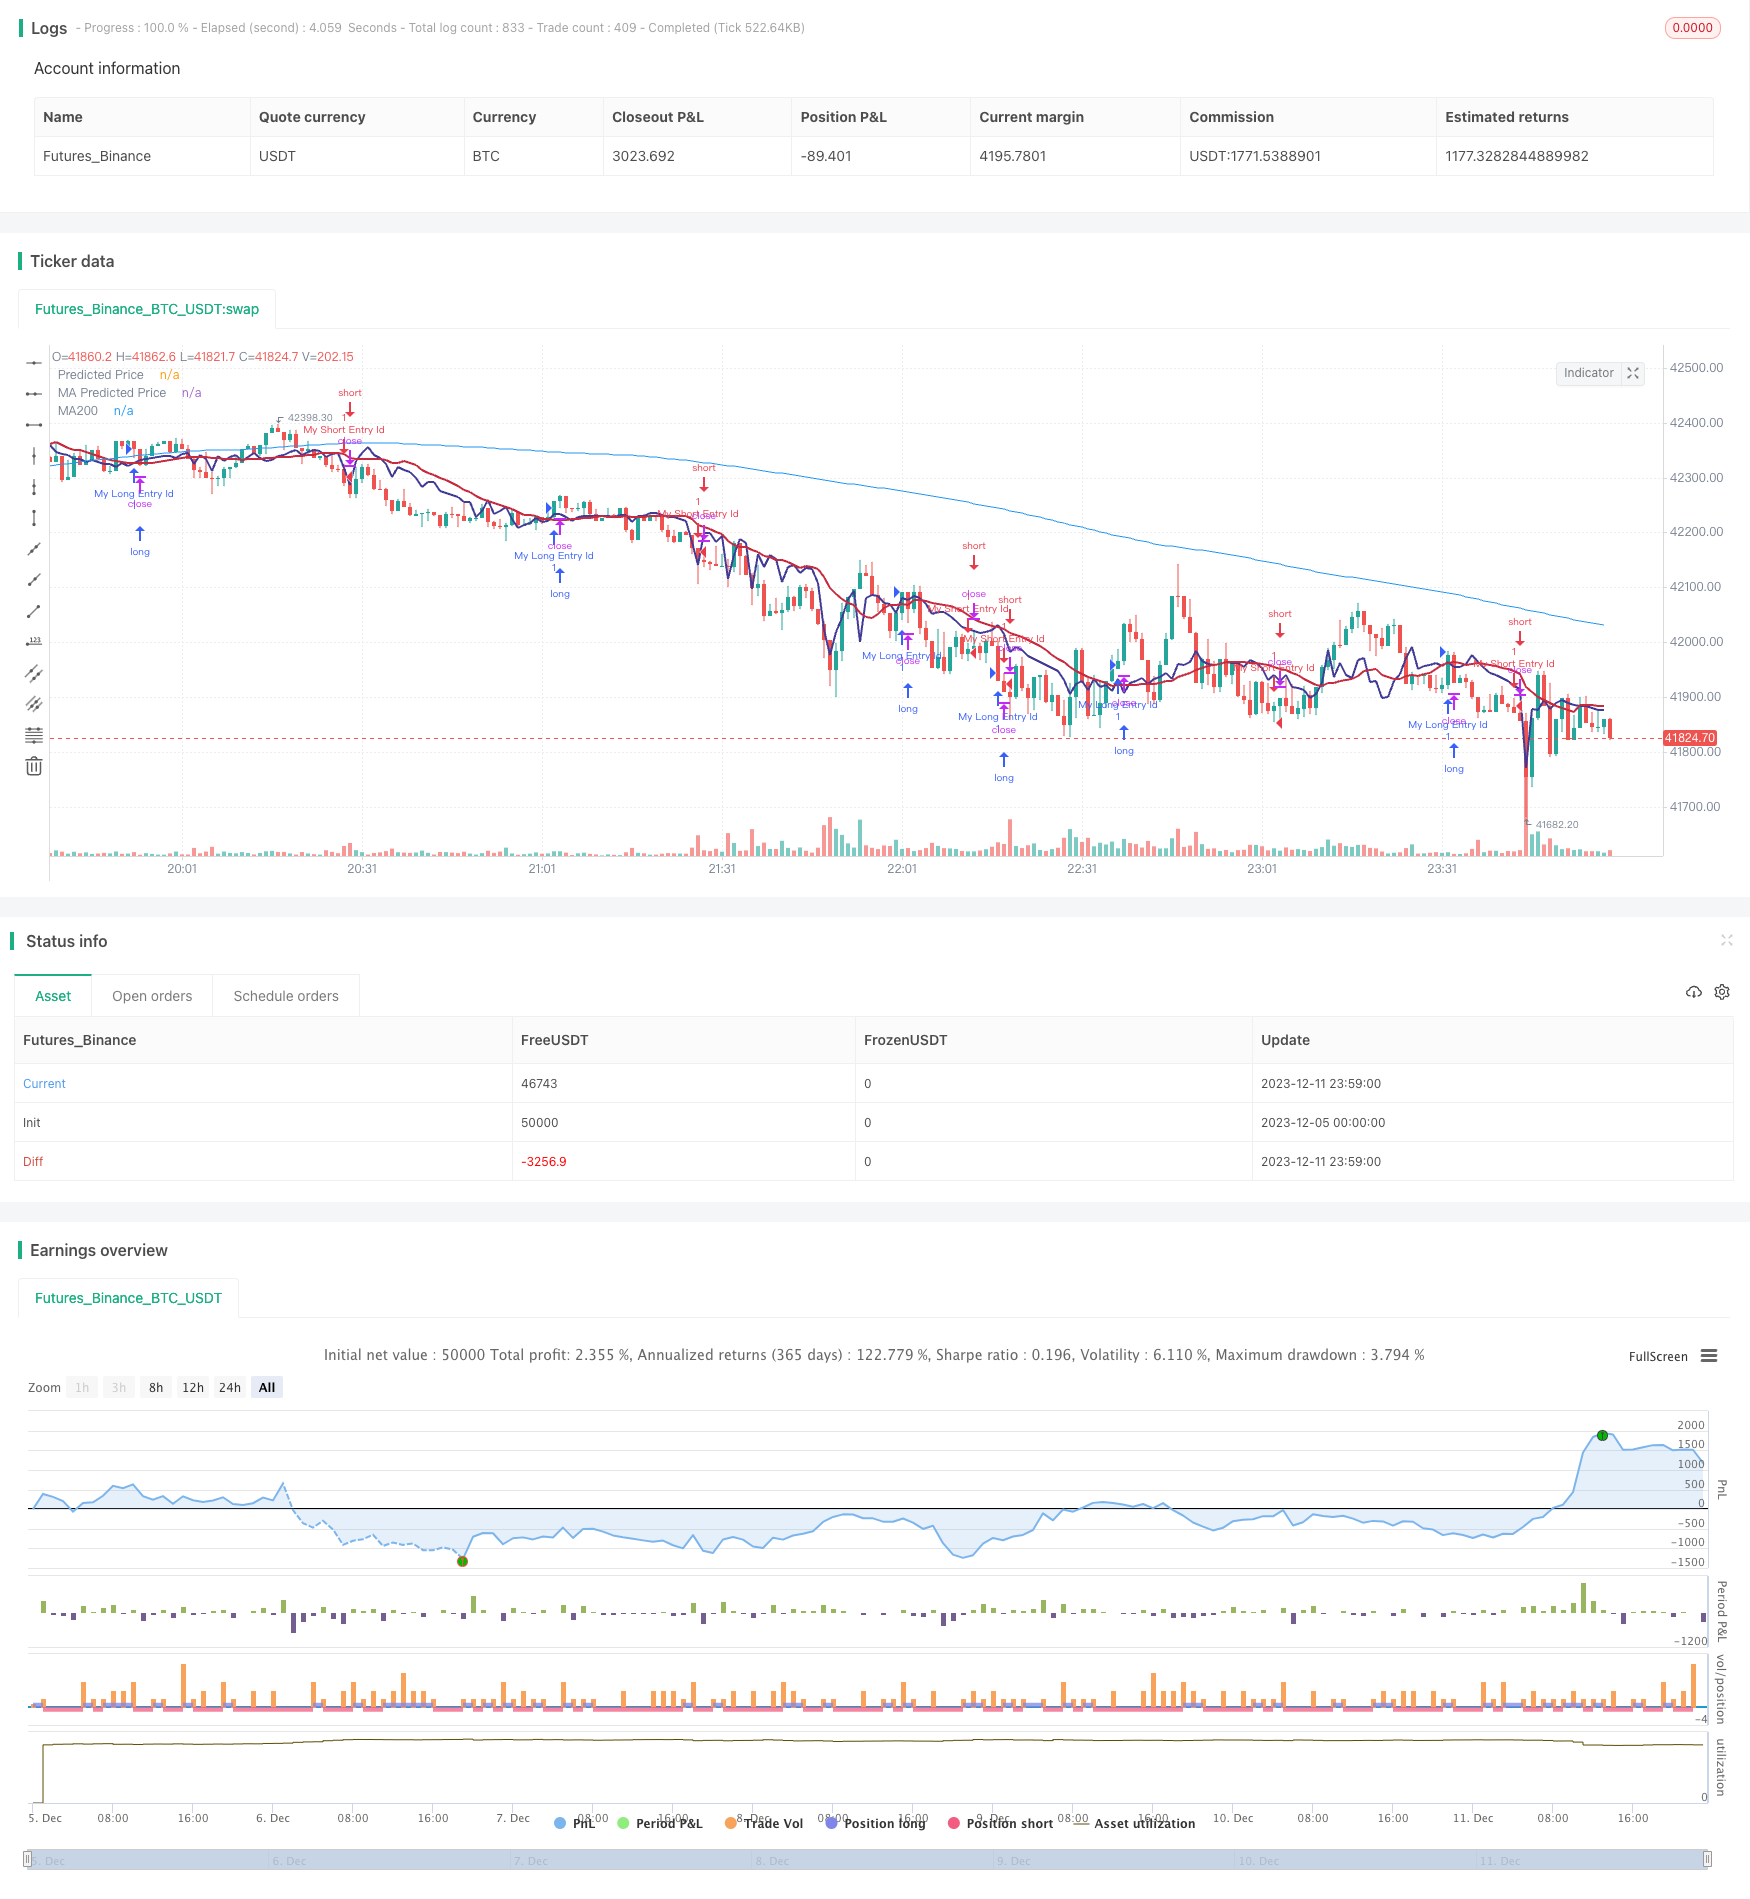
개요
동적 이데올로기 트렌드 반전 전략은 선형적 회귀를 이용한 가격 예측을 하고, 이동 평균이 형성되는 이데올로기와 결합하여 거래 신호를 생성한다. 예측된 가격이 아래에서 위로 이동 평균을 통과할 때 구매 신호를 생성한다. 예측된 가격이 위에서 아래로 이동 평균을 통과할 때 판매 신호를 생성하며, 트렌드 반전의 포착을 구현한다.
전략 원칙
- 거래량에 기초하여 주식 가격의 선형 회귀를 계산하여 가격의 예측값을 얻습니다.
- 다른 조건의 이동 평균을 계산합니다.
- 예측된 가격이 아래에서 위로 이동하는 평균을 통과하면 구매 신호가 생성됩니다.
- 예측된 가격이 상향에서 아래로 이동하는 평균을 통과하면 판매 신호가 발생합니다.
- MACD 지표와 함께 트렌드 반전의 시점을 판단하는 방법
위의 신호는 여러 종류의 확인을 결합하여 가짜 돌파구를 방지하여 신호의 정확도를 향상시킵니다.
우위 분석
- 선형 회귀를 사용하여 가격 동향을 예측하여 신호의 정확도를 향상시킵니다.
- 이동 평균과 함께 이데올로기를 형성하고, 트렌드 반향을 포착합니다.
- 거래량에 기반한 선형 회귀가 더 경제적으로 의미가 있습니다.
- MACD와 같은 지표와 결합하여 복수의 확인을 수행하여 거짓 신호를 줄입니다.
위험 분석
- 선형 회귀의 변수 설정은 결과에 큰 영향을 미칩니다.
- 이동 평균 설정도 신호 품질에 영향을 미칩니다.
- 확인 메커니즘에도 불구하고, 가짜 신호의 위험이 있습니다.
- 코드는 거래 횟수를 줄이고 수익률을 높이기 위해 더욱 최적화 할 수 있습니다.
최적화 방향
- 선형 회귀 및 이동 평균을 최적화하기 위한 변수
- 확인 조건을 추가하여 가짜 신호를 줄여줍니다.
- 더 많은 요소와 함께, 질의 역전 추세입니다.
- 단편 거래 위험을 줄이기 위해 손실을 막는 전략을 최적화하십시오
요약하다
동적 이데올로기 트렌드 반전 전략은 선형 회귀 예측과 이동 평균 형성을 통합한 이데올로기로 트렌드 반전의 시기를 포착한다. 단일 지표에 비해 높은 신뢰성을 가지고 있다. 동시에, 전략은 파라미터 조정과 확인 조건을 최적화하여 신호 품질과 수익 수준을 더욱 향상시킬 수 있다.
전략 소스 코드
/*backtest
start: 2023-12-05 00:00:00
end: 2023-12-12 00:00:00
period: 1m
basePeriod: 1m
exchanges: [{"eid":"Futures_Binance","currency":"BTC_USDT"}]
*/

// This source code is subject to the terms of the Mozilla Public License 2.0 at https://mozilla.org/MPL/2.0/
// © stocktechbot
//@version=5
strategy("Linear Cross", overlay=true, margin_long=100, margin_short=0)

//Linear Regression

vol = volume

// Function to calculate linear regression
linregs(y, x, len) =>
    ybar = math.sum(y, len)/len
    xbar = math.sum(x, len)/len
    b = math.sum((x - xbar)*(y - ybar),len)/math.sum((x - xbar)*(x - xbar),len)
    a = ybar - b*xbar
    [a, b]

// Historical stock price data
price = close

// Length of linear regression
len = input(defval = 21, title = 'Strategy Length')
linearlen=input(defval = 9, title = 'Linear Lookback')
[a, b] = linregs(price, vol, len)

// Calculate linear regression for stock price based on volume
//eps = request.earnings(syminfo.ticker, earnings.actual)
//MA For double confirmation

out = ta.sma(close, 200)
outf = ta.sma(close, 50)
outn = ta.sma(close, 90)
outt = ta.sma(close, 21)
outthree = ta.sma(close, 9)

// Predicted stock price based on volume
predicted_price = a + b*vol

// Check if predicted price is between open and close
is_between = open < predicted_price and predicted_price < close

//MACD
//[macdLine, signalLine, histLine] = ta.macd(close, 12, 26, 9)

// Plot predicted stock price
plot(predicted_price, color=color.rgb(65, 59, 150), linewidth=2, title="Predicted Price")
plot(ta.sma(predicted_price,linearlen), color=color.rgb(199, 43, 64), linewidth=2, title="MA Predicted Price")
//offset = input.int(title="Offset", defval=0, minval=-500, maxval=500)
plot(out, color=color.blue, title="MA200")
[macdLine, signalLine, histLine] = ta.macd(predicted_price, 12, 26, 9)

//BUY Signal

longCondition=false
mafentry =ta.sma(close, 50) > ta.sma(close, 90)
//matentry = ta.sma(close, 21) > ta.sma(close, 50)
matwohun = close > ta.sma(close, 200)
twohunraise = ta.rising(out, 2)
twentyrise = ta.rising(outt, 2)
macdrise = ta.rising(macdLine,2)
macdlong = ta.crossover(predicted_price, ta.wma(predicted_price,linearlen))  and (signalLine < macdLine)
if macdlong and macdrise
    longCondition := true

if (longCondition)
    strategy.entry("My Long Entry Id", strategy.long)
//Sell Signal
lastEntryPrice = strategy.opentrades.entry_price(strategy.opentrades - 1)
daysSinceEntry = len
daysSinceEntry := int((time - strategy.opentrades.entry_time(strategy.opentrades - 1)) / (24 * 60 * 60 * 1000))
percentageChange = (close - lastEntryPrice) / lastEntryPrice * 100
//trailChange = (ta.highest(close,daysSinceEntry) - close) / close * 100

//label.new(bar_index, high, color=color.black, textcolor=color.white,text=str.tostring(int(trailChange)))
shortCondition=false
mafexit =ta.sma(close, 50) < ta.sma(close, 90)
matexit = ta.sma(close, 21) < ta.sma(close, 50)
matwohund = close < ta.sma(close, 200)
twohunfall = ta.falling(out, 3)
twentyfall = ta.falling(outt, 2)
shortmafall = ta.falling(outthree, 1)
macdfall = ta.falling(macdLine,1)
macdsell = macdLine < signalLine
if macdfall and macdsell and (macdLine < signalLine) and ta.falling(low,2)
    shortCondition := true

if (shortCondition)
    strategy.entry("My Short Entry Id", strategy.short)