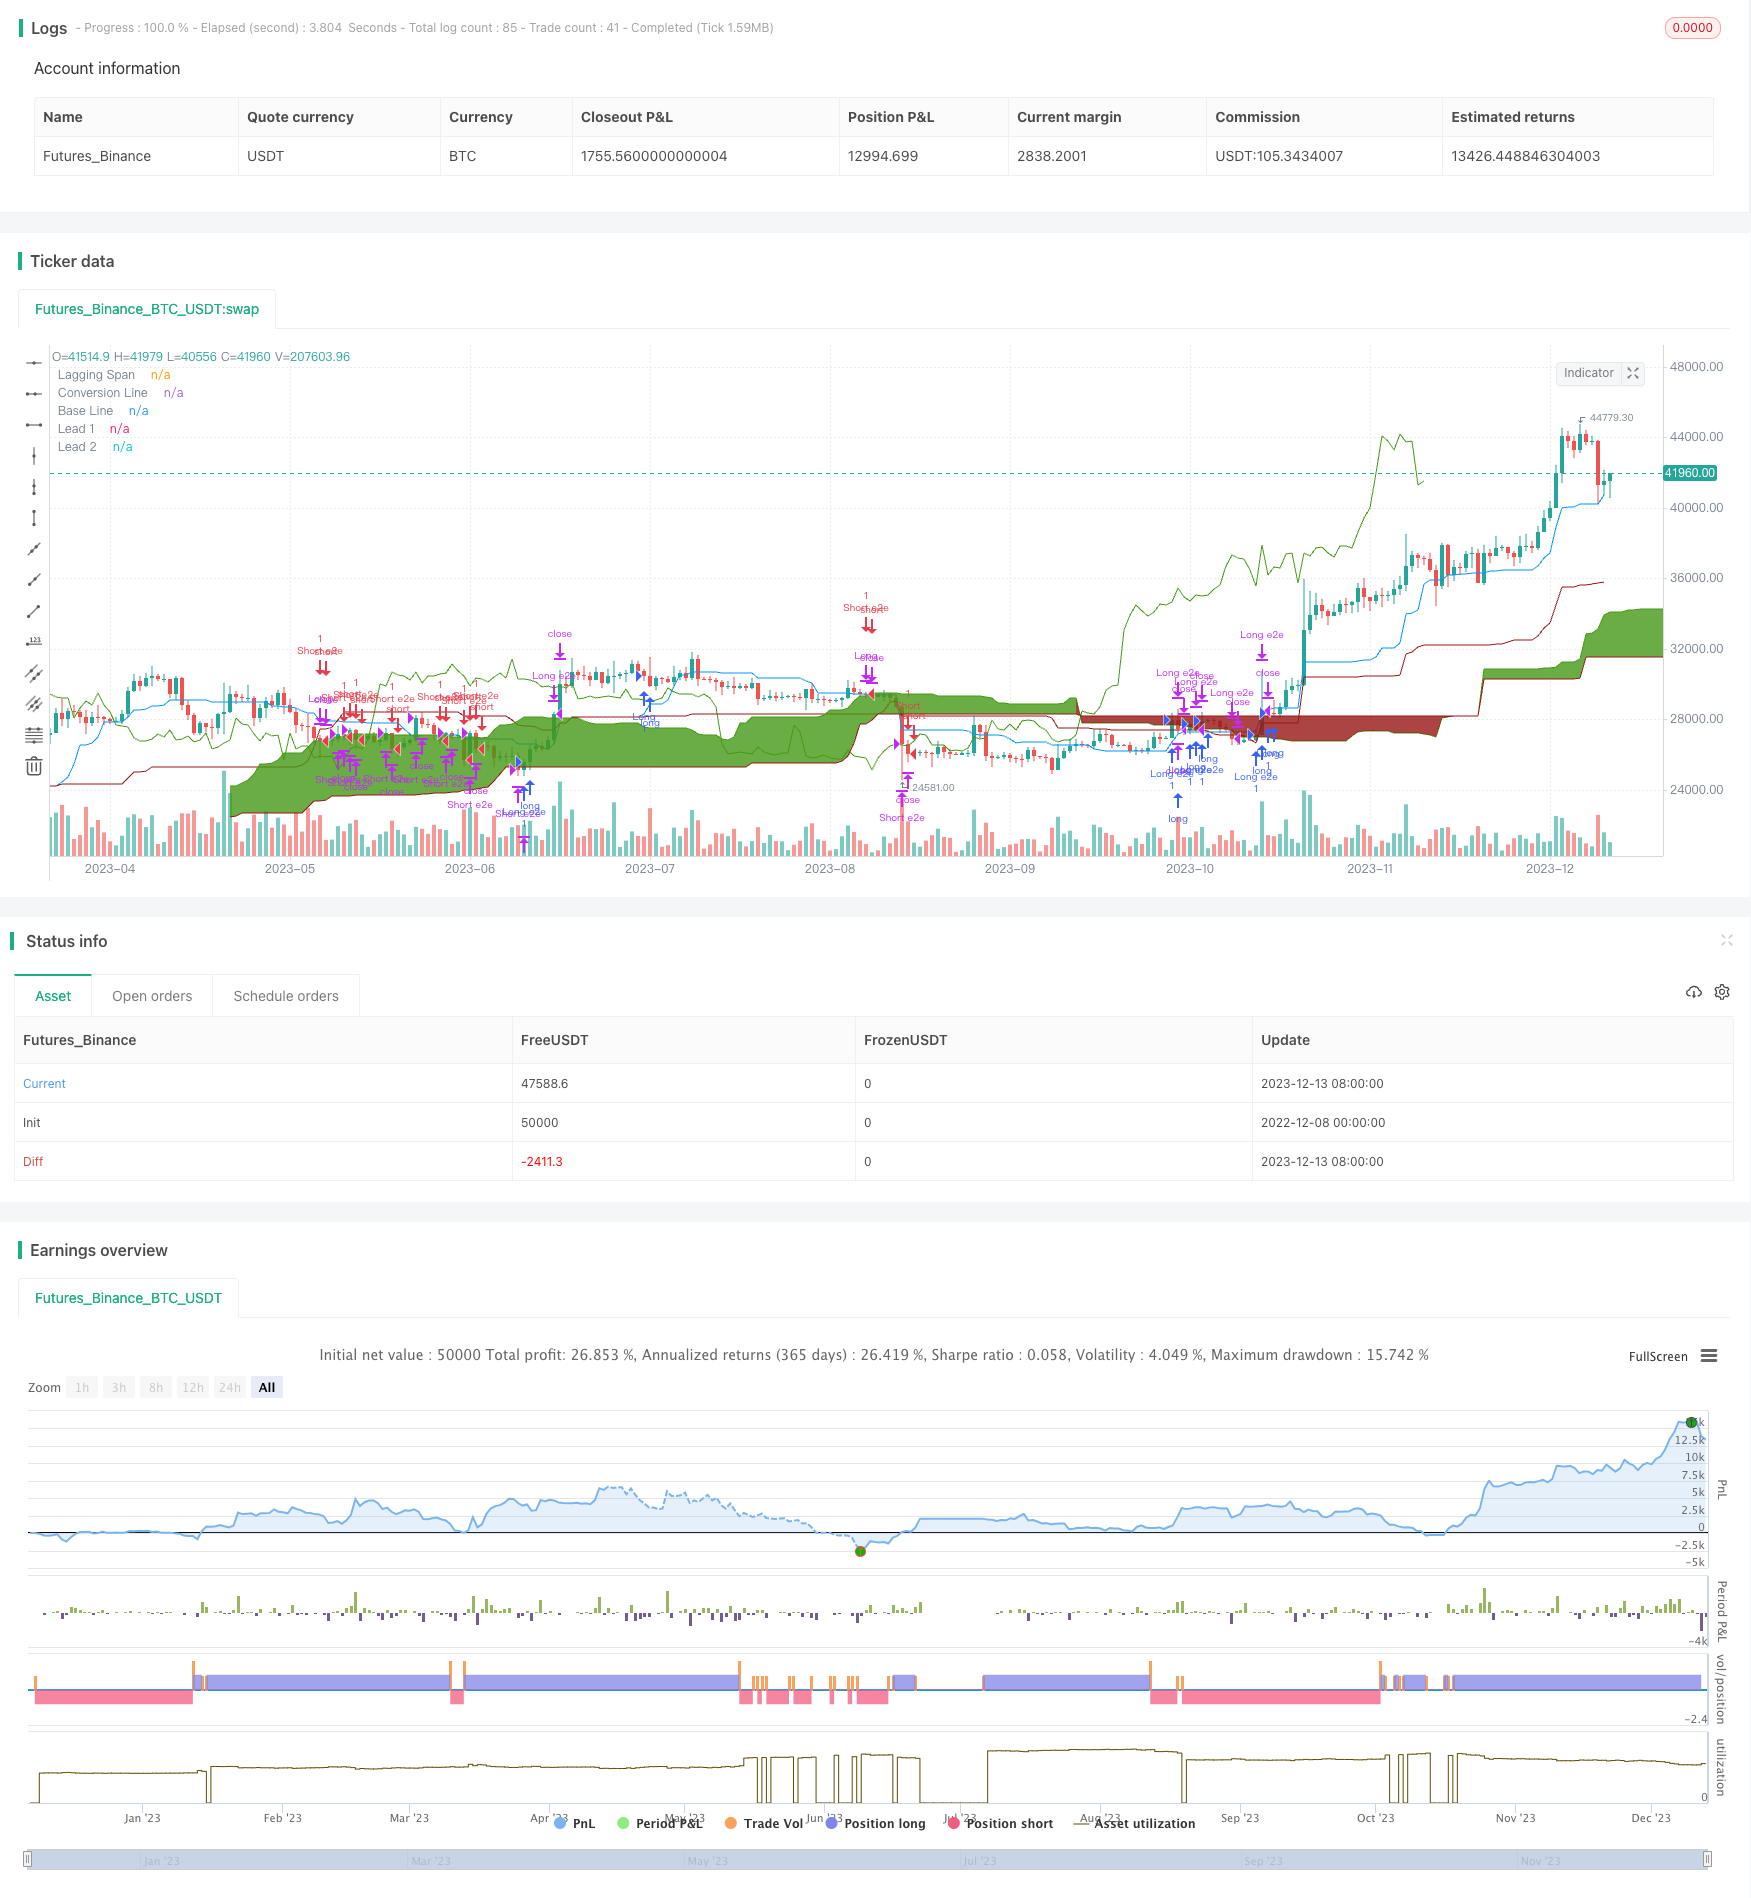
일일 평균 거래 전략에서 가격 오차
저자:차오장, 날짜: 2023-12-15 15:44:18태그:

전반적인 설명
이 거래 전략은 이치모쿠 킨코 히오 (Ichimoku Kinko Hyo) 라는 지표에 기반하여 거래 신호를 생성합니다. 이치모쿠 킨코 히오 (Ichimoku Kinko Hyo) 는 문자 그대로
이 전략은 트렌드 방향과 강도를 결정하기 위해 이치모쿠의 컴포넌트 라인을 이용한다. 거래 신호는 가격이 클라우드의 상단이나 하단으로 넘어갈 때 생성된다. 또한 이 전략은 이치모쿠 시스템에 고유한
전략 논리
이 전략은 이치모쿠 킨코 히오 시스템에서 다섯 줄을 사용한다:
- 텐칸 라인: 최고 최고와 최저 최저의 9주기 평균
- 키
라인: 최대 최고와 최저 최저의 26주기 평균 - 센쿠 스판 A: 텐칸 선과 키준 선의 평균
- 센쿠 스판 B: 최고 최고와 최저 최저 52주기 평균
- 치코우 라인: 26주기 지연 이동 평균
클라우드는 현재 트렌드 범위를 나타내는 센코 스판 A와 센코 스판 B 사이의 영역입니다.
거래 신호는 다음과 같은 시나리오를 기반으로 생성됩니다.
- 클라우드 위쪽의 가격 파업: 긴 신호
- 가격 파업 아래로 구름의 바닥: 짧은 신호
- 아래로부터 클라우드에 들어가는 가격: 긴 엣지-투-엣지 기회
- 위로부터 클라우드에 들어가는 가격: 단편적인 엣지에서 엣지 기회
또한 이 전략은 텐칸/키
장점
이 전략의 가장 큰 강점은 이치모쿠의 트렌드 방향과 지원/저항 수준을 결정하는 능력에 있습니다.
- 클라우드는 주요 트렌드 방향을 파악하고 트렌드에 반대하는 거래를 피합니다.
- 구성 라인은 브레이크아웃 기회를 찾기 위해 지원/ 저항 수준을 감지합니다.
- 가장자리까지의 진입은 더 많은 수익 잠재력을 제공합니다.
또한 이 전략은 부분적인 이익 취득과 위험 통제를 위해 텐칸/키준을 통합합니다.
위험 및 관리
주요 위험은 이치모쿠 선의 틈으로 인해 가짜 파업이 발생할 수 있기 때문입니다.
해결책은 아래 라인 간격을 좁히기 위해 매개 변수를 최적화하거나 범위 영역에서 거래를 피하기 위해 필터를 추가하는 것을 포함합니다.
최적화
전략의 몇 가지 측면은 개선될 수 있습니다.
-
이치모쿠 매개 변수를 최적화하고 이동 평균 기간을 더 많은 기호와 시간 프레임에 맞게 조정합니다.
-
부피 확인을 포함하여 잘못된 신호를 유발하는 공백을 피합니다.
-
MACD, 추가 트렌드 및 오시레이터 필터에 대한 RSI와 같은 다른 지표를 추가하십시오.
-
스톱 로스 및 이익 취득 규칙을 강화합니다. 예를 들어, 트레일링 스톱, 포지션 사이징 등.
요약
요약하자면, 이 이치모쿠 시스템은 클라우드와 컴포넌트 라인을 통해 트렌드 방향과 거래 기회를 식별합니다. 이점으로는 명확한 트렌드 결정과 정확한 엔트리 신호가 있습니다. 매개 변수 및 필터에 대한 추가 개선은 더 나은 전략 성능을 위해 잘못된 신호를 줄일 수 있습니다.
/*backtest
start: 2022-12-08 00:00:00
end: 2023-12-14 00:00:00
period: 1d
basePeriod: 1h
exchanges: [{"eid":"Futures_Binance","currency":"BTC_USDT"}]
*/

//@version=5
strategy("Ichimoku Cloud", shorttitle="Ichimoku", overlay=true)

previous_close = close[1]

conversionPeriods = input.int(20, minval=1, title="Conversion Line Periods"),
basePeriods = input.int(60, minval=1, title="Base Line Periods")
laggingSpan2Periods = input.int(120, minval=1, title="Lagging Span 2 Periods"),
displacement = input.int(30, minval=1, title="Displacement")

long_entry = input.bool(true, title="Long Entry")
short_entry = input.bool(true, title="Short Entry")
e2e_entry = input.bool(true, title="E2E Entry")

donchian(len) => math.avg(ta.lowest(len), ta.highest(len))

tenkan = donchian(conversionPeriods)
kijun = donchian(basePeriods)
spanA = math.avg(tenkan, kijun)
spanB = donchian(laggingSpan2Periods)

plot(tenkan, color=#0496ff, title="Conversion Line")
plot(kijun, color=#991515, title="Base Line")
plot(close, offset = -displacement, color=#459915, title="Lagging Span")

p1 = plot(spanA, offset = displacement, color=#459915, title="Lead 1")
p2 = plot(spanB, offset = displacement, color=#991515, title="Lead 2")
fill(p1, p2, color = spanA > spanB ? #459915 : #991515)

ss_high = math.max(spanA[displacement - 1], spanB[displacement - 1])
ss_low = math.min(spanA[displacement - 1], spanB[displacement - 1])

// Entry/Exit Signals
tk_cross_bull = tenkan > kijun
tk_cross_bear = tenkan < kijun
kumo_twist_bull = ta.mom(close, displacement) > 0
kumo_twist_bear = ta.mom(close, displacement) < 0

price_above_kumo = close > ss_high
price_below_kumo = close < ss_low

price_enters_kumo_top = previous_close > ss_high[1] and close < ss_high
price_enters_kumo_bottom = previous_close < ss_low[1] and close > ss_low

bullish = tk_cross_bull and kumo_twist_bull and price_above_kumo
bearish = tk_cross_bear and kumo_twist_bear and price_below_kumo

bullishe2e = price_enters_kumo_bottom // and tk_cross_bull
bearishe2e = price_enters_kumo_top // and tk_cross_bear

price_touches_kumo_top = ta.cross(close, ss_high)
price_touches_kumo_bottom = ta.cross(close, ss_low)

strategy.entry("Long", strategy.long, when=bullish and long_entry)
strategy.close("Long", when=tk_cross_bear)
strategy.close("Long", when=price_enters_kumo_top)

strategy.entry("Long e2e", strategy.long, when=bullishe2e and e2e_entry)
strategy.close("Long e2e", when=price_touches_kumo_top)
strategy.close("Long e2e", when=price_below_kumo, qty_percent = 100)
// strategy.close("Long e2e", when=ta.cross(close, kijun), qty_percent = 50)

strategy.entry("Short", strategy.short, when=bearish and short_entry)
strategy.close("Short", when=tk_cross_bull)
strategy.close("Short", when=price_enters_kumo_bottom)

strategy.entry("Short e2e", strategy.short, when=bearishe2e and e2e_entry)
strategy.close("Short e2e", when=price_touches_kumo_bottom)
strategy.close("Short e2e", when=price_above_kumo, qty_percent = 100)
// strategy.close("Long e2e", when=ta.cross(close, kijun), qty_percent = 50)
- HYE 평균 회전 SMA 전략
- 이중 이동 평균 역전 전략
- 쌍방향 가격 돌파 이동 평균 시점 거래 전략
- 볼링거 브레이크아웃 주식 전략
- 7개의 촛불 오시슬레이션 돌파구 전략
- 골든 데드 크로스 트렌드 추적 전략
- TRSI 및 SUPER 트렌드 지표에 기초한 양적 거래 전략
- 다중 지표 조건 필터링에 기반한 양적 전략을 따르는 일내 트렌드
- 볼링거 밴드 및 RSI 짧은 판매 전략
- 중복된 가격 차이에 기초한 역 거래 전략
- 이중 이동 평균 세 배 기하급수 지표 거래 전략
- 동력 지표 결정 거래 전략
- MACD 긴 반전 전략
- 이중 시간 프레임 트렌드 추적 전략
- 여러 시간 프레임에 대한 확인과 함께 브레이크 아웃 전략
- 다중 촛불 패턴의 포괄적 전략
- 연대화 탈퇴 전략
- 네 가지 EMA 크로스오버 전략
- 월별 및 분기 이동 평균 운영에 기초한 양상 거래 전략
- 적응적인 이동 평균과 함께 다중 요인 조합 전략