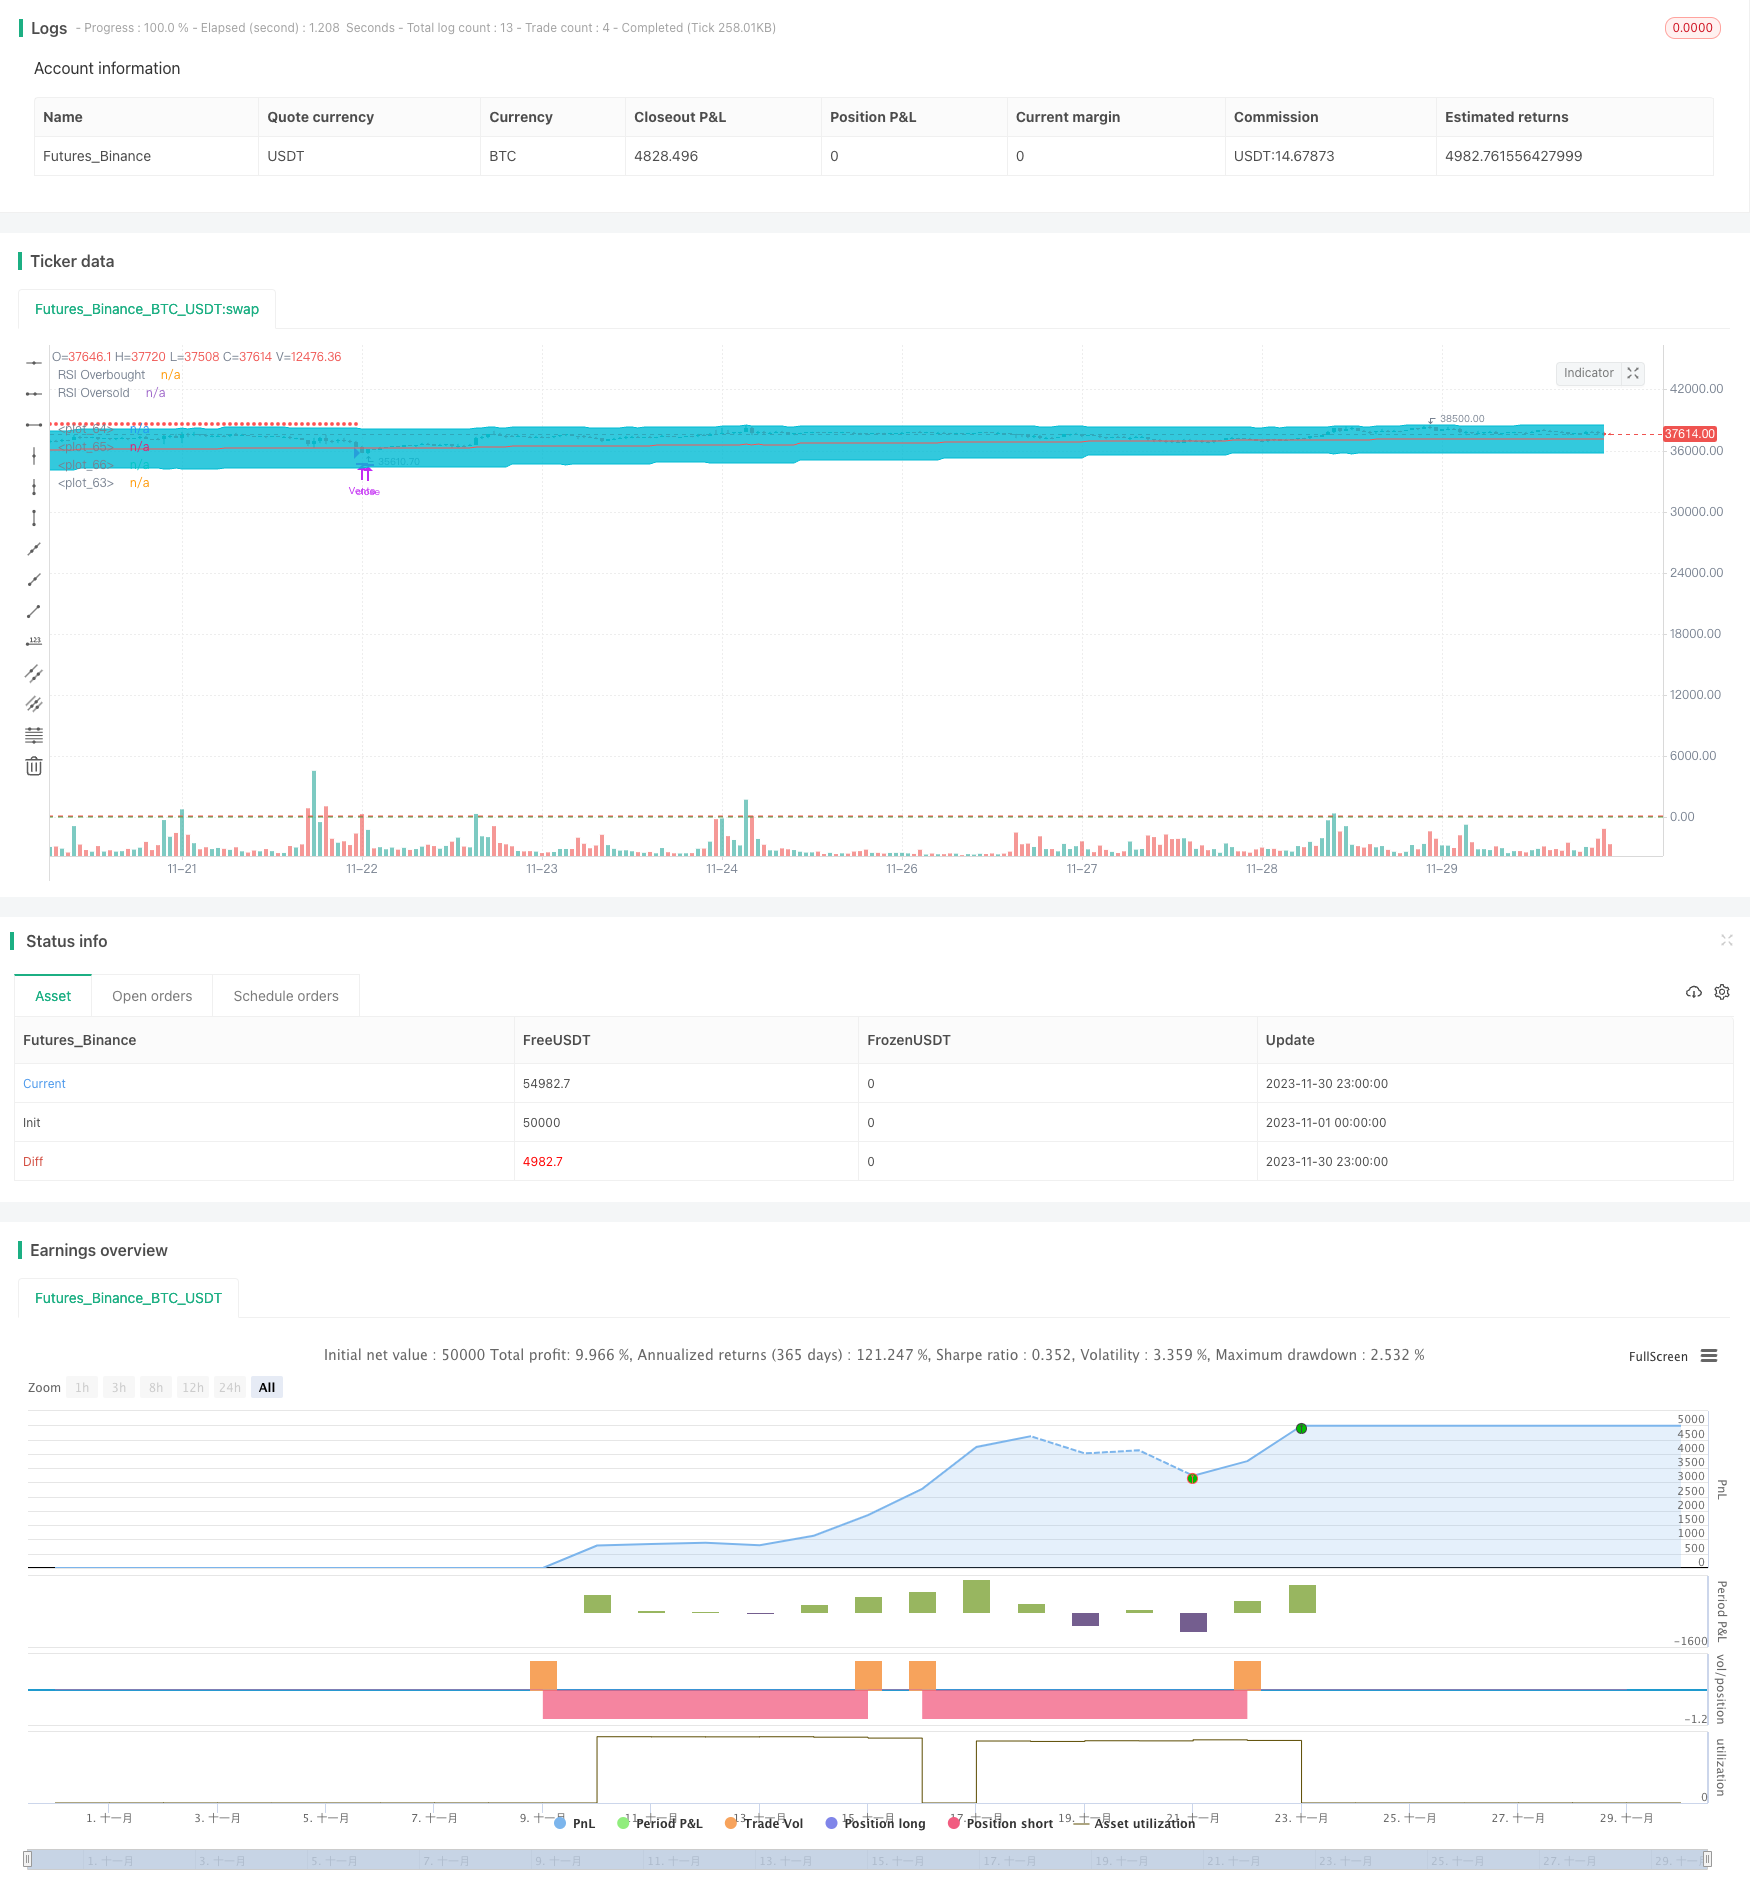
볼링거 밴드 및 RSI를 기반으로 한 양적 거래 전략
저자:차오장, 날짜: 2023-12-20 15:39:19태그:

전반적인 설명
이 전략은 볼린저 밴드 및 상대적 강도 지수 (RSI) 를 기반으로 한 양적 거래 전략을 설계합니다. 트렌드 추적과 과잉 구매 / 과잉 판매 판단을 결합하여 트렌드의 시작에서 시장에 진입하고 과잉 구매 / 과잉 판매 수준에서 수익을 창출합니다.
전략 원칙
이 전략은 가격 추세와 지원/저항 수준을 결정하기 위해 볼링거 밴드를 사용합니다. 낮은 볼링거 밴드에 접근하는 가격은 과잉 판매 신호로 간주되며, 상부 볼링거 밴드에 접근하는 가격은 과잉 구매 신호로 간주됩니다. 동시에 과잉 판매 또는 과잉 구매 조건이 있는지 여부를 결정하기 위해 RSI 지표를 통합합니다.
특정 거래 규칙은: 가격이 아래 볼링거 밴드 아래에서 RSI가 30 아래에서 30 아래에서 길게 갈 때; 가격이 상위 볼링거 밴드 위에 있고 RSI가 70 위에서 짧게 갈 때. 이윤 취득을 위해 중간 볼링거 밴드 또는 반대 볼링거 밴드를 취득 수준으로 설정하십시오. 스톱 손실은 엔트리 가격의 특정 비율로 설정됩니다.
장점
이 전략은 볼링거 밴드 (Bollinger Bands) 의 트렌드 추적 능력과 RSI (RSI) 의 과잉 구매/ 과잉 판매 판단을 결합하여 좋은 트렌드 시작 시기를 파악합니다. 또한, 수익 취득 및 스톱 손실 전략은 명확한 리스크 관리를 제공합니다.
볼링거 밴드 또는 RSI와 같은 단일 지표를 사용하는 것과 비교하면이 전략은 의사 결정 정확성을 향상시키기 위해 여러 지표와 매개 변수를 사용합니다. 적절한 매개 변수 조정으로 비교적 안정적인 성능을 달성 할 수 있습니다.
위험성
이 전략은 매개 변수 최적화에 크게 의존한다. 잘못된 매개 변수 설정은 트렌드를 놓치거나 잘못된 신호를 생성할 수 있다. 예를 들어, 불일치하는 볼링거 기간은 그러한 문제를 일으킬 수 있다. 수익을 취하고 손실을 멈추는 수준 또한 신중한 평가가 필요하다.
전략은 또한 거래 수단에 달려 있습니다. 매우 변동성 있는 자산의 경우 볼링거 밴드 매개 변수를 그에 따라 조정해야 합니다. 명확하지 않은 트렌드를 가진 도구의 경우 성능도 떨어질 수 있습니다. 또한 거래 비용, 미끄러짐 및 극단적인 시장 이벤트에 의해 영향을 받을 수 있습니다.
매개 변수 최적화 테스트는 서로 다른 자산 및 시장 체제에서 수익/손실 중단 수준 및 성과를 평가하는 것이 좋습니다. 위험 관리 버퍼를 유지하십시오.
최적화 방향
몇 가지 측면이 개선될 수 있습니다.
-
거래 도구 특성에 더 잘 맞게 볼링거 밴드 및 RSI의 매개 변수를 평가하고 최적화
-
KDJ, MACD와 같은 추가 지표를 통합하여 다중 요소 모델을 구축합니다.
-
수익 취득/손실 중지 전략, 예를 들어 후속 스톱 손실 또는 스케일된 출출을 평가
-
특정 자산 및 시장 조건에 기초한 동적 매개 변수 조정
-
신호 품질과 위험 수준을 판단하기 위해 기계 학습 모델을 추가합니다.
요약
이 전략은 포괄적인 트렌드 추적 시스템을 위해 볼링거 밴드와 RSI를 통합합니다. 매개 변수 조정 및 리스크 관리를 통해 효과성과 안정성을 향상시키는 데 더 많은 공간이 있습니다. 더 나은 성과를 위해 개인의 필요성과 리스크 선호도에 따라 사용자 정의 조정 및 최적화가 권장됩니다.
/*backtest
start: 2023-11-01 00:00:00
end: 2023-11-30 23:59:59
period: 1h
basePeriod: 15m
exchanges: [{"eid":"Futures_Binance","currency":"BTC_USDT"}]
*/

//@version=4
strategy("BB + RSI Estrategia", overlay=true)

longitud = input(20, title="Longitud BB", minval=5, maxval=50, step=1)
multiplicador = input(2.0, title="Multiplicador BB", type=input.float, step=0.1)
timeframe_bb = input("D", title="Marco de Tiempo BB", type=input.resolution)
rsi_length = input(14, title="Longitud RSI", minval=5, maxval=50, step=1)
rsi_overbought = input(70, title="Nivel de sobrecompra RSI", minval=50, maxval=80, step=1)
rsi_oversold = input(30, title="Nivel de sobreventa RSI", minval=20, maxval=50, step=1)
take_profit = input("Central", title="Take Profit (banda)", options=["Central", "Opuesta"])
stop_loss = input(2.00, title="Stop Loss", type=input.float, step=0.10)

var SL = 0.0

[banda_central, banda_superior, banda_inferior] = security(syminfo.tickerid, timeframe_bb, bb(close, longitud, multiplicador))
rsi_value = rsi(close, rsi_length)

comprado = strategy.position_size > 0
vendido = strategy.position_size < 0

if not comprado and not vendido
    if close < banda_inferior and rsi_value < rsi_oversold
        // Realizar la compra
        cantidad = round(strategy.equity / close)
        strategy.entry("Compra", strategy.long, qty=cantidad, when=cantidad > 0)
        SL := close * (1 - (stop_loss / 100))

    if close > banda_superior and rsi_value > rsi_overbought
        // Realizar la Venta
        cantidad = round(strategy.equity / close)
        strategy.entry("Venta", strategy.short, qty=cantidad, when=cantidad > 0)
        SL := close * (1 + (stop_loss / 100))

if comprado
    // Verificar el take profit
    if take_profit == "Central" and close >= banda_central
        strategy.close("Compra", comment="TP")
        SL := 0

    if take_profit == "Opuesta" and close >= banda_superior
        strategy.close("Compra", comment="TP")
        SL := 0
    // Verificar el stop loss
    if close <= SL
        strategy.close("Compra", comment="SL")
        SL := 0

if vendido
    // Verificar el take profit
    if take_profit == "Central" and close <= banda_central
        strategy.close("Venta", comment="TP")
        SL := 0

    if take_profit == "Opuesta" and close <= banda_inferior
        strategy.close("Venta", comment="TP")
        SL := 0
    // Verificar el Stop loss
    if close >= SL
        strategy.close("Venta", comment="SL")
        SL := 0

// Salida
plot(SL > 0 ? SL : na, style=plot.style_circles, color=color.red)
g1 = plot(banda_superior, color=color.aqua)
plot(banda_central, color=color.red)
g2 = plot(banda_inferior, color=color.aqua)
fill(g1, g2, color=color.aqua, transp=97)

// Dibujar niveles de sobrecompra/sobreventa del RSI
hline(rsi_overbought, "RSI Overbought", color=color.red)
hline(rsi_oversold, "RSI Oversold", color=color.green)
- 황소와 곰의 힘 이동 평균 거래 전략
- 양적 전략: 볼링거 밴드 RSI CCI 크로스오버 전략
- VWAP 탈출 추적 전략
- 동력 역전 거래 전략
- 모멘텀 추적 거래 전략
- 다중 가중화 이동 평균 트렌드 전략
- 볼링거 대역 및 MACD를 기반으로 하는 거래 전략
- 맥드 블루 레드 레버리지 전략
- 모멘텀 캡처 채널 전략
- 헤딩 오스실레이션 역전 전략
- 상대량 지표 전략
- 옥타곤 클라우드 추적 전략
- 확률 강화 RSI 전략
- 트리플 EMA 트렌드 전략
- 스탠 더 맨 - 이중 이동 평균과 변동성에 기초한 고급 주식 거래 전략
- 역대 평균 돌파구 전략
- 이중 이동 평균 역전 전략
- 로가리듬 가격 예측 전략
- 간단한 이동평균 크로스오버 전략
- 볼링거 밴드 및 RSI 트렌드 다음 전략