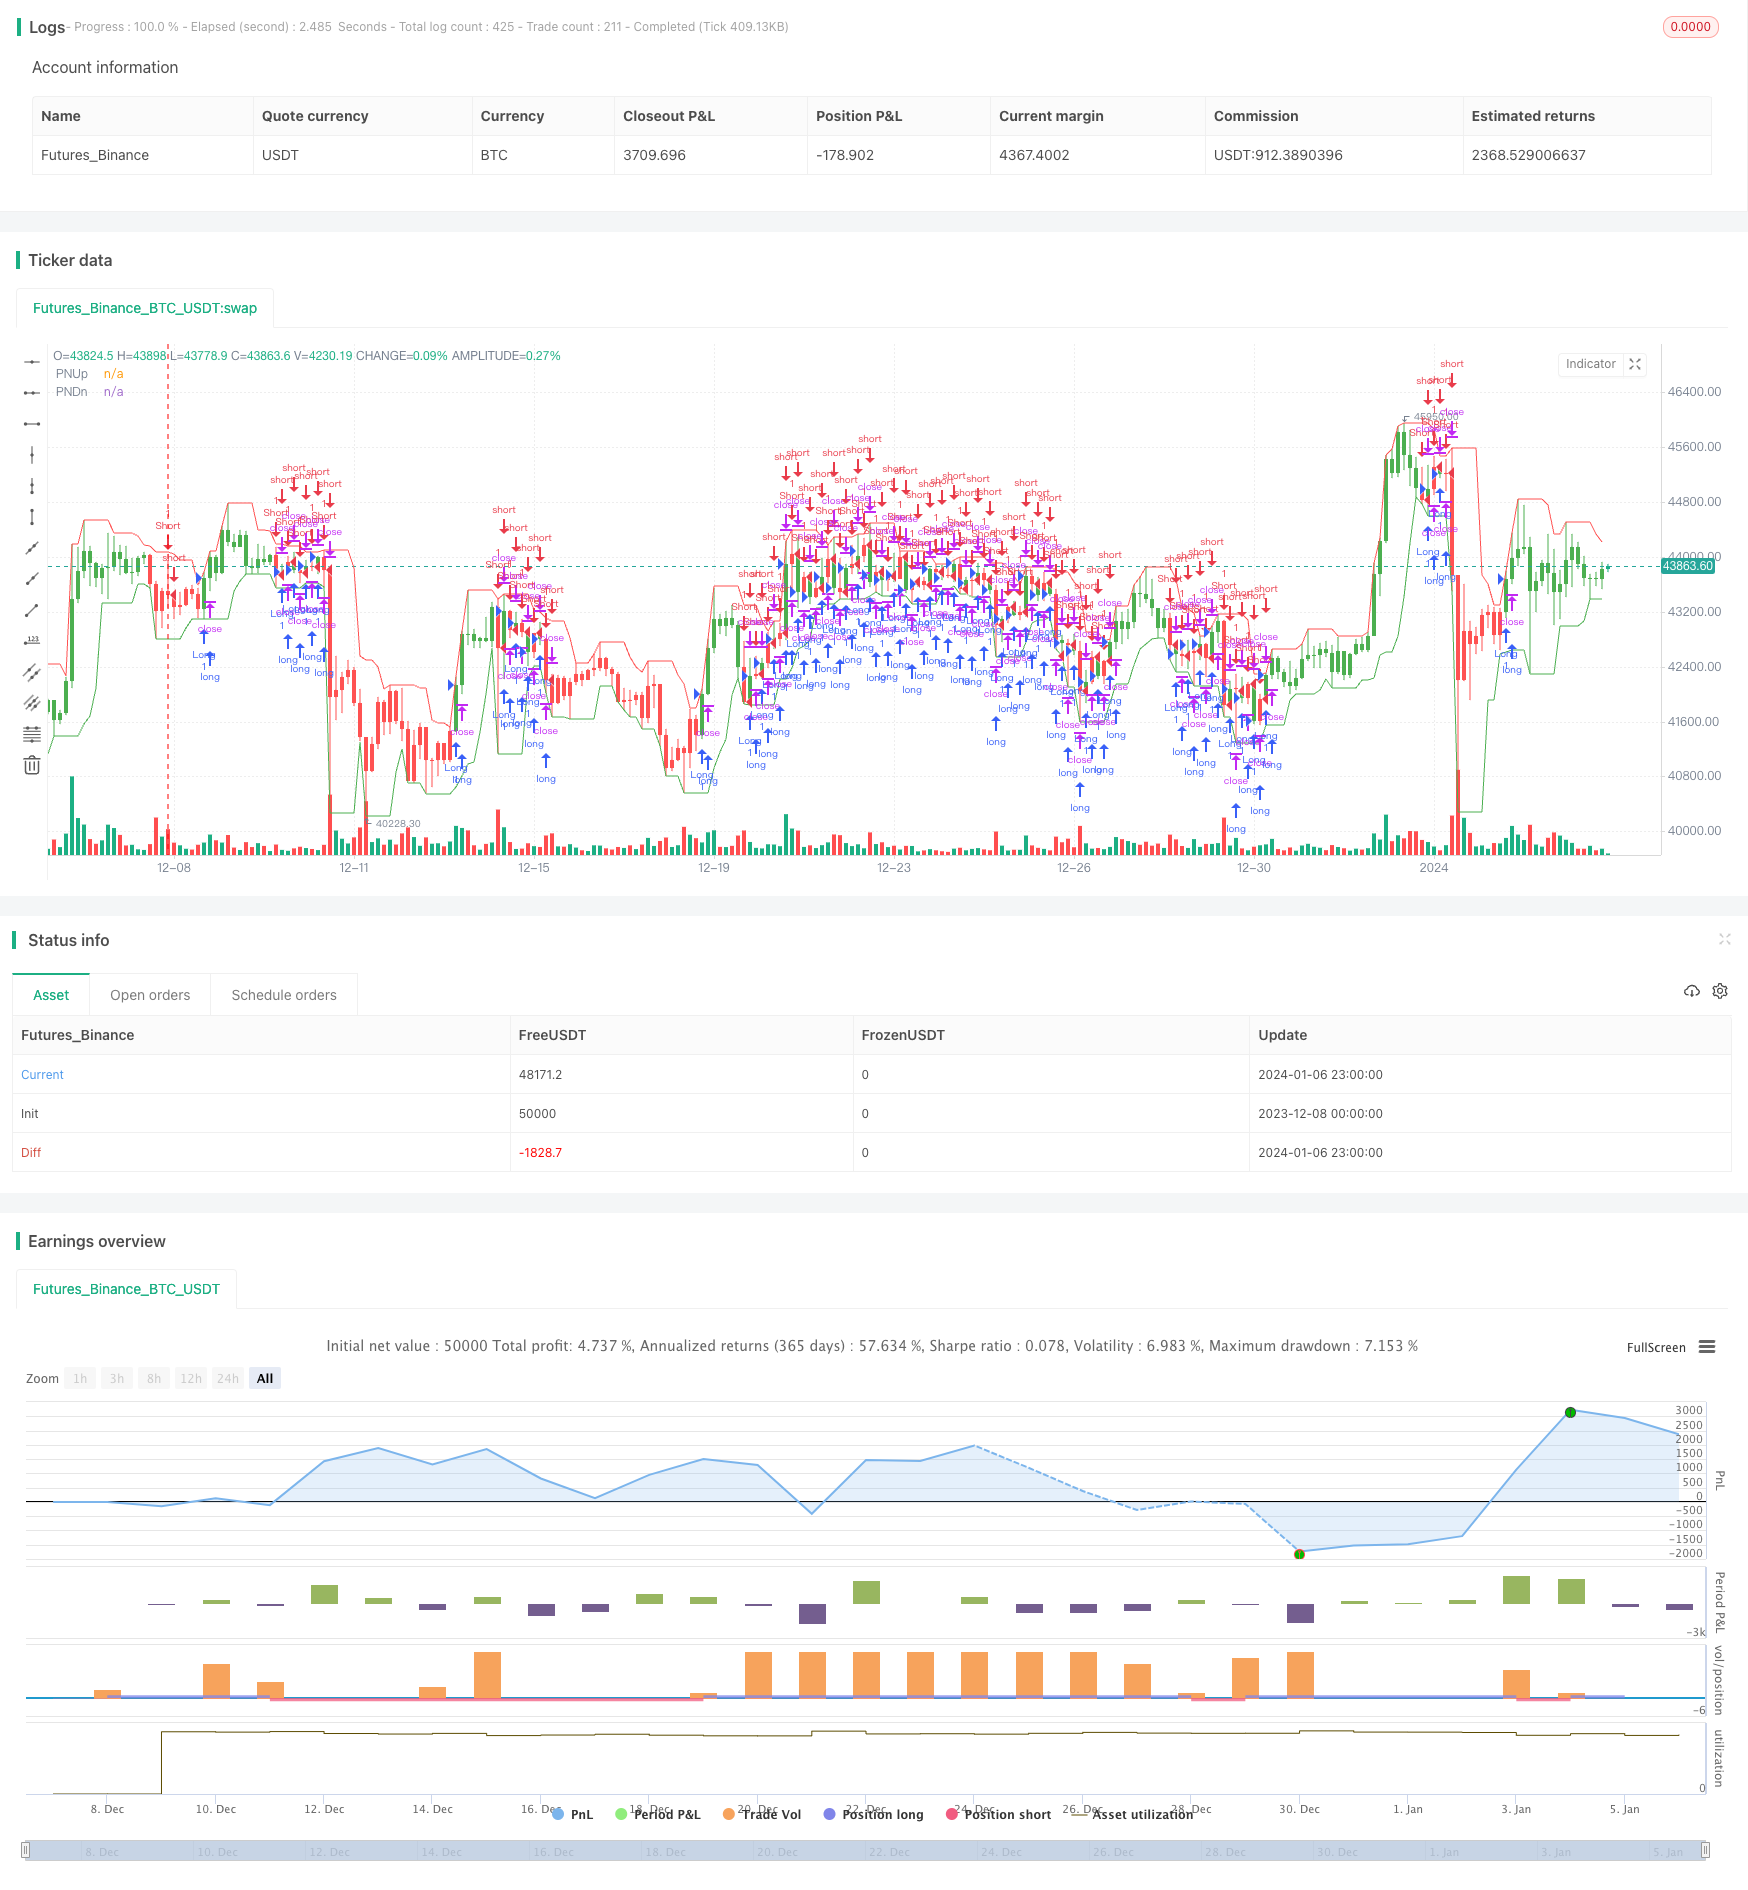
소수 대역 백테스트 전략
저자:차오장, 날짜: 2024-01-08 11:54:52태그:

전반적인 설명
원수 대역 백테스트 전략은 가격 주위에서 가장 높고 가장 낮은 원수를 식별하고 이 두 원수 대열을 대역으로 그래프화하여 시장 추세를 판단합니다. 이 전략은 Modulus Financial Engineering Inc.에 의해 개발되었습니다.
전략 논리
- 입력 허용 비율을 기준으로 정해진 가격 변동 범위를 통과하여 가장 높고 가장 낮은 소수를 찾습니다.
- 가장 최근의 N 바에서 소수 대열의 가장 높고 가장 낮은 점을 얻기 위해 가장 높고 가장 낮은 함수를 사용하십시오.
- 닫기 가격이 소수 띠의 가장 높고 가장 낮은 지점을 통과하는지 여부에 따라 긴 방향 또는 짧은 방향을 결정합니다.
- 트레이딩 신호를 역전하는 것을 선택할 수 있습니다.
이점 분석
- 소수의 무작위 및 불규칙 분포 특성을 사용하여 시장의 무작위성을 포착합니다.
- 소수 대역은 약간의 지연을 가지고 있어 소음을 필터링할 수 있습니다.
- 소수 계층의 상위와 하위 한도는 유연하며, 다른 주기와 다른 거래 종류에 적응하기 위해 허용 비율을 통해 조정될 수 있습니다.
위험 분석
- 소수 대역은 가격 움직임에 완전히 적응할 수 없으며 일정 차원의 지연을 가지고 있습니다.
- 극단적인 가격으로 인한 가격 반전은 잘못된 신호로 이어질 수 있습니다.
- 과도한 허용 비율 설정은 유효한 신호를 필터링합니다.
위험은 매개 변수를 적절히 조정하고 다른 지표와 결합함으로써 피할 수 있습니다.
최적화 방향
- 간단한 이동 평균과 다른 지표를 조합하여 신호를 유발하는 이중 조건을 설정합니다.
- 피보나치 수와 같은 다른 무작위 숫자의 사용을 연구하십시오.
- 자동 매개 변수 최적화를 위해 기계 학습 알고리즘을 도입합니다.
요약
소수 대역 백테스트 전략은 전반적으로 실용적인 가치를 가진 매우 혁신적인 전략이다. 시장의 무작위성을 포착하기 위해 소수의 특성을 사용하면서 추세를 식별하는 가격 차이를 고려하여 연구를 위해 매우 가치가 있습니다. 다음 단계는 신호 품질을 향상시키는 측면에서 최적화하고, 무작위 숫자 유형을 확장하고, 자동 최적화 등을 통해 전략 효과를 더 주목할 수 있습니다.
/*backtest
start: 2023-12-08 00:00:00
end: 2024-01-07 00:00:00
period: 3h
basePeriod: 15m
exchanges: [{"eid":"Futures_Binance","currency":"BTC_USDT"}]
*/

//@version=2
////////////////////////////////////////////////////////////
//  Copyright by HPotter v1.0 27/03/2018
// Determining market trends has become a science even though a high number
// or people still believe it’s a gambling game. Mathematicians, technicians,
// brokers and investors have worked together in developing quite several
// indicators to help them better understand and forecast market movements.
// The Prime Number Bands indicator was developed by Modulus Financial Engineering
// Inc. This indicator is charted by indentifying the highest and lowest prime number
// in the neighborhood and plotting the two series as a band.
//
// You can change long to short in the Input Settings
// WARNING:
//  - For purpose educate only
//  - This script to change bars colors.
////////////////////////////////////////////////////////////
PrimeNumberUpBand(price, percent) =>
    res = 0
    res1 = 0
    for j = price to price + (price * percent / 100)
        res1 := j
	    for i = 2 to sqrt(price)
        	res1 := iff(j % i == 0 , 0, j)
            if res1 == 0
                break
		if res1 > 0
		    break
    res := iff(res1 == 0, res[1], res1)
    res

PrimeNumberDnBand(price, percent) =>
    res = 0
    res2 = 0
    for j = price to price - (price * percent / 100)
        res2 := j
	    for i = 2 to sqrt(price)
        	res2 := iff(j % i == 0 , 0, j)
            if res2 == 0
                break
		if res2 > 0
		    break
    res := iff(res2 == 0, res[1], res2)
    res

strategy(title="Prime Number Bands Backtest", overlay = true)
percent = input(5, minval=0.01, step = 0.01, title="Tolerance Percentage")
Length = input(5, minval=1)
srcUp = input(title="Source Up Band",  defval=high)
srcDn = input(title="Source Down Band",  defval=low)
reverse = input(false, title="Trade reverse")
xPNUB = PrimeNumberUpBand(srcUp, percent)
xPNDB = PrimeNumberDnBand(srcDn, percent)
xHighestPNUB = highest(xPNUB, Length)
xLowestPNUB = lowest(xPNDB, Length)
pos = iff(close > xHighestPNUB[1], 1,
       iff(close < xLowestPNUB[1], -1, nz(pos[1], 0)))
possig = iff(reverse and pos == 1, -1,
          iff(reverse and pos == -1, 1, pos))
if (possig == 1)
    strategy.entry("Long", strategy.long)
if (possig == -1)
    strategy.entry("Short", strategy.short)
barcolor(possig == -1 ? red: possig == 1 ? green : blue )
plot(xHighestPNUB, color=red, title="PNUp")
plot(xLowestPNUB, color=green, title="PNDn")
더 많은
- 이동 평균 크로스 신호 전략
- EMA 200 기반의 후속 영업 및 후속 중단 손실 전략
- 위/하향 K-라인 패턴 고주파 중재 전략
- 이중 이동 평균 오스실레이션 브레이크 전략
- 적응성 변동성 브레이크업 전략
- 이더리움 거래에 대한 슈퍼 트렌드 전략
- EMA 크로스오버 및 MACD 신호 트렌드 전략
- 다중 크로스오버 거북이 및 가중화 이동 평균 및 MACD 및 TSI 조합 전략
- ATR 변동성 필터와 함께 DEMA와 EMA 크로스오버에 기반한 모멘텀 전략
- 리버스 및 SL/TP 확장과 함께 연속 상승/하락 전략
- 급변하는 RSI 거래 전략
- 트레일링 스톱 로스 트렌드와 단일 지수 평형 이동 평균 전략에 따른 트렌드
- 낮은 변동성 구매 VS 높은 변동성 구매 전략
- 기하급수적인 이동평균의 크로스오버 전략
- 다중 시간 프레임 후속 중지 손실 전략
- 이중 이동창의 운동량 TSI 표시기
- RSI 및 볼링거 대역 수익성 전략
- 촛불 폐쇄 전략에서 구매/판매
- 슈퍼트렌드 수익 전략
- 가격 채널 트렌드 전략