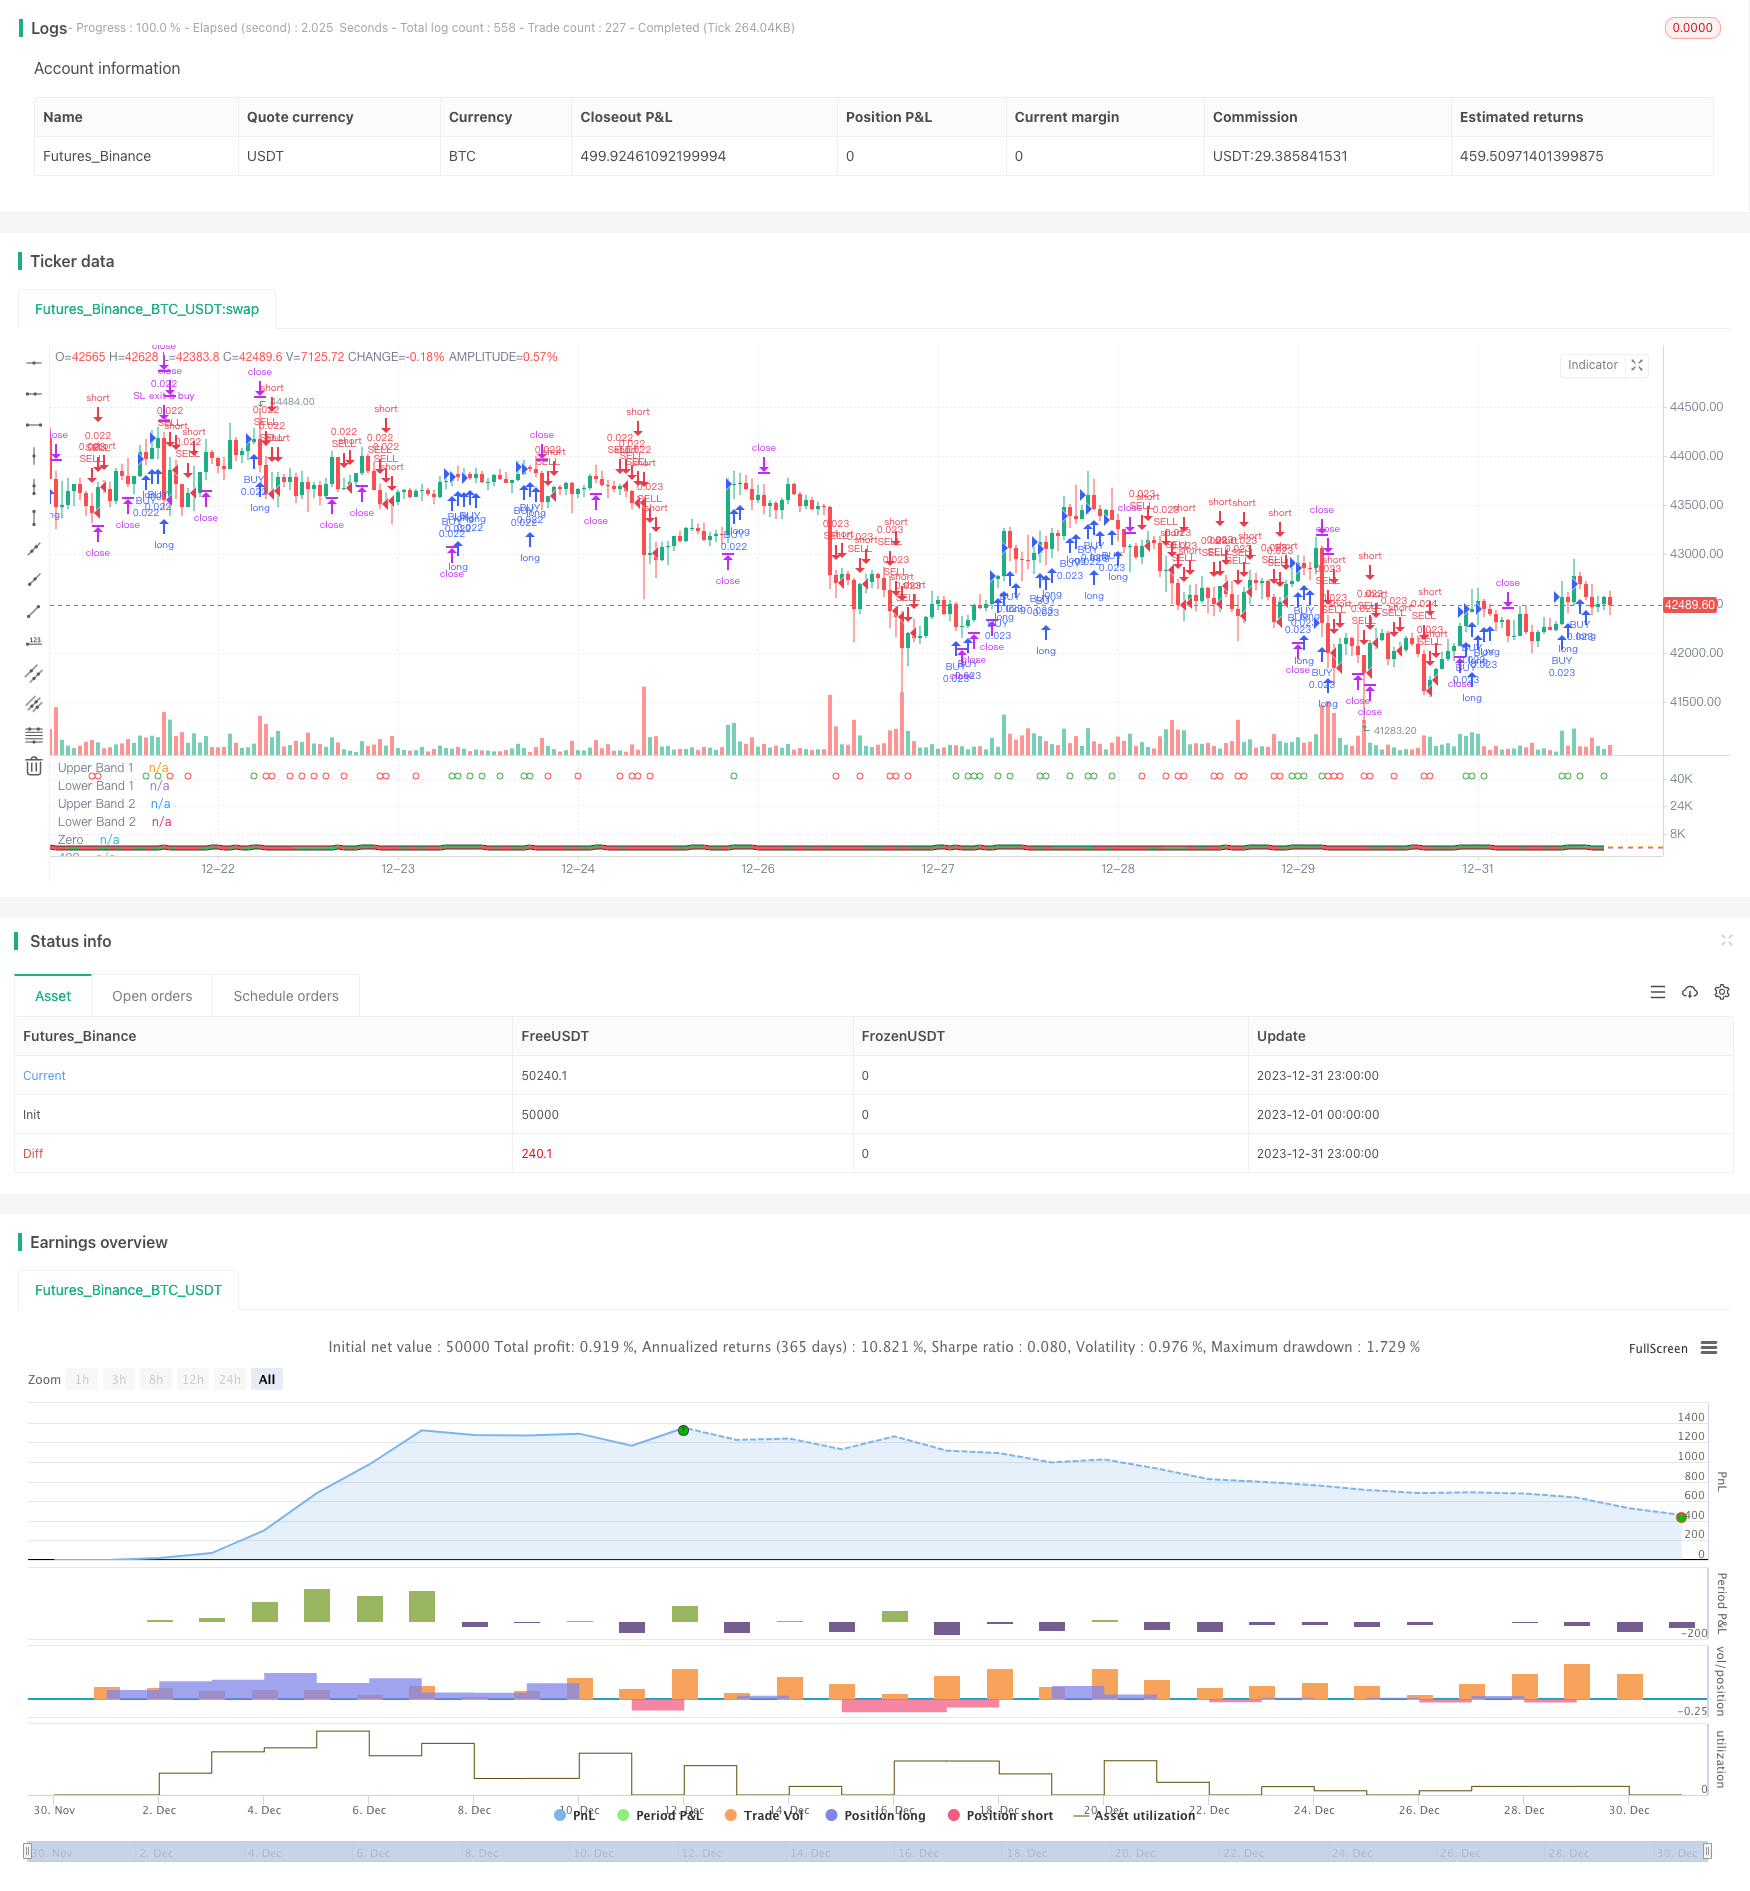
트렌드 서핑 헤딩 전략
저자:차오장, 날짜: 2024-01-23 11:26:14태그:

전반적인 설명
이 전략은 TSI의 양자 거래 신호와 개선된 CCI 지표를 결합하고, 더 안정적인 지속적인 이윤을 추구하는 것을 목표로 자주 열리고 닫는 포지션에 대한 헤지 접근 방식을 채택합니다. 핵심 논리는 TSI 지표의 빠르고 느린 이동 평균의 황금 십자와 죽은 십자이며, 시장 방향을 결정하기 위해 HMACCI 지표의 구매 및 판매 신호와 결합됩니다. 위험은 개척 조건을 제한함으로써 통제되며, 손실 중지 및 수익을 취하는 논리가 설정됩니다.
전략 원칙
이 전략은 주로 TSI와 HMACCI 지표의 조합에 기반합니다.
TSI 지표는 빠른 이동 평균과 느린 것을 포함하여 거래 신호를 결정합니다. 빠른 라인이 느린 라인을 상향으로 돌파하면 구매 신호이며 판매 신호는 반대로됩니다. 이것은 시장 트렌드의 변화를 더 민감하게 파악 할 수 있습니다.
HMACCI 지표는 가격 자체 대신 Hull Moving Average를 사용하는 전통적인 CCI 지표에 기반합니다. 이는 약간의 소음을 필터링하고 과잉 구매 및 과잉 판매 구역을 판단 할 수 있습니다. 과잉 구매 및 과잉 판매 구역은 TSI 지표의 신호 방향을 추가로 확인 할 수 있습니다.
이 전략의 핵심 논리는 이 두 지표의 판단을 결합하고 잘못된 신호를 필터링하기 위해 몇 가지 추가 조건을 설정하는 것입니다. 예를 들어 이전 바의 폐쇄 가격과 최대 및 최소 가격을 여러 기간 동안 조사하여 반전 신호의 품질을 제어하는 것입니다.
포지션 개설을 위해 조건이 충족되면, 시장 주문은 바가 닫힐 때마다, 길고 짧게 둘 다 배치됩니다. 이것은 더 안정적인 수익을 얻을 수 있지만 헤지 전략의 위험을 감수합니다.
이윤을 취하고 손실을 멈추기 위해, 부동 스톱 손실 및 목표 이익에 도달 할 때 모든 명령을 닫습니다. 이것은 일방적인 거래의 위험을 효과적으로 제어 할 수 있습니다.
전략 의 장점
이것은 상대적으로 안정적이고 신뢰할 수 있는 고주파 헤지링 전략입니다. 주요 장점은 다음과 같습니다.
- 이중 지표의 조합은 잘못된 신호를 효과적으로 피할 수 있습니다.
- 각 바에 대한 빈번한 헤지 작업은 이익과 손실의 더 안정적인 변동으로 이어집니다.
- 엄격한 오픈 로직과 스톱 로스 조건은 위험을 제어 할 수 있습니다.
- 트렌드와 역전 판단을 결합하면 더 높은 오류 용도
- 방향 편향이 없고 다양한 시장 조건에 적합합니다.
- 큰 조절 가능한 매개 변수 공간, 다른 제품에 최적화 될 수 있습니다
위험 분석
주목해야 할 주요 위험은 다음과 같습니다.
- 높은 주파수 거래로 인한 더 많은 수수료 손실
- 울타리 안에 갇히지 않도록 완벽하게 피할 수 없습니다.
- 파라미터가 제대로 설정되지 않으면 너무 공격적인 입력
- 단기적으로 일방적으로 엄청난 손실을 견딜 수 있는 어려움
위험은 다음을 통해 줄일 수 있습니다.
- 열기 주파수를 적당하게 조정하여 수수료 영향을 줄이십시오.
- 신호 품질을 보장하기 위해 표시기 매개 변수를 최적화합니다.
- 스톱 로스 범위를 늘리지만 더 많은 헤지 손실을 겪습니다.
- 다른 제품에서의 테스트 매개 변수
최적화 방향
이 전략의 최적화를 위해 여전히 많은 공간이 있습니다.
- 테스트를 통해 기간, 길이 등과 같은 매개 변수를 최적화
- MACD, BOLL 등 다양한 지표 조합을 시도합니다.
- 오픈 로직을 수정하고 더 엄격한 필터를 설정합니다.
- 이윤을 취하고 손실을 멈추는 전략을 최적화합니다. 예를 들어 동적, 브레이크오웃 스톱
- 더 안정적인 매개 변수 범위를 찾기 위해 기계 학습 방법을 사용
- 다른 거래 제품과 시간 프레임에 대한 테스트
- 범위에 제한된 시장에서 지나치게 공격적인 거래를 피하기 위해 트렌드 탐지 결합
결론
전체적으로 이 전략은 높은 결함 내성을 가진 안정적이고 신뢰할 수 있는 헤지 전략이다. 트렌드 및 역전 지표를 결합하여 빈번한 양방향 거래를 통해 안정적인 수익을 얻는다. 또한, 전략 자체는 최적화의 잠재력이 강하며, 더 연구할 가치가 있는 고주파 거래 아이디어를 나타낸다.
/*backtest
start: 2023-12-01 00:00:00
end: 2023-12-31 23:59:59
period: 1h
basePeriod: 15m
exchanges: [{"eid":"Futures_Binance","currency":"BTC_USDT"}]
*/

// This source code is subject to the terms of the suns bipolarity
//©SeaSide420
//@version=4
strategy(title="TSI HMA CCI", default_qty_type=strategy.cash,default_qty_value=1000,commission_type=strategy.commission.percent,commission_value=0.001)
long = input(title="TSI Long Length", type=input.integer, defval=25)
short = input(title="TSI Short Length", type=input.integer, defval=25)
signal = input(title="TSI Signal Length", type=input.integer, defval=13)
length = input(33, minval=1, title="HMACCI Length")
src = input(open, title="Price Source")
ld = input(50, minval=1, title="Line Distance")
CandlesBack = input(8,minval=1,title="Candles Look Back")
StopLoss= input(3000,minval=1, title="Stop Loss")
TargetProfitAll= input(3000,minval=1, title="Target Profit Close All")
FromMonth=input(defval=1,title="FromMonth",minval=1,maxval=12)
FromDay=input(defval=1,title="FromDay",minval=1,maxval=31)
FromYear=input(defval=2020,title="FromYear",minval=2020)
ToMonth=input(defval=1,title="ToMonth",minval=1,maxval=12)
ToDay=input(defval=1,title="ToDay",minval=1,maxval=31)
ToYear=input(defval=9999,title="ToYear",minval=2017)
start=timestamp(FromYear,FromMonth,FromDay,00,00)
finish=timestamp(ToYear,ToMonth,ToDay,23,59)
window()=>true
ul = (ld)
ll = (ld-ld*2)
ma = hma(src, length)
cci = (src - ma) / (0.015 * dev(src, length))
price = close
double_smooth(src, long, short) =>
	fist_smooth = ema(src, long)
	ema(fist_smooth, short)
pc = change(price)
double_smoothed_pc = double_smooth(pc, long, short)
double_smoothed_abs_pc = double_smooth(abs(pc), long, short)
tsi_value = 100 * (double_smoothed_pc / double_smoothed_abs_pc)*10
tsi_value2=ema(tsi_value/10, signal)*10
cc = color.white
ct = color.new(color.gray, 90)
if cci<ll or cci[1]<ll
    cc:=color.red
if cci>ul or cci[1]>ul
    cc:=color.green
if cci<ul and cci>ll
    cc:=color.new(color.yellow, 90)
ccc = color.white
if cci>ul
    ccc:=color.green
if cci<cci[1] and cci<ul and cci>ll
    ccc:=color.red
if cci<ll
    ccc:=color.red
if cci>cci[1] and cci>ll and cci<ul
    ccc:=color.green
tsiplot= plot(tsi_value, color=color.lime)
tsiplot2=plot(tsi_value2, color=color.red)
colorchange2 =tsi_value>tsi_value2?color.lime:color.orange
fill(tsiplot, tsiplot2, color=colorchange2, title="TSIBackground", transp=50)
band1 = hline(ul, "Upper Band 1", color=ct, linestyle=hline.style_dashed)
band0 = hline(ll, "Lower Band 1", color=ct, linestyle=hline.style_dashed)
fill(band1, band0, color=cc, title="MidBandBackground", transp=0)
band2 = hline(ul, "Upper Band 2", color=ct, linestyle=hline.style_dashed)
band3 = hline(ll, "Lower Band 2", color=ct, linestyle=hline.style_dashed)
cciplot2 = plot(cci, "CCIvHMA 2", color=color.black, transp=0, linewidth=5)
cciplot = plot(cci, "CCIvHMA", color=ccc, transp=0, linewidth=3)
hline(0, title="Zero")
hline(420, title="420")
hline(-420, title="-420")
fill(cciplot, cciplot2, color=ccc, title="CCIBackground", transp=0)
LongCondition=cci>cci[1] and cci>ll and src>src[CandlesBack] and tsi_value>tsi_value2
ShortCondition=cci<cci[1] and cci<ul and src<src[CandlesBack] and tsi_value<tsi_value2
plotshape(LongCondition, title="BUY", style=shape.circle, location=location.top, color=color.green)
plotshape(ShortCondition, title="SELL", style=shape.circle, location=location.top, color=color.red)
if  strategy.openprofit>TargetProfitAll
    strategy.close_all(when=window(),comment="close all profit target")
if LongCondition and strategy.openprofit>-1
    strategy.order("BUY", strategy.long,when=window())
if ShortCondition and strategy.openprofit>-1
    strategy.order("SELL", strategy.short,when=window())
strategy.exit("SL exit a sell", "SELL", loss = StopLoss,when=window())
strategy.exit("SL exit a buy", "BUY", loss = StopLoss,when=window())