개요
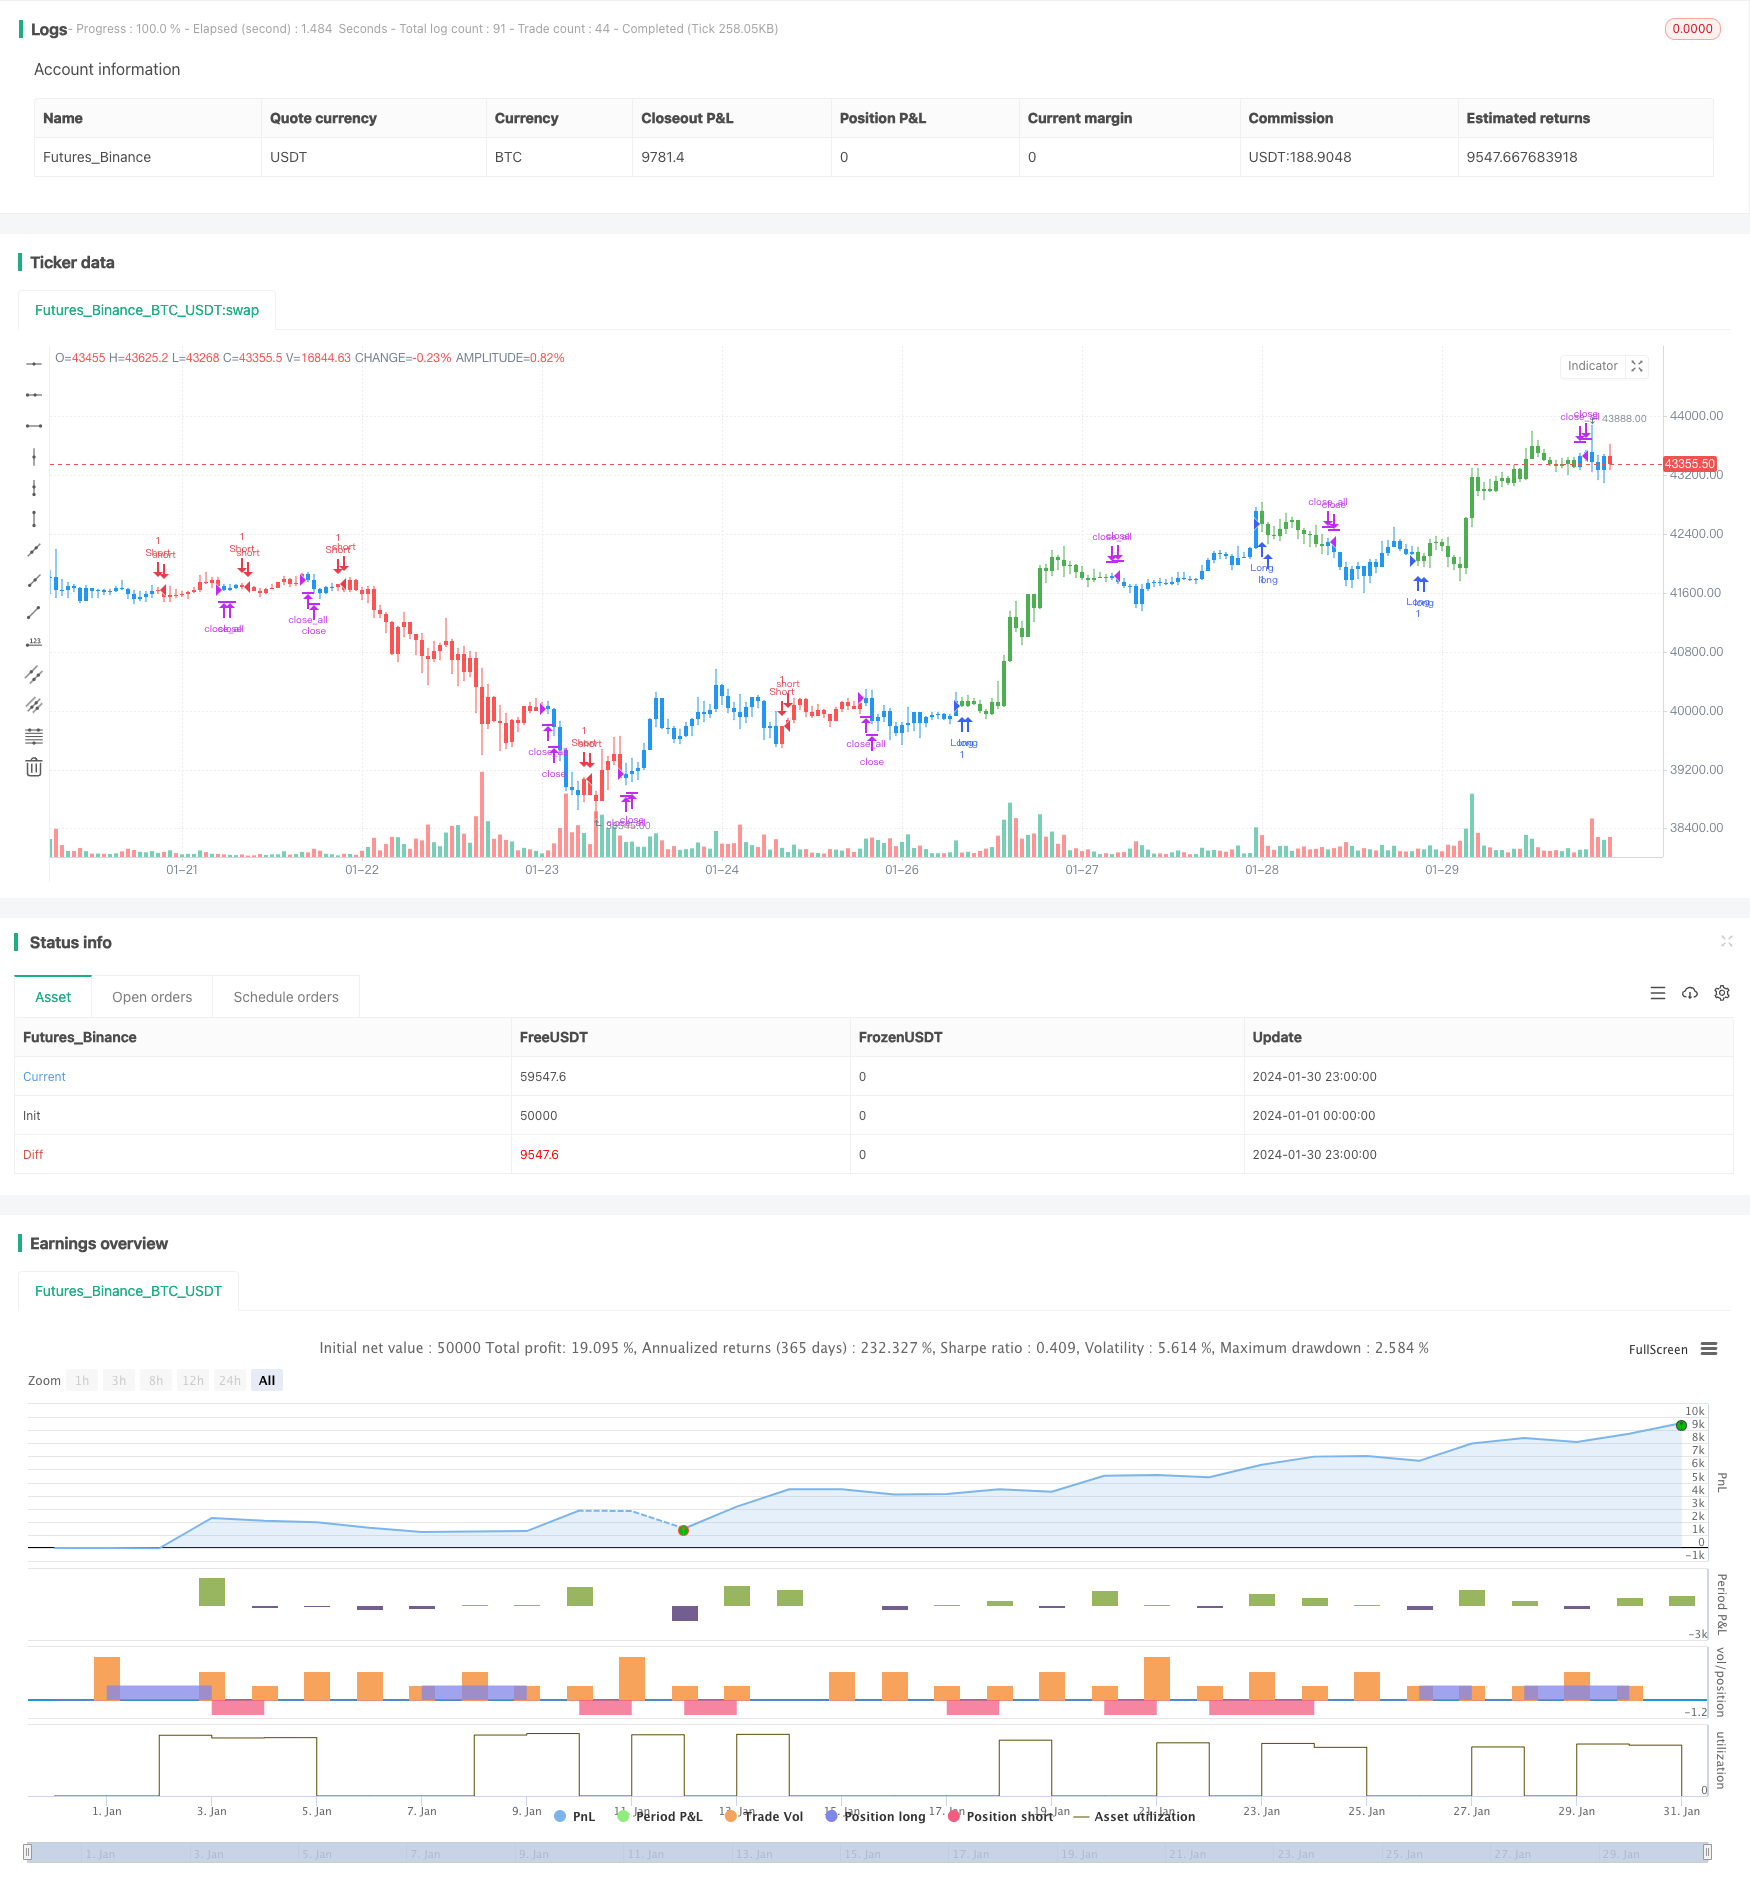
이 전략은 두 가지의 다른 전략의 조합으로, 첫 번째 전략은 주식 가격의 쌍중 이동 평균을 가로질러 신호를 형성한다; 두 번째 전략은 윌리엄스 지표의 마법의 스윙 지표를 기반으로한다. 최종 신호는 두 가지 전략 신호의 교차점을 가져 최종 거래 신호를 형성한다.
전략 원칙
첫 번째 전략의 원리는, 어제의 종결 가격이 전날의 종결 가격보다 높고, 빠른 K선 9일 랜덤 지표가 느린 D선 3일 랜덤 지표보다 낮을 때 구매 신호를 생성하고, 어제의 종결 가격이 전날의 종결 가격보다 낮고, 빠른 K선 9일 랜덤 지표가 느린 D선 3일 랜덤 지표보다 높을 때 판매 신호를 생성하는 것이다.
두 번째 전략의 원칙은, 5일과 34일 가격 변동의 차이를 계산하고, 그 차이를 계산하는 이동 평균을 계산하는 것이다. 현재 값이 이전 주기보다 높을 때 구매 신호로, 현재 값이 이전 주기보다 낮을 때 판매 신호로 한다.
두 전략과 결합하여, 최종 신호는 두 전략 신호의 교차점을 취한다. 두 전략이 동시에 구매 신호를 발신할 때, 더 많이 한다. 두 전략이 동시에 판매 신호를 발신할 때, 공백한다.
우위 분석
이 전략은 듀얼 이동 평균 전략과 윌리엄스 지표 전략의 두 가지 전략의 장점을 결합한다. 듀얼 이동 평균 전략은 중장선 트렌드를 잡을 수 있으며, 윌리엄스 지표 전략은 짧은 라인 거래 기회를 잡을 수 있다. 두 가지 전략을 조합하면 수익을 창출하고 가짜 돌파구를 방지 할 수 있다.
또한, 이 전략은 여러 개의 변수 입력 설정을 채택하고, 다양한 주식과 시장 상황에 따라 변수를 최적화하여 보다 광범위한 시장 환경에 적응할 수 있다.
위험 분석
이 전략의 가장 큰 위험은 두 전략의 신호가 일치하지 않을 수 있다는 것입니다. 전략 중 하나가 구매 신호를 발신하고 다른 하나는 판매 신호를 발신하면 전략은 유효한 신호를 생성할 수 없으며 거래 기회를 놓칠 수 있습니다.
또한, 이 전략에는 여러 개의 매개 변수가 포함되어 있어 매개 변수 최적화에 약간의 어려움이 있다. 부적절한 매개 변수 조합은 전략의 부적절한 성능을 초래할 수 있다.
위험을 줄이기 위해 전략적 신호 중 하나만 사용하는 것을 고려할 수 있습니다. 또는 다른 시장 환경에 적합한 파라미터 범위를 결정하는 연구를 고려할 수 있습니다.
최적화 방향
이 전략은 다음과 같은 부분에서 최적화될 수 있습니다.
두 전략 신호의 일관성을 평가하고, 서로 다른 파라미터 아래의 신호 매칭 정도를 연구하여 최적의 파라미터 조합을 결정한다.
이 전략의 성능을 다른 품종과 다른 주기에서 테스트하여 최적의 적용 범위를 찾습니다.
이중 이동 평균 전략을 다른 지표, 예를 들어 KDJ 지표와 같은, 풍부한 전략 포트폴리오로 전환하는 것을 고려할 수 있다.
위험을 통제하기 위한 손해 차단 장치를 추가합니다. 예를 들어 최대 회수 손해 차단을 설정합니다.
요약하다
이 전략은 듀얼 이동 평균 전략과 윌리엄스 지표 전략을 결합하고, 트렌드 추적과 단선 신호 포획을 병행한다. 파라미터 최적화를 통해 광범위한 시장 환경에 적응할 수 있다. 그러나 여기에는 신호 매칭 불일치와 복잡한 파라미터 최적화의 어려움으로 인한 위험도 있다.
/*backtest
start: 2024-01-01 00:00:00
end: 2024-01-31 00:00:00
period: 1h
basePeriod: 15m
exchanges: [{"eid":"Futures_Binance","currency":"BTC_USDT"}]
*/

//@version=3
////////////////////////////////////////////////////////////
//  Copyright by HPotter v1.0 20/06/2019
// This is combo strategies for get a cumulative signal.
//
// First strategy
// This System was created from the Book "How I Tripled My Money In The
// Futures Market" by Ulf Jensen, Page 183. This is reverse type of strategies.
// The strategy buys at market, if close price is higher than the previous close
// during 2 days and the meaning of 9-days Stochastic Slow Oscillator is lower than 50.
// The strategy sells at market, if close price is lower than the previous close price
// during 2 days and the meaning of 9-days Stochastic Fast Oscillator is higher than 50.
//
// Second strategy
//    This indicator plots the oscillator as a histogram where blue denotes
//    periods suited for buying and red . for selling. If the current value
//    of AO (Awesome Oscillator) is above previous, the period is considered
//    suited for buying and the period is marked blue. If the AO value is not
//    above previous, the period is considered suited for selling and the
//    indicator marks it as red.
//  You can make changes in the property for set calculating strategy MA, EMA, WMA
//
// WARNING:
// - For purpose educate only
// - This script to change bars colors.
////////////////////////////////////////////////////////////
Reversal123(Length, KSmoothing, DLength, Level) =>
    vFast = sma(stoch(close, high, low, Length), KSmoothing)
    vSlow = sma(vFast, DLength)
    pos = 0.0
    pos := iff(close[2] < close[1] and close > close[1] and vFast < vSlow and vFast > Level, 1,
	         iff(close[2] > close[1] and close < close[1] and vFast > vSlow and vFast < Level, -1, nz(pos[1], 0)))
	pos

BillWilliamsAC(nLengthSlow, nLengthFast,nLengthMA, nLengthEMA, nLengthWMA, bShowWMA, bShowMA, bShowEMA) =>
    pos = 0
    xSMA1_hl2 = sma(hl2, nLengthFast)
    xSMA2_hl2 = sma(hl2, nLengthSlow)
    xSMA1_SMA2 = xSMA1_hl2 - xSMA2_hl2
    xSMA_hl2 = sma(xSMA1_SMA2, nLengthFast)
    nRes =  xSMA1_SMA2 - xSMA_hl2
    xResWMA = wma(nRes, nLengthWMA)
    xResMA = sma(nRes, nLengthMA)
    xResEMA = ema(nRes, nLengthEMA)
    xSignalSeries = iff(bShowWMA, xResWMA,
                     iff(bShowMA, xResMA,
                      iff(bShowEMA, xResEMA, na)))
    cClr = nRes > nRes[1] ? blue : red
    pos := iff(xSignalSeries[2] < 0 and xSignalSeries[1] > 0, 1,
	         iff(xSignalSeries[2] > 0 and xSignalSeries[1] < 0, -1, nz(pos[1], 0)))
    pos

strategy(title="Combo Backtest 123 Reversal & Bill Williams. Awesome Oscillator (AC) with Signal Line", shorttitle="Combo", overlay = true)
Length = input(14, minval=1)
KSmoothing = input(1, minval=1)
DLength = input(3, minval=1)
Level = input(50, minval=1)
//-------------------------
nLengthSlow = input(34, minval=1, title="Length Slow")
nLengthFast = input(5, minval=1, title="Length Fast")
nLengthMA = input(15, minval=1, title="MA")
nLengthEMA = input(15, minval=1, title="EMA")
nLengthWMA = input(15, minval=1, title="WMA")
bShowWMA = input(type=bool, defval=true, title="Show and trading WMA")
bShowMA = input(type=bool, defval=false, title="Show and trading MA")
bShowEMA = input(type=bool, defval=false, title="Show and trading EMA")
reverse = input(false, title="Trade reverse")
posReversal123 = Reversal123(Length, KSmoothing, DLength, Level)
posBillWilliamsAC = BillWilliamsAC(nLengthSlow, nLengthFast,nLengthMA, nLengthEMA, nLengthWMA, bShowWMA, bShowMA, bShowEMA)
pos = iff(posReversal123 == 1 and posBillWilliamsAC == 1 , 1,
	   iff(posReversal123 == -1 and posBillWilliamsAC == -1, -1, 0))
possig = iff(reverse and pos == 1, -1,
          iff(reverse and pos == -1, 1, pos))
if (possig == 1)
    strategy.entry("Long", strategy.long)
if (possig == -1)
    strategy.entry("Short", strategy.short)
if (possig == 0)
    strategy.close_all()
barcolor(possig == -1 ? red: possig == 1 ? green : blue )