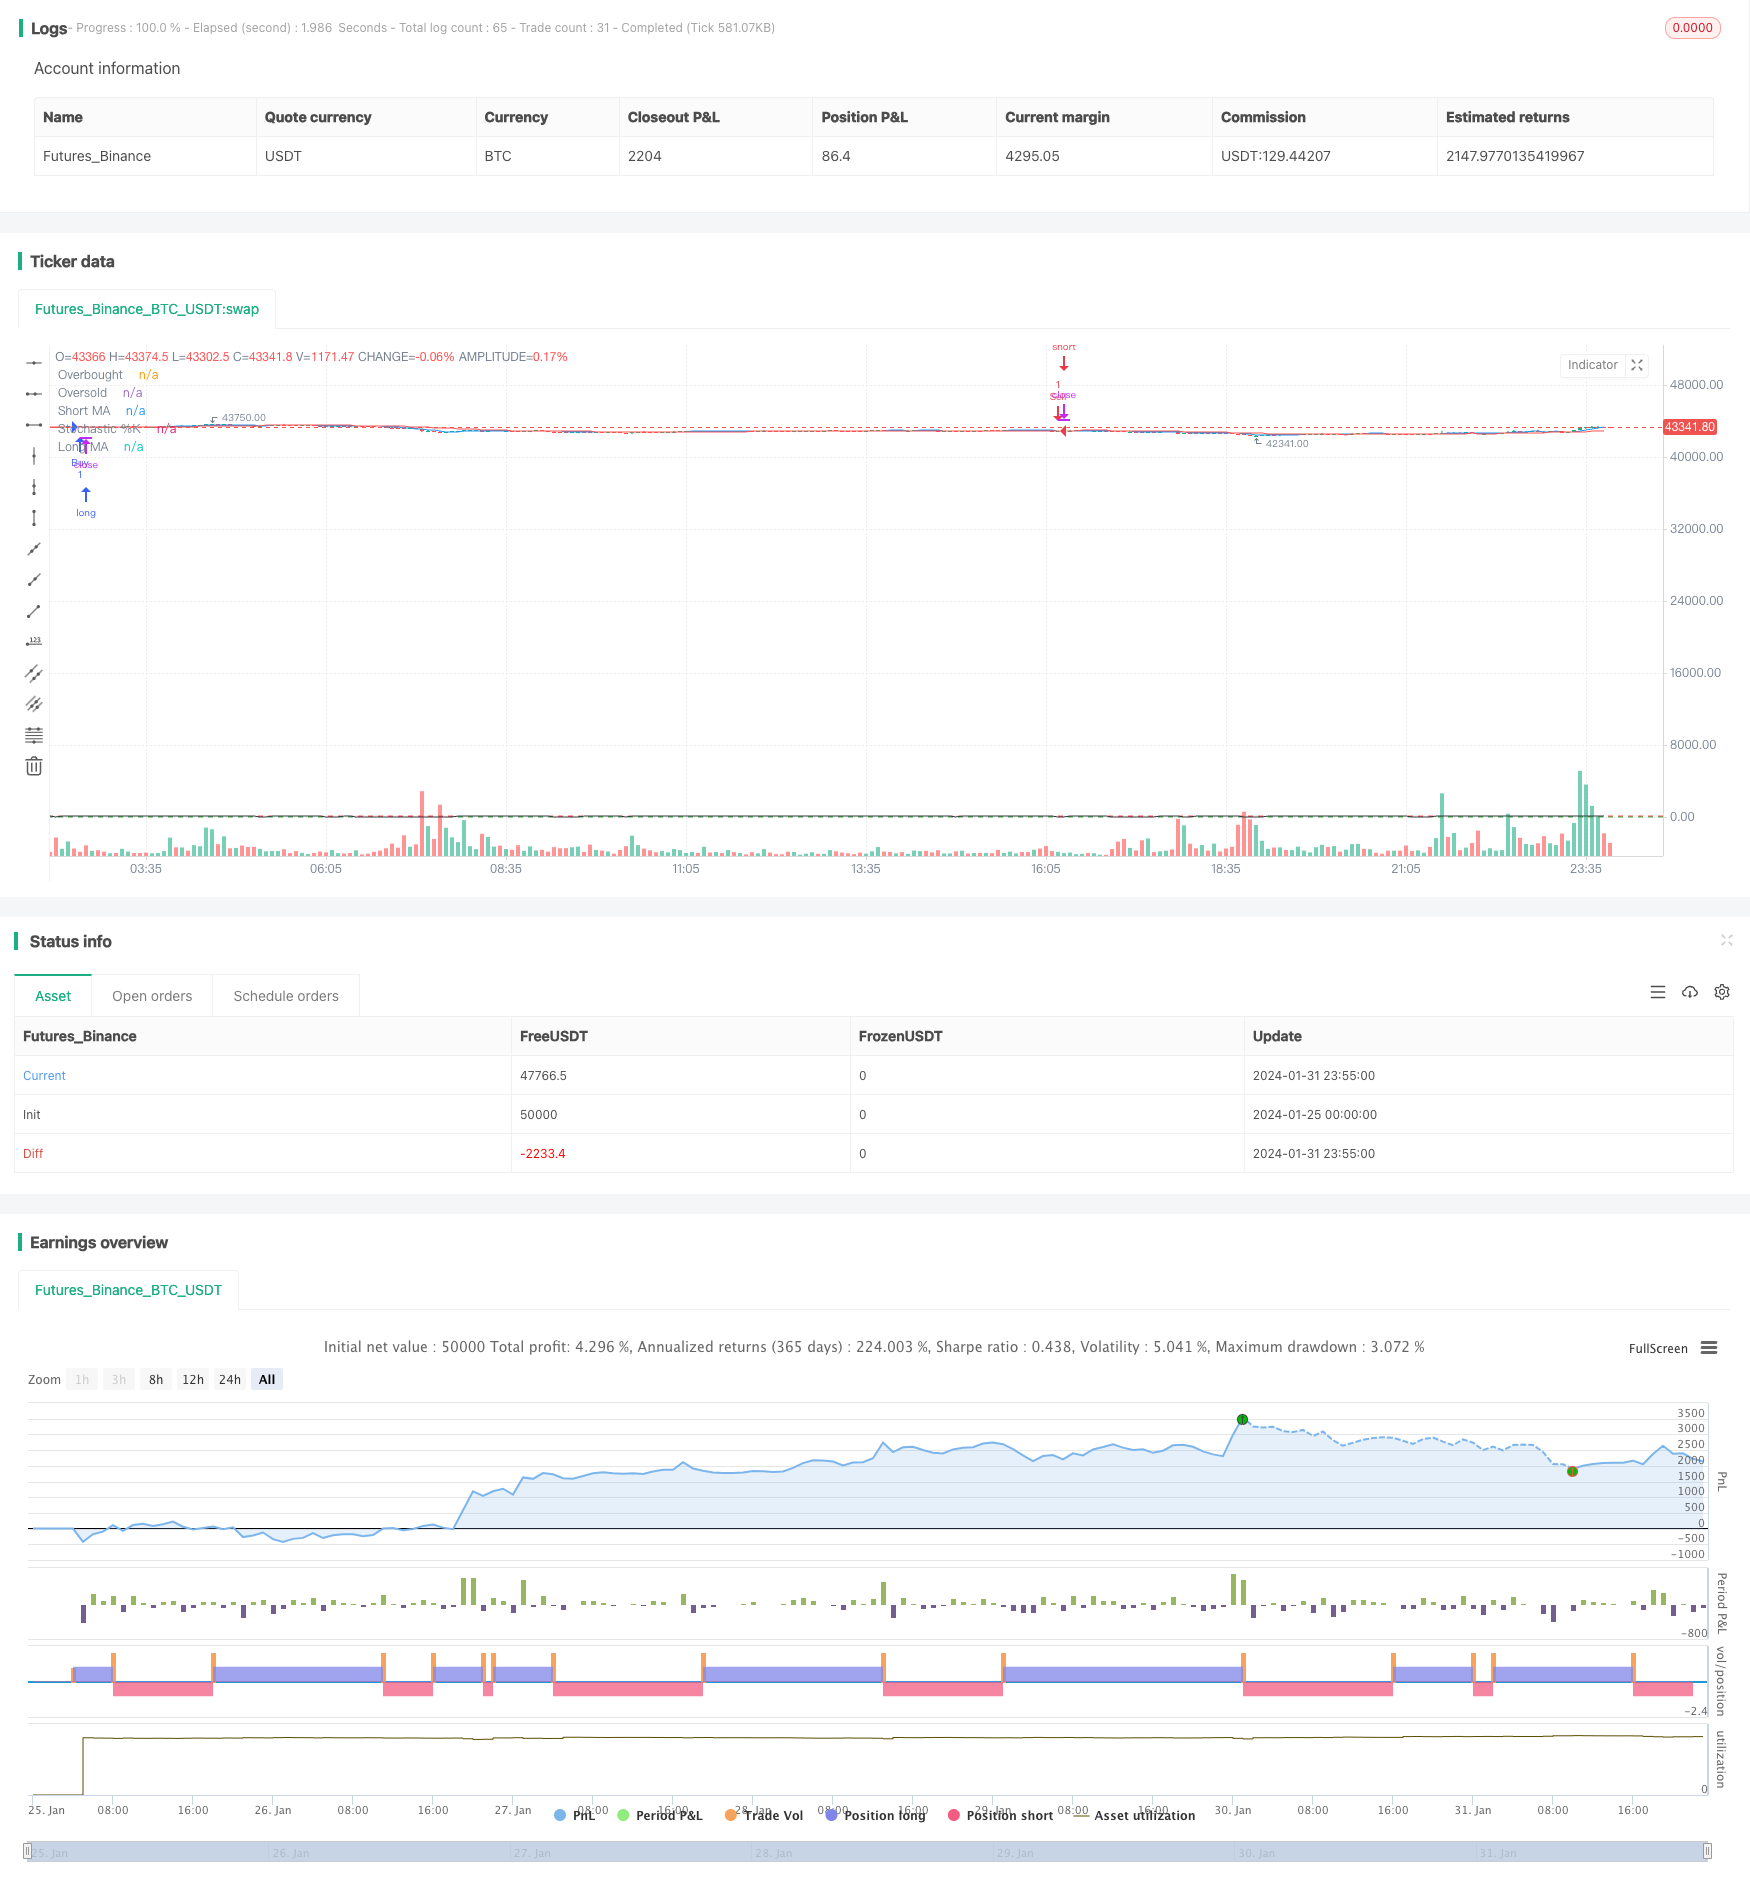
이동 평균 및 스토카스틱 거래 전략
저자:차오장, 날짜: 2024-02-02 10:48:37태그:

전반적인 설명
이 전략은 움직이는 평균과 스토카스틱 오시레이터를 결합하여 자동화 된 주식 거래 시스템을 구현합니다. 트렌드 및 과잉 구매 / 과잉 판매 신호를 캡처하기 위해 서로 다른 길이의 두 개의 움직이는 평균과 스토카스틱 지표를 사용하여 과잉 구매 / 과잉 판매 지역에서 트렌드 방향 및 지표 신호를 기반으로 구매 및 판매 결정을합니다.
전략 논리
1. 이동 평균
빠른 라인 (5일) 및 느린 라인 (20일) 이동 평균을 사용합니다. 느린 라인의 위의 빠른 라인을 넘는 것은 구매 신호이며 아래를 넘는 것은 판매 신호입니다. 이동 평균은 가격 추세와 방향을 결정합니다.
2. 스토카스틱 오시일레이터
스토카스틱 매개 변수는: K 라인 기간 14, K 라인 매끄러운 기간 3, D 라인 매끄러운 기간 3. K 라인 상의 20 이하는 과잉 판매 지역이며, 80 이상은 과잉 구매 지역입니다. 스토카스틱 오시레이터는 과잉 구매 / 과잉 판매 지역에 있는지 여부를 결정합니다.
3. 입국 규칙
구매 조건: 느린 MA와 K 라인 <20 (가장 팔린 지역) 이상 빠른 MA 크로스오버 판매 조건: 느린 MA와 K 라인 > 80 (가장 구매된 지역) 아래의 빠른 MA 크로스오버
구매 조건이 충족되면 장거리, 판매 조건이 충족되면 단거리.
4. 중지 손실 설정
구매 후 1%의 수익 목표를 설정하고 판매 후 1%의 스톱 로스를 설정합니다.
이점 분석
이 전략은 중장기 가격 추세를 효과적으로 파악하기 위해 트렌드와 지표를 결합하고 있으며, 스토카스틱 오시레이터를 사용하여 거래의 타이밍을 제어하고 명확한 방향 편향 없이 무작위 입력을 피합니다. 전략 매개 변수는 다른 시장 환경에 맞게 조정됩니다. 전반적으로이 전략은 상승 추세에 큰 / 중심 자본 주식에서 매우 잘 작동합니다.
위험 과 해결책
-
중요한 뉴스 사건으로 인한 가격 상승으로 인해 큰 손실이 발생할 수 있습니다.
-
지속된 범위 제한 시장은 연속적인 작은 손실로 이어질 수 있습니다. 손실을 줄이기 위해 MA 기간을 조정하십시오.
-
시장의 주요 기간을 피하십시오. 가격이 반전되는 경향이있는 때.
최적화
-
다양한 MA 길이와 같은 최적의 매개 변수를 찾기 위해 다른 매개 변수 조합을 테스트합니다.
-
수익률을 높이기 위해 용량, 필터 조건의 변동성 같은 다른 분석 도구를 포함합니다.
-
단일 주식 위험을 줄이기 위해 강력한 주식이나 캡 가중된 지수를 선택하는 것과 같은 주식 선택 메커니즘을 연구합니다.
결론
전체 전략은 원활하게 작동합니다. 중지 손실 및 이익 목표와 함께 전체 이익/손실 프로필은 견고합니다. 매개 변수 조정 및 주식 풀 필터링에서 추가 개선이 예상 될 수 있습니다. 일반적으로 이것은 구현하기 쉽고 견고한 수치 거래 전략입니다.
/*backtest
start: 2024-01-25 00:00:00
end: 2024-02-01 00:00:00
period: 5m
basePeriod: 1m
exchanges: [{"eid":"Futures_Binance","currency":"BTC_USDT"}]
*/

//@version=4
strategy("Moving Average and Stochastic Strategy 80% ", overlay=true)

// Moving Average Settings
maShortLength = input(5, title="Short MA Length")
maLongLength = input(20, title="Long MA Length")

// Stochastic Settings
stochLength = input(14, title="Stochastic Length")
smoothK = input(3, title="Stochastic %K")
smoothD = input(3, title="Stochastic %D")
stochOverbought = 80
stochOversold = 20

// Profit Target Settings
profitTarget = input(1, title="Profit Target (%)") // 1% profit target

// Calculate Moving Averages
maShort = sma(close, maShortLength)
maLong = sma(close, maLongLength)

// Calculate Stochastic
k = sma(stoch(close, high, low, stochLength), smoothK)
d = sma(k, smoothD)

// Entry Conditions
longConditionMA = crossover(maShort, maLong) and k < stochOversold
shortConditionMA = crossunder(maShort, maLong) and k > stochOverbought

// Opposite Conditions
oppositeLongConditionMA = crossunder(maShort, maLong) and k < stochOversold
oppositeShortConditionMA = crossover(maShort, maLong) and k > stochOverbought

// Strategy Logic
if (longConditionMA)
    strategy.entry("Buy", strategy.long)
    strategy.exit("Exit Buy", "Buy", profit=close * (50 + profitTarget / 100))

if (shortConditionMA)
    strategy.entry("Sell", strategy.short)
    strategy.exit("Exit Sell", "Sell", profit=close * (20 - profitTarget / 100))

// Opposite Strategy Logic
if (oppositeLongConditionMA)
    strategy.entry("Sell", strategy.short)
    strategy.exit("Exit Sell", "Sell", profit=close * (50 - profitTarget / 100))

if (oppositeShortConditionMA)
    strategy.entry("Buy", strategy.long)
    strategy.exit("Exit Buy", "Buy", profit=close * (20 + profitTarget / 100))

// Plot Moving Averages
plot(maShort, color=color.blue, title="Short MA")
plot(maLong, color=color.red, title="Long MA")

// Plot Stochastic
hline(stochOverbought, "Overbought", color=color.red)
hline(stochOversold, "Oversold", color=color.green)
plot(k, color=color.black, title="Stochastic %K")
- 볼링거 밴드, RSI 및 이동 평균에 기초한 트렌드 다음 전략
- MACD 지표에 기초한 트렌드 거래 전략
- 이중 필터와 함께 스토카스틱 & 이동 평균 전략
- 스톡 RSI 기반 트렌드 전략
- 단일 포인트 이동 평균의 브레이크업 전략
- 이동 평균 크로스오버 전략
- 슈퍼 트렌드 전략
- 패러볼릭 기간 및 볼린거 대역 결합 이동 스톱 손실 전략
- 이동 평균 가격 기반 거래 전략
- 에르고틱 모멘텀 방향 컨버전스 거래 전략
- 지표 조합에 기반한 전략을 따라 이중 이동 평균 트렌드의 최적화
- 효율적인 양상 거래 전략
- 이중 이동 평균 크로스오버와 윌리엄스 지표 조합 전략
- 동력 돌파구 은선 전략
- RWI 변동성 반대 전략
- 패러볼릭 SAR 트렌드 추적 스톱 로스 역전 전략
- 동력 지표 크로스오버 전략
- 효율적인 오스실레이션 돌파구 두 개의 스톱 이윤 및 스톱 손실 전략
- 이중 채널 탈출 전략
- 실시간 K-라인 추적에 기반한 그리드 거래 전략