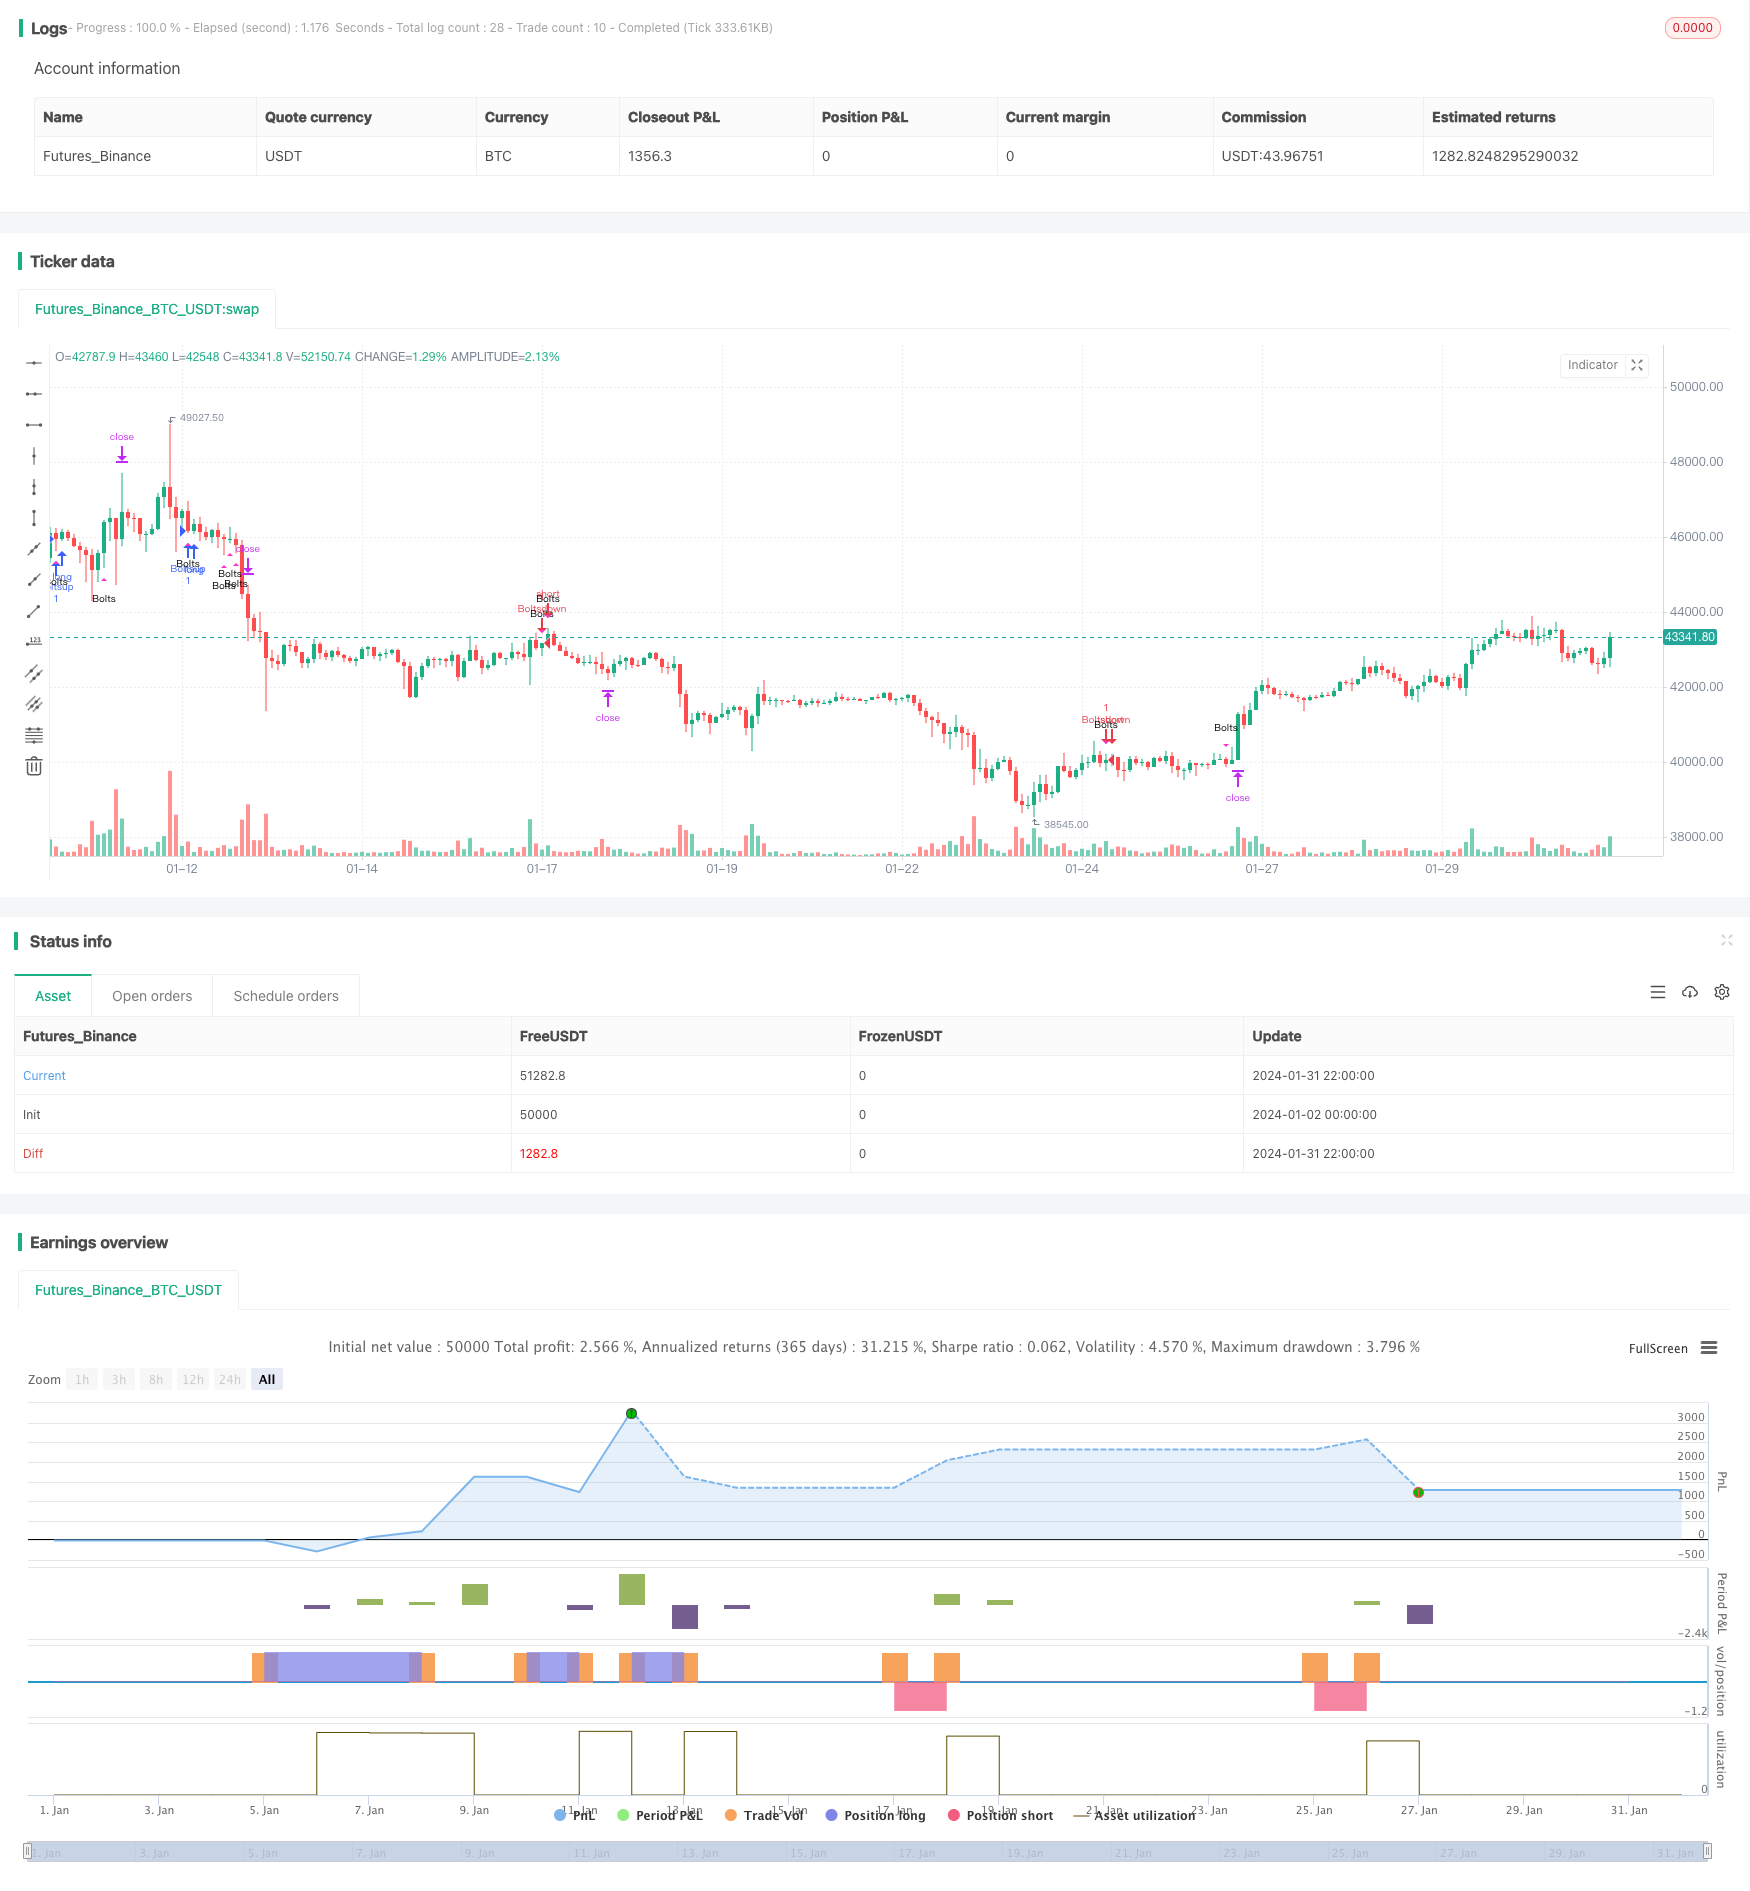
눈부신 볼트 트렌드 전략
저자:차오장, 날짜: 2024-02-02 17:30:09태그:

전반적인 설명
이 전략은
전략 논리
이 전략은 다음 세 가지 이동 평균을 사용합니다.
- 단기 트렌드를 측정하기 위한 13개 기간 중화 이동 평균
- 중장기 트렌드를 나타내는 55기 지수 이동 평균
- 장기 트렌드를 나타내는 110주기 간단한 이동 평균
빠른 선이 중간 선 위에 넘어가고 중간 선이 느린 선 위에 넘어가면 상승 추세를 나타냅니다. 빠른 선이 중간 선 아래로 넘어가고 중간 선이 느린 선 아래로 넘어가면 하락 추세를 나타냅니다.
소음 산업의 일부를 필터링하기 위해 몇 가지 보조 조건이 설정됩니다.
- 지난 5개의 촛불의 낮은 가격은 모두 중간선 이상이었다
- 마지막 2개의 촛불의 낮은 가격은 중간선 아래로 떨어졌습니다.
- 마지막 촛불의 폐쇄 가격은 중간선 이상이었다
이 기준이 충족되면, 긴 또는 짧은 신호가 트리거됩니다. 그것은 매번 한 개의 위치를만 유지하며 기존 위치가 닫히거나 중단 될 때까지 다시 들어갈 수 없습니다.
목표와 정지는 ATR 값의 몇 배에 따라 설정됩니다.
이점 분석
이 전략의 장점은 다음과 같습니다.
- 3개의 이동 평균을 조합하면 하나의 지표에서 잘못된 판단의 가능성을 피할 수 있습니다.
- 여러 가지 보조 조건은 소음을 필터링함으로써 신호 품질을 향상시키는 데 도움이됩니다.
- 동적 ATR 스톱 로즈는 단일 거래 손실을 조절하는 데 도움이 됩니다.
위험 분석
이 전략의 위험은 또한 다음을 포함합니다.
- 이동 평균 조합은 잘못된 신호를 줄 수 있어 충분한 역 테스트가 필요할 수 있습니다.
- 부적절한 ATR 멀티플리케이터 설정으로 인해 스톱이 너무 느슨하거나 단단해질 수 있습니다.
- 급격한 사건으로부터 가격 변동을 효과적으로 필터링할 수 없습니다.
위험을 줄이기 위해 이동 평균 매개 변수를 적절히 조정하고 ATR 곱셈을 최적화하고 과도한 단일 거래 손실을 피하기 위해 최대 보유 기간을 설정하십시오.
최적화 방향
이 전략에 대한 가능한 최적화:
- 다른 길이 또는 유형의 이동 평균을 테스트합니다.
- 보조 조건의 매개 변수를 최적화합니다.
- 트렌드 예측을 위해 다른 지표를 시도하십시오. 예를 들어 MACD, DMI 등.
- 신호를 필터링하기 위해 볼륨 표시기를 포함합니다.
요약
/*backtest
start: 2024-01-02 00:00:00
end: 2024-02-01 00:00:00
period: 2h
basePeriod: 15m
exchanges: [{"eid":"Futures_Binance","currency":"BTC_USDT"}]
*/

// This source code is subject to the terms of the Mozilla Public License 2.0 at https://mozilla.org/MPL/2.0/
// © greenmask9

//@version=4
strategy("Dazzling Bolts", overlay=true)
//max_bars_back=3000

// 13 SMMA
len = input(10, minval=1, title="SMMA Period")
src = input(close, title="Source")
smma = 0.0
smma := na(smma[1]) ? sma(src, len) : (smma[1] * (len - 1) + src) / len

// 55 EMA
emalength = input(55, title="EMA Period")
ema = ema(close, emalength)

// 100 SMA
smalength = input(110, title="SMA Period")
sma = sma(close, smalength)

emaforce = input(title="Force trend with medium EMA", type=input.bool, defval=true)
offsetemavalue = input(defval = 6)

bullbounce = smma>ema and ema>sma and low[5]>ema and low[2]<ema and close[1]>ema and (ema[offsetemavalue]>sma or (not emaforce))
bearbounce = smma<ema and ema<sma and high[5]<ema and high[2]>ema and close[1]<ema and (ema[offsetemavalue]<sma or (not emaforce))
plotshape(bullbounce,  title= "Purple", location=location.belowbar, color=#ff33cc, transp=0, style=shape.triangleup, size=size.tiny, text="Bolts")
plotshape(bearbounce,  title= "Purple", location=location.abovebar, color=#ff33cc, transp=0, style=shape.triangledown, size=size.tiny, text="Bolts")
strategy.initial_capital = 50000
ordersize=floor(strategy.initial_capital/close)
longs = input(title="Test longs", type=input.bool, defval=true)
shorts = input(title="Test shorts", type=input.bool, defval=true)
atrlength = input(title="ATR length", defval=12)
atrm = input(title="ATR muliplier",type=input.float, defval=2)
atr = atr(atrlength)

target = close + atr*atrm
antitarget = close - (atr*atrm)

//limits and stop do not move, no need to count bars from since

bullbuy = bullbounce and longs and strategy.opentrades==0
bb = barssince(bullbuy)
bearsell = bearbounce and shorts and strategy.opentrades==0
bs = barssince(bearsell)

if (bullbuy)
    strategy.entry("Boltsup", strategy.long, ordersize)
    strategy.exit ("Bolts.close", from_entry="Boltsup", limit=target, stop=antitarget)
if (crossover(smma, sma))
    strategy.close("Boltsup", qty_percent = 100, comment = "Bolts.crossover")

if (bearsell)
    strategy.entry("Boltsdown", strategy.short, ordersize)
    strategy.exit("Bolts.close", from_entry="Boltsdown", limit=antitarget, stop=target)
if (crossunder(smma, sma))
    strategy.close("Boltsdown", qty_percent = 100, comment = "Bolts.crossover")

// if (bb<5)
//     bulltarget = line.new(bar_index[bb], target[bb], bar_index[0], target[bb], color=color.blue, width=2)
//     bullclose = line.new(bar_index[bb], close[bb], bar_index[0], close[bb], color=color.blue, width=2)
//     bullstop = line.new(bar_index[bb], antitarget[bb], bar_index[0], antitarget[bb], color=color.blue, width=2)
// if (bs<5)
//     bulltarget = line.new(bar_index[bs], antitarget[bs], bar_index[0], antitarget[bs], color=color.purple, width=2)
//     bullclose = line.new(bar_index[bs], close[bs], bar_index[0], close[bs], color=color.purple, width=2)
//     bullstop = line.new(bar_index[bs], target[bs], bar_index[0], target[bs], color=color.purple, width=2)
- 멀티 타임프레임 이치모쿠, MACD 및 DMI 결합 전략
- 가격차이에 기반한 트렌드 거래 전략
- 슈퍼트렌드 비트코인 장선 전략
- 이동 평균 및 촛불 패턴을 가진 트렌드를 따르는 전략
- 이치모쿠 클라우드 브레이크와 ADX 인덱스에 기반한 양적 거래 전략
- 볼링거 밴드와 이동 평균의 조합 전략
- 게으른 곰 압축 모멘텀 전략
- 트렌드 예측 이중 이동 평균 전략
- 이중 이동 평균 역전 전략
- 이중 돌파구 이동 평균 거래 전략
- VRSI 및 MARSI 전략
- 도지 패턴에 기반한 손해를 멈추고 수익을 취하는 전략
- 이중 기하급수적 이동 평균 트렌드 전략
- DMI 잔액 구매/판매 전략
- 이동 평균 이동 봉투 전략
- 시장 잠재력 이치모쿠 상승 구름 전략
- 전략에 따른 EMA RSI 숨겨진 격차 추세
- 포용 패턴과 양적 지표에 기초한 고급 트렌드 추적 전략
- 알파트렌드 이중 추적 전략
- 피셔 유리크 후속 정지 전략