RSI와 MA의 크로스오버 트렌드 추적 전략
저자:차오장, 날짜: 2024-02-20 15:31:15태그:

전반적인 설명
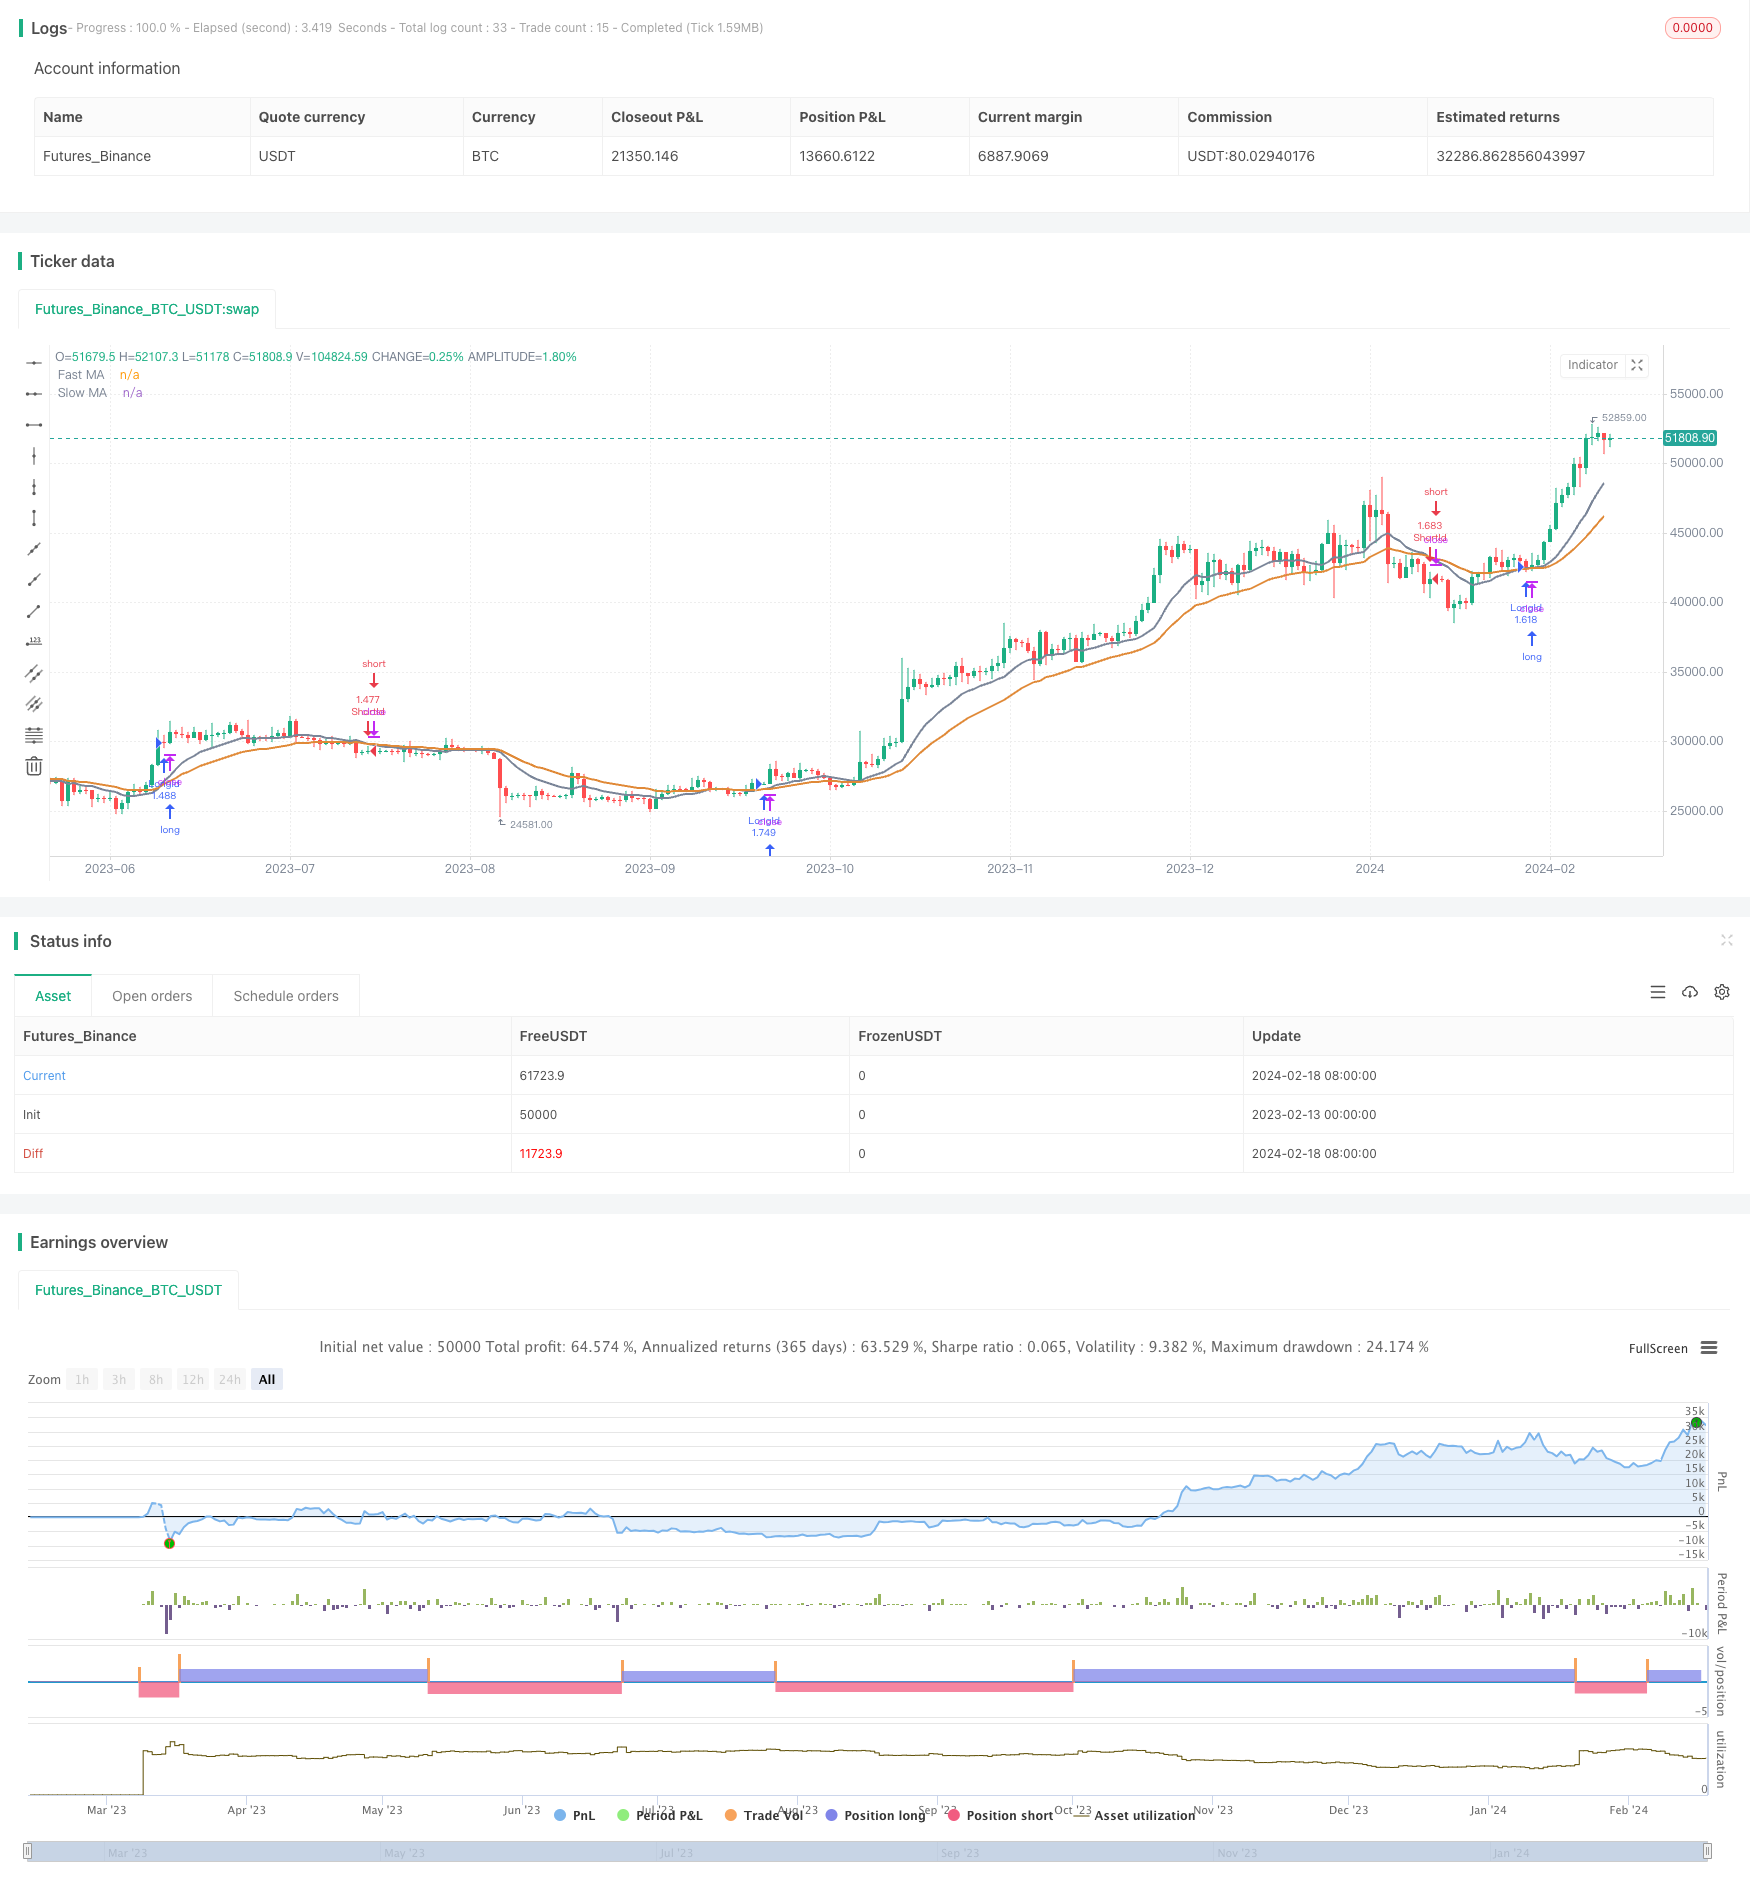
이 전략은 RSI 지표와 서로 다른 기간의 두 이동 평균 (MA) 의 교차로 시장 추세와 진입 신호를 결정합니다. RSI가 26 기간 MA 이상일 때만 길고 RSI가 위험을 제어하기 위해 낮을 때 짧습니다.
전략 논리
이 전략은 12 및 26 기간의 두 MA를 사용한다. 12 기간 빠른 MA가 26 기간 느린 MA를 넘을 때 상승 추세를 나타냅니다. 그 반대도 마찬가지입니다. 이 전략은 금색 크로스오버에서 길고 두 MA의 죽음의 크로스오버에서 짧습니다.
RSI 지표는 또한 과잉 구매 / 과잉 판매 구역을 결정하는 데 사용됩니다. RSI가 26 기간 MA보다 높을 때만 전략은 골든 크로스오버에 긴 포지션을 열 수 있습니다. 그리고 RSI가 낮을 때만 죽음의 크로스오버에 짧은 포지션을 열 수 있습니다. 이것은 과잉 구매 / 과잉 판매 상황에 대한 강제 입력을 피하고 따라서 위험을 제어합니다.
이점 분석
트렌드 및 타이밍 분석을 위해 MAs와 RSI를 결합함으로써이 전략은 트렌드를 효과적으로 추적 할 수 있습니다. RSI 필터는 거래 빈도를 줄이고 범위 시장에서 윙사우를 피합니다. 스톱 로스를 사용하지 않으면 더 높은 수익을 위해 트렌드를 완전히 따라갈 수 있습니다.
위험 분석
스톱 손실이 없으면 잘못된 신호에 손실이 증폭 될 수 있습니다. 큰 간격 움직임은 또한 큰 손실로 이어질 수 있습니다. 또한 RSI 필터를 올바르게 설정하지 않으면 좋은 입문 신호가 빠질 수 있습니다.
최대 손실을 제어하기 위해 스톱 로스를 사용하는 것을 고려하십시오. 더 나은 필터를 위해 RSI 매개 변수를 세밀하게 조정하십시오. 변동성 시장에서 추세를 판단하기 위해 느린 MA를 사용하십시오.
최적화 방향
이 전략은 다음과 같은 측면에서 개선될 수 있습니다.
-
현재 시장 조건에 가장 적합한 매개 변수를 찾기 위해 다른 기간의 MA 조합을 테스트합니다.
-
RSI 기간과 필터 논리를 최적화하여 더 나은 출입 시기를 얻습니다.
-
더 나은 시스템 안정성을 위해 부피와 같은 다른 지표를 추가합니다.
-
트렌드 따라와 위험 통제를 균형을 맞추기 위해 스톱 로스 전략을 최적화하십시오. 예를 들어, 트레일링 스톱, 퍼센트 스톱, 동적 스톱 등.
결론
전략은 상대적으로 간단하고 직설적이며, 트렌드를 결정하고 강제 입력을 피하기 위해 RSI를 사용하여 MA 크로스오버를 사용하여 좋은 수익을위한 트렌드를 추적합니다. 파라미터 조정 및 복잡한 시장 환경에 맞는 다른 필터를 추가하여 추가 개선이 가능합니다.
/*backtest
start: 2023-02-13 00:00:00
end: 2024-02-19 00:00:00
period: 1d
basePeriod: 1h
exchanges: [{"eid":"Futures_Binance","currency":"BTC_USDT"}]
*/

//@version=2

strategy(title = "EMA Cross Strategy", shorttitle = "EMA Cross",calc_on_order_fills=true,calc_on_every_tick =true, initial_capital=21000,commission_value=.25,overlay = true,default_qty_type = strategy.percent_of_equity, default_qty_value = 100)
StartYear = input(2018, "Backtest Start Year")
StartMonth = input(1, "Backtest Start Month")
StartDay = input(1, "Backtest Start Day")
UseStopLoss = input(false,"UseStopLoss")
//rsiLong = true
rsi1 = rsi(close, 14)

window() => true

stopLoss = input(20, title = "Stop loss percentage(0.1%)")
//stopLoss = input(200, title = "Stop loss percentage(0.1%)")

maFastSource   = input(defval = open, title = "Fast MA Source")
maFastLength   = input(defval = 12, title = "Fast MA Period", minval = 1)
// long ma
maSlowSource   = input(defval = open, title = "Slow MA Source")
maSlowLength   = input(defval = 26, title = "Slow MA Period", minval = 1)

maFast = ema(maFastSource, maFastLength)
maSlow = ema(maSlowSource, maSlowLength)

//12 and 26=9%; 3 and8=2%; 26 and 55=2%; when selling on a cross under
//maFastRSI = ema(rsi1, 12)
//maSlowRSI = ema(rsi1, 26)

fast = plot(maFast, title = "Fast MA", color = #7a8598, linewidth = 2, style = line, transp = 50)
slow = plot(maSlow, title = "Slow MA", color = #e08937, linewidth = 2, style = line, transp = 50)


longEMA = crossover(maFast, maSlow)
exitLong = crossunder(maFast, maSlow) // 5% in 2018
//exitLong = crossunder(close, maFast) // 15% in 2018
//exitLong = crossunder(rsi1, maFastRSI) // 13%

shortEMA = crossover(maSlow, maFast)
exitShort = crossover(maFast, maSlow)

//if (rsi1 < ema(rsi1,7))
//rsiLong = false

//if (longEMA and (rsi1 >= highest(rsi1,10)))
//if (longEMA)
if (longEMA and (rsi1 > ema(rsi1,26)))  //RSI ema values optimal from 19 to 35
    strategy.entry("LongId", strategy.long, when=window())

//strategy.close_all(when = rsi1 > 60) // 80=26%, 90=n/a, 70=15%, 60=16% long only
//strategy.close_all(when = (shortEMA and (rsi1 <= ema(rsi1,26)))) //10% gain in 2018 long only
//strategy.close_all(when = (rsi1 <= ema(rsi1,120))) //26=17% 14=2% 42=15%
//strategy.close_all(when = (shortEMA)) // 5% gain in 2018 long only
//strategy.close_all(when = exitLong)

//if (shortEMA and not(rsiLong))
//if (shortEMA)
if (shortEMA and (rsi1 <= ema(rsi1,26)))
    strategy.entry("ShortId", strategy.short, when=window())

if (UseStopLoss)
    strategy.exit("StopLoss", "LongId", loss = close * stopLoss / 1000 / syminfo.mintick)
    strategy.exit("StopLoss", "ShortId", loss = close * stopLoss / 1000 / syminfo.mintick)
- 볼링거 밴드 역전 전략
- 이치모쿠 킨코 히오 클라우드 + QQE 양적 전략
- 금에 대한 손해를 멈추는 동력 거래 전략에 관한 모든 것
- 패러볼 오시레이터 고도와 하위 전략을 찾는
- 볼링거 밴드 브레이크업 전략
- 획기적인 공정 가치 격차 전략
- 모멘텀 브레이크와 함께 적응적인 이동 평균 크로스오버 시스템
- 피크에서 피크 패턴에 기반한 거래 전략
- 다중 EMA 구매 전략
- OBV EMA 크로스오버 트렌드 전략
- 이중 확인과 함께 역동 동력 전략
- EMA의 크로스오버 긴 라인 양자 전략
- 극심한 반전 추적 전략
- Bollinger Band Mean Reversal 전략과 함께 Intraday Intensity Index
- B-Xtrender 기하급수적인 이동 평균 크로스오버 전략
- 이동 평균 트렌드 추적 전략
- 이동 평균 및 MACD와 결합된 RSI 전략
- EMA, RSI 및 MACD 기반의 멀티 타임프레임 거래 전략
- 피보트 포인트에 기초한 피보트 역전량 전략
- 세 가지 색상 크로스 트렌드 추적 전략