다주파량 모멘텀 역전량 전략 시스템
저자:차오장, 날짜: 2024-11-29 14:47:54태그:

전반적인 설명
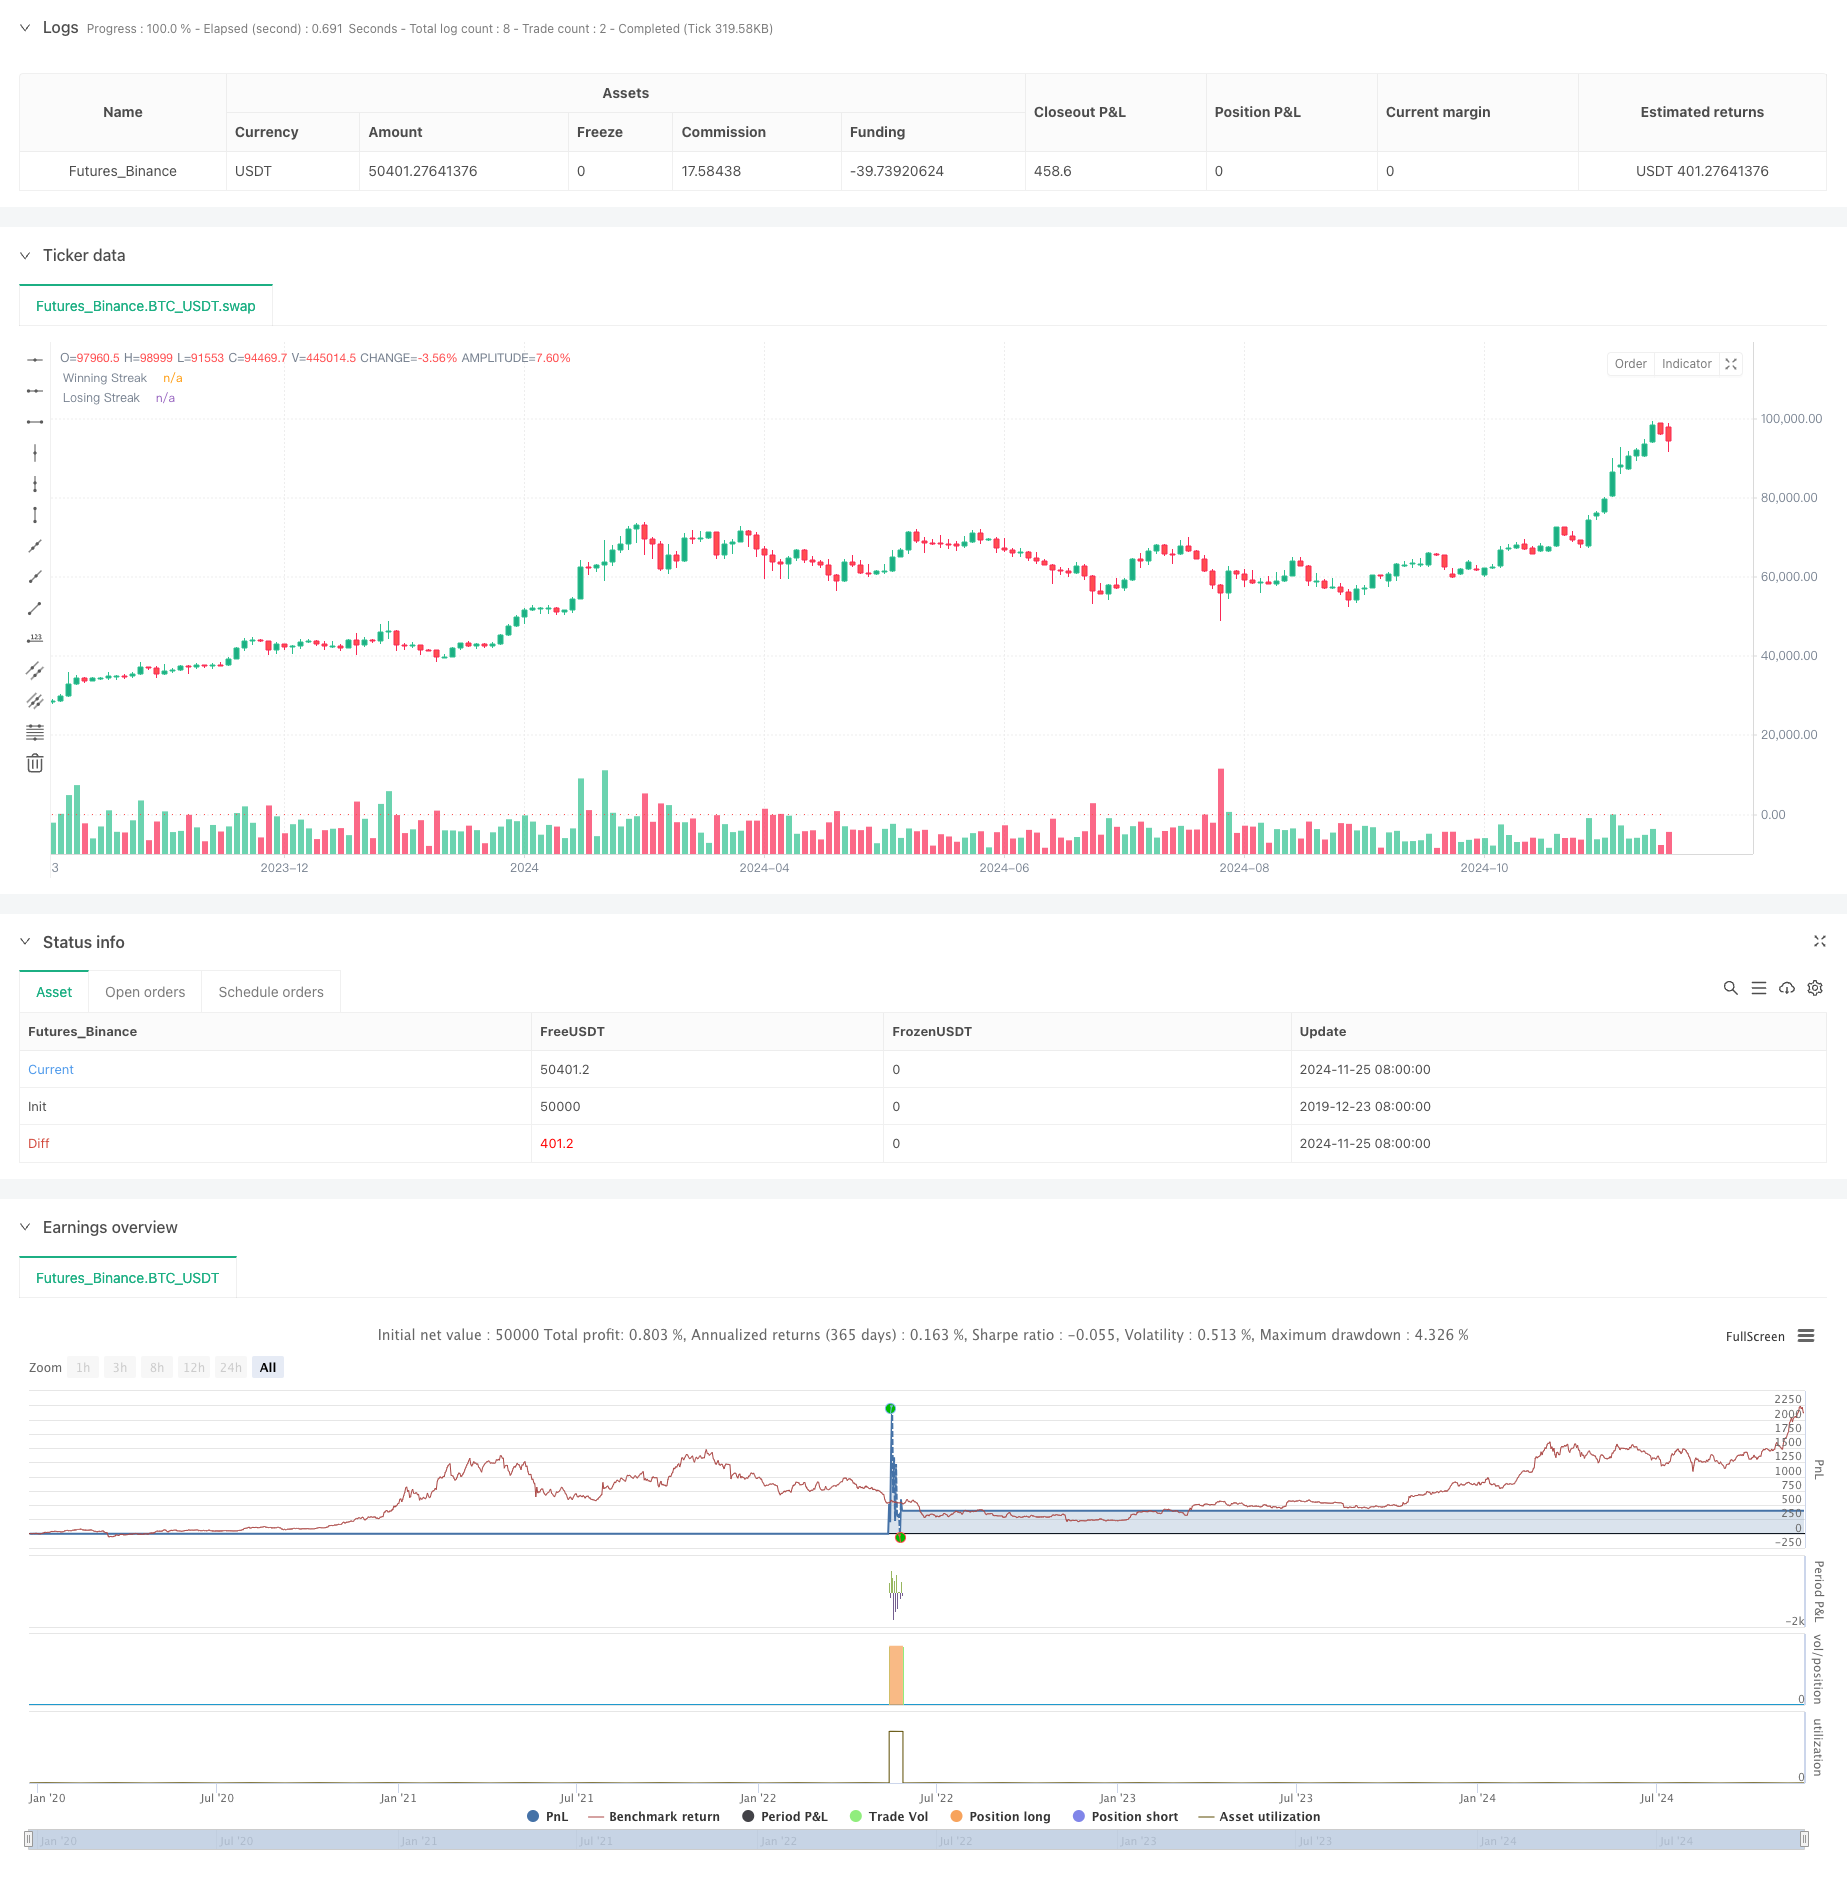
이 전략은 시장의 연속적인 움직임 특성에 기반한 양적 거래 시스템으로, 연속적인 가격 상승 또는 하락의 주파수를 분석하여 시장 반전 기회를 포착합니다. 전략의 핵심은 연속적인 움직임에 대한 미리 설정된 임계 수준에 도달하면 역행 조치를 취하는 것입니다. 거래 결정을위한 보유 기간 및 촛불 패턴과 같은 여러 차원을 결합합니다.
전략 원칙
핵심 논리는 몇 가지 핵심 요소를 포함합니다.
- 스트리크 카운팅: 시스템은 연속적인 가격 상승과 하락을 지속적으로 추적하여 미리 설정된 임계치와 비교합니다.
- 거래 방향 선택: 사용자는 긴 포지션과 짧은 포지션 사이에서 선택할 수 있으며, 긴 포지션의 손실 연속과 짧은 포지션의 승리 연속에 초점을 맞출 수 있습니다.
- 보유 기간 관리: 과도한 보유를 피하기 위해 고정된 보유 기간을 자동으로 포지션 종료로 설정합니다.
- 도지 필터링: 시장 변동 중에 잘못된 신호를 필터하기 위해 도지 촛불 분석을 포함합니다.
- 포지션 컨트롤: 스케일링 또는 부분적인 포지션 구축 없이 단일 포지션 거래를 이용합니다.
전략적 장점
- 명확한 논리: 거래 논리는 직관적이고 이해하기 쉽고 실행하기 쉽습니다.
- 통제된 위험: 위험은 고정된 보유 기간과 단일 포지션 통제를 통해 관리됩니다.
- 높은 적응력: 매개 변수를 다른 시장 특성에 따라 조정할 수 있습니다.
- 높은 자동화: 완전히 시스템 실행, 인간의 개입을 줄입니다.
- 다차원 분석: 가격 추세, 촛불 패턴 및 다른 차원을 결합합니다.
전략 위험
- 트렌드 지속 위험: 강한 트렌드 시장에서 잠재적인 잘못된 판단.
- 매개 변수 감수성 (parameter sensitivity): 임계 및 보유 기간 설정에 의해 직접적으로 영향을 받는 전략 성과.
- 시장 환경 의존성: 변동 시장에서 좋은 성과를 거두지만 일방 시장에서 종종 손실 할 수 있습니다.
- 미끄러짐 영향: 고주파 거래는 미끄러짐에 의해 영향을받을 수 있습니다.
- 비용 압력: 빈번한 거래는 높은 거래 비용을 발생시킵니다.
전략 최적화 방향
- 변동성 지표를 포함: ATR 같은 지표를 사용하여 임계치를 조정합니다.
- 트렌드 필터링 추가: 장기 트렌드 분석을 통합함으로써 승률을 향상시킵니다.
- 동적 보유 기간: 시장 특성에 따라 보유 기간을 조정합니다.
- 위치 관리 최적화: 동적 위치 관리 메커니즘을 도입합니다.
- 멀티 타임프레임 분석: 멀티 페리오드 신호 확인 메커니즘을 추가합니다.
결론
이 전략은 시장 반전 특성을 기반으로 한 양적 거래 시스템으로 지속적인 가격 움직임의 분석을 통해 반전 기회를 포착합니다. 전략 설계는 통제 된 위험과 합리적이지만 시장 조건에 따라 매개 변수 조정이 필요합니다. 지속적인 최적화 및 개선으로이 전략은 실제 거래에서 안정적인 수익을 얻을 수 있습니다. 실제 구현 전에 철저한 역사적 데이터 백테스팅을 수행하고 데모 거래에서 전략의 효과를 확인하는 것이 좋습니다.
/*backtest
start: 2019-12-23 08:00:00
end: 2024-11-27 08:00:00
period: 2d
basePeriod: 2d
exchanges: [{"eid":"Futures_Binance","currency":"BTC_USDT"}]
*/

//@version=5
strategy("Streak-Based Trading Strategy", overlay=true)

// User Inputs
trade_direction = input.string(title="Trade Direction", defval="Long", options=["Long", "Short"]) // Option to choose Long or Short
streak_threshold = input.int(title="Streak Threshold", defval=8, minval=1) // Input for number of streaks before trade
hold_duration = input.int(title="Hold Duration (in periods)", defval=7, minval=1) // Input for holding the position
doji_threshold = input.float(0.01, title="Doji Threshold (%)", minval=0.001) / 100 // Doji sensitivity

// Calculate win or loss streak
is_doji = math.abs(close - open) / (high - low) < doji_threshold
win = close > close[1] and not is_doji
loss = close < close[1] and not is_doji

// Initialize variables for streak counting
var int win_streak = 0
var int loss_streak = 0
var bool in_position = false
var int hold_counter = 0

// Track streaks (only when not in a position)
if not in_position
    if win
        win_streak += 1
        loss_streak := 0
    else if loss
        loss_streak += 1
        win_streak := 0
    else
        win_streak := 0
        loss_streak := 0

// Logic for closing the position after the holding duration
if in_position
    hold_counter -= 1
    if hold_counter <= 0
        strategy.close_all() // Close all positions
        in_position := false // Reset position flag
        win_streak := 0 // Reset streaks after position is closed
        loss_streak := 0

// Trade condition (only when no position is open and streak is reached)
if not in_position
    if trade_direction == "Long" and loss_streak >= streak_threshold
        strategy.entry("Long", strategy.long) // Open a long position
        in_position := true
        hold_counter := hold_duration // Set holding period

    if trade_direction == "Short" and win_streak >= streak_threshold
        strategy.entry("Short", strategy.short) // Open a short position
        in_position := true
        hold_counter := hold_duration // Set holding period

// Plotting streaks for visualization
plot(win_streak, color=color.green, title="Winning Streak", style=plot.style_histogram, linewidth=2)
plot(loss_streak, color=color.red, title="Losing Streak", style=plot.style_histogram, linewidth=2)
더 많은
- RSI 모멘텀 전략과 함께 멀티 MA 트렌드를 따르고 있습니다.
- 다단계 피보나치 EMA 트렌드 다음 전략
- 트렌드를 따르는 격차 브레이크오웃 거래 시스템
- 이중 EMA 크로스오버 트렌드 위험 관리 및 시간 필터링 시스템으로 전략을 따르는 것
- 이중 평형 이동 평균 트렌드 다음 전략 - 수정 된 하이킨-아시에 기초
- MACD 다중 간격 동적 스톱 로스 및 영업 영업 시스템
- 스토카스틱 RSI 및 촛불 확인과 함께 동적 거래 시스템
- ATR 기반 리스크 관리 시스템과 전략에 따른 이중 이동 평균 트렌드
- 다기술 지표 동적 적응 거래 전략 (MTDAT)
- 적응형 FVG 탐지 및 동적 저항과 함께 MA 트렌드 거래 전략
- 이중 EMA 크로스오버 및 리스크 관리와 함께 자동화된 양적 거래 시스템
- 이중SMA 동적 트렌드 스마트 리스크 관리 전략
- KNN 기반 적응 파라미터 트렌드 전략
- EMA 변동성 대역에 기반한 거래 시스템을 따르는 다기류 트렌드
- 재검토 시스템 무작위 거래 생성기
- 다중 시간 프레임 EMA 크로스 높은 수익률 트렌드 전략 (첨단)
- 거래 전략에 따른 적응 범위 변동성 경향
- 리스크/보상비율 최적화 전략과 함께 거래 시스템을 따르는 이중 이동 평균 트렌드
- 이동 평균 크로스오버 및 촛불 패턴 스마트 타이밍 전략
- 동적 이중 이동 평균 크로스오버 양적 거래 전략