概述
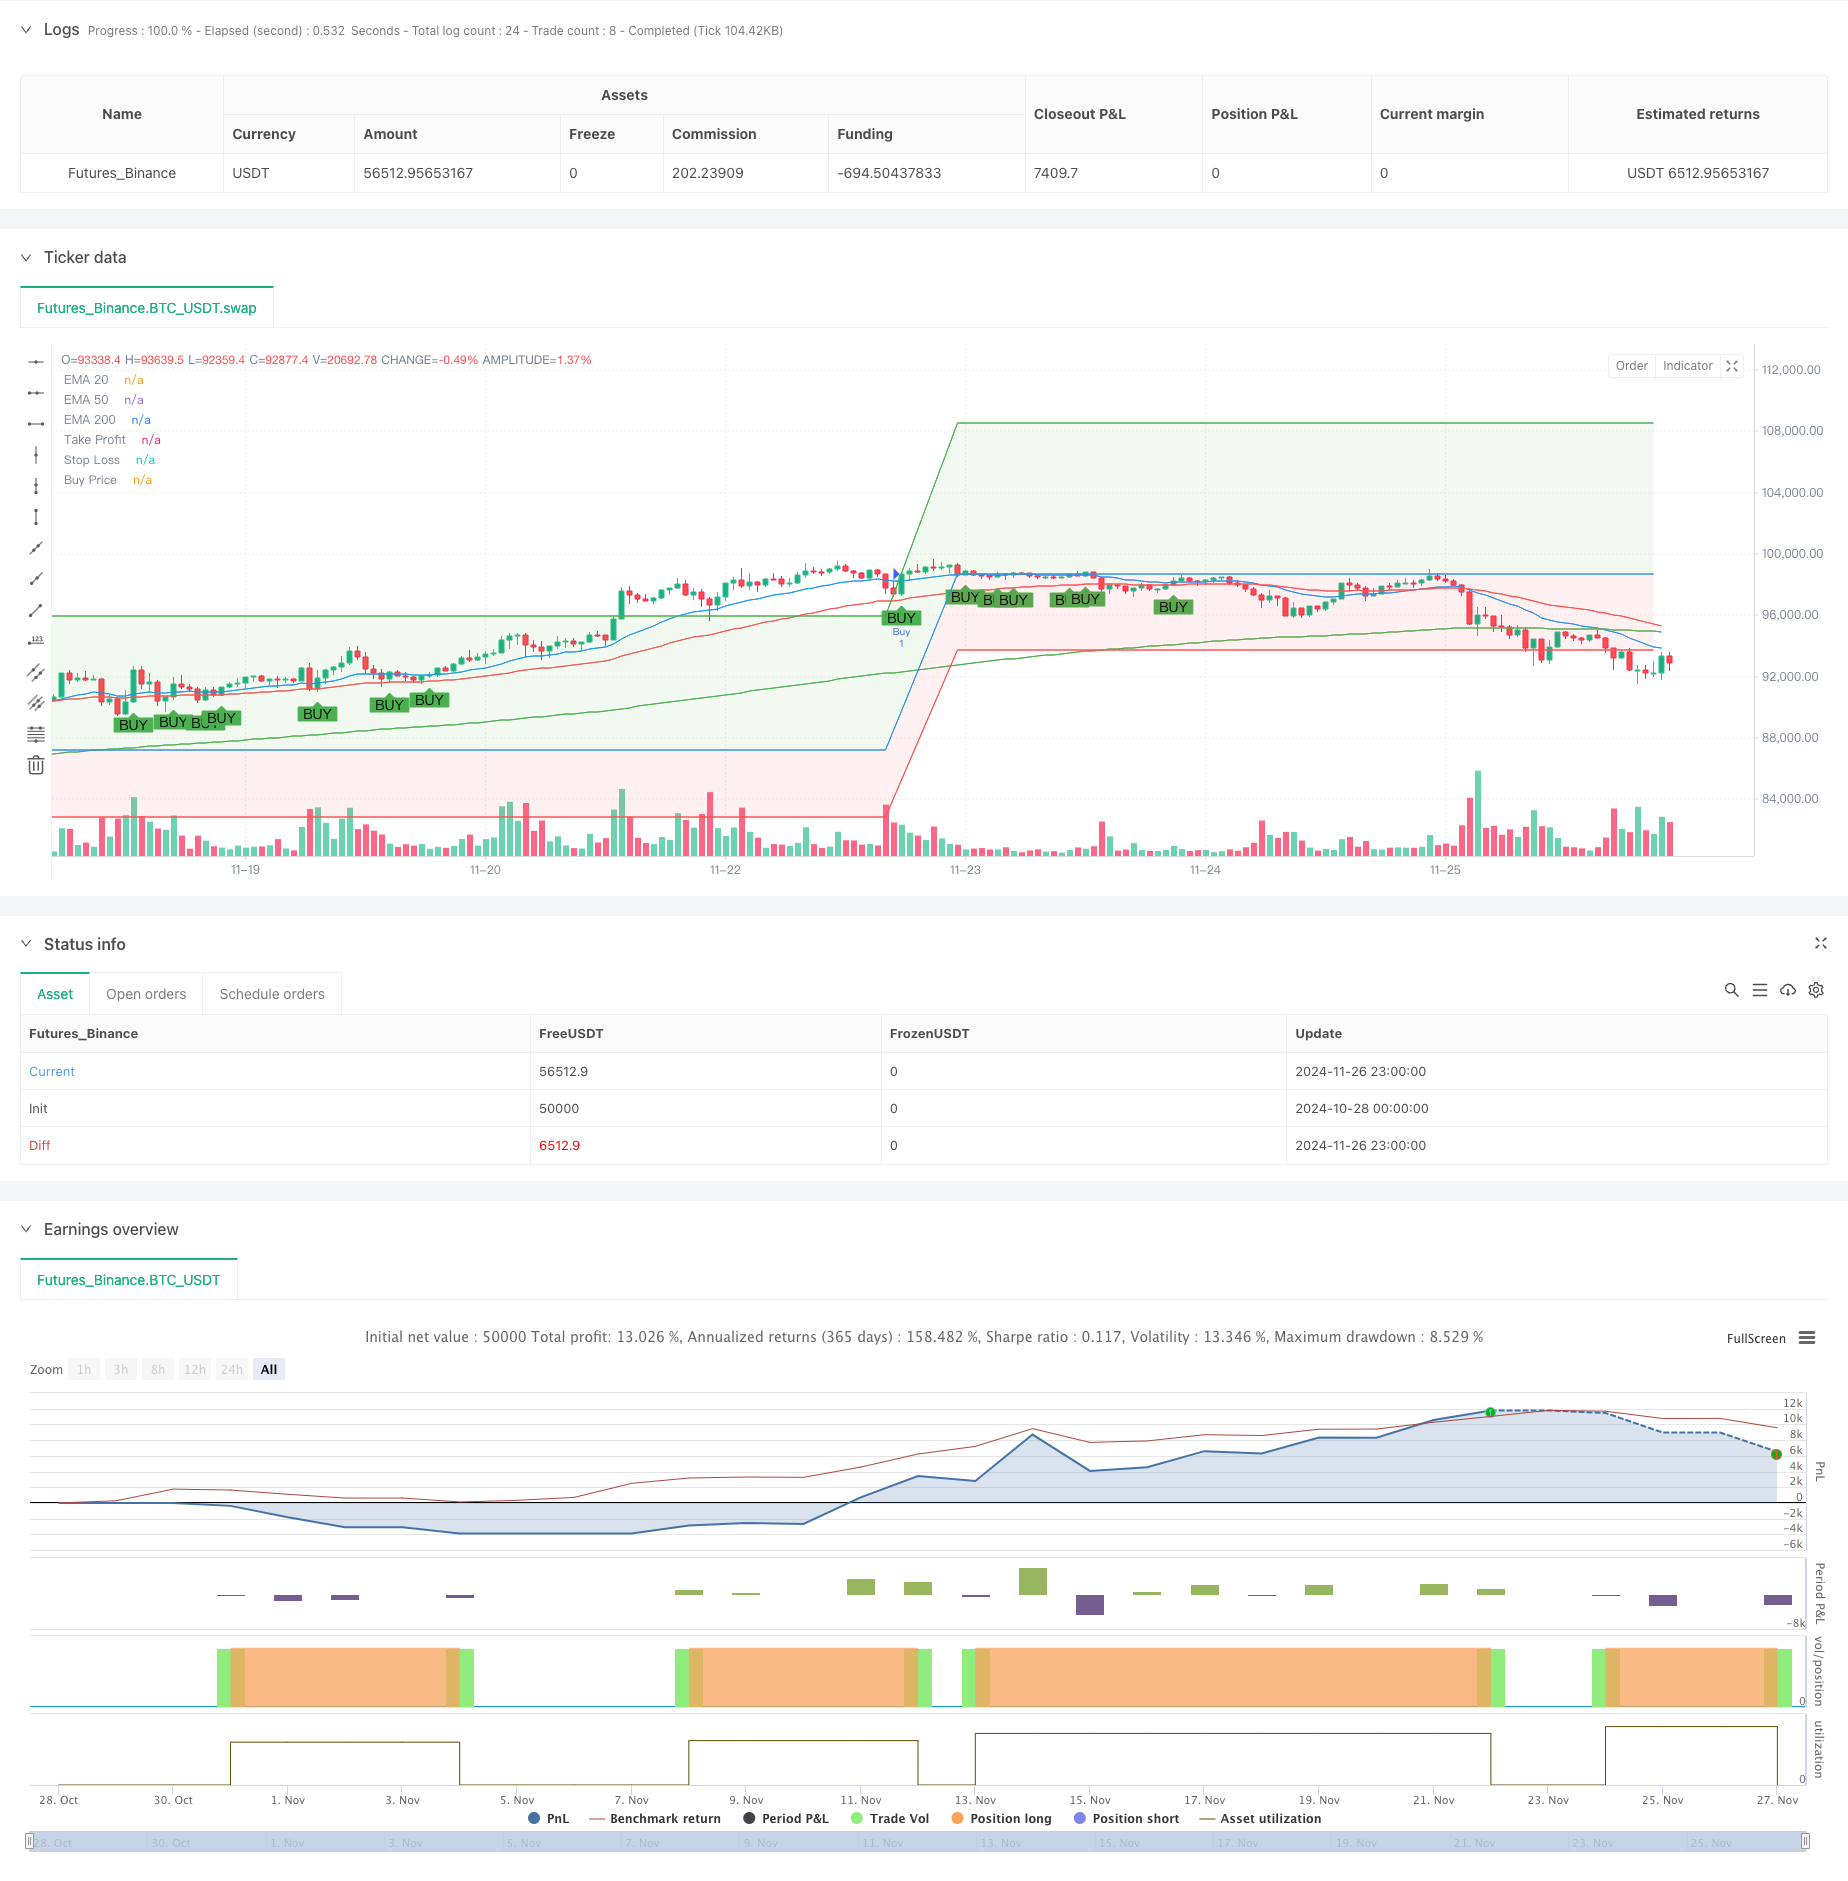
这是一个基于多周期均线交叉的趋势跟踪策略。策略主要依据20、50和200周期指数移动平均线(EMA)的交叉关系及价格与均线的关系来判断入场时机,同时设置了基于百分比的止盈止损来控制风险。该策略特别适用于较大的时间周期,如1小时、日线和周线图表,能有效捕捉中长期趋势性行情。
策略原理
策略的核心逻辑基于多重均线系统和价格行为分析: 1. 使用三条不同周期(20、50、200)的指数移动平均线构建趋势判断系统 2. 入场条件要求满足以下全部条件: - 价格突破并收于20周期EMA之上 - 20周期EMA位于50周期EMA之上 - 50周期EMA位于200周期EMA之上 3. 风险控制采用固定百分比方式: - 止盈设置在入场价格上方10%处 - 止损设置在入场价格下方5%处
策略优势
- 多重确认机制提高可靠性
- 通过三重均线和价格突破提供多重验证
- 避免虚假信号干扰
- 完善的风险控制体系
- 预设止盈止损位置
- 风险收益比合理(1:2)
- 适应性强
- 可应用于多个时间周期
- 特别适合中长期趋势交易
策略风险
- 横盘行情表现欠佳
- 在震荡市场可能频繁触发止损
- 建议在明确趋势时使用
- 滞后性风险
- 均线系统具有一定滞后性
- 可能错过一些行情起点
- 固定止盈止损限制
- 百分比固定可能不适合所有市场环境
- 建议根据波动率动态调整
策略优化方向
- 引入波动率指标
- 使用ATR动态调整止盈止损
- 提高策略对市场适应性
- 增加趋势强度过滤
- 添加ADX等趋势强度指标
- 提高入场信号质量
- 优化均线周期
- 根据不同市场特征调整均线参数
- 提供参数优化范围建议
总结
这是一个设计合理、逻辑清晰的趋势跟踪策略。通过多重技术指标的配合使用,既保证了策略的可靠性,又提供了清晰的风险控制方案。策略特别适合在大周期图表上运行,对于把握中长期趋势具有独特优势。通过建议的优化方向,策略还有进一步提升空间。建议交易者在实盘使用前,先在回测系统中充分测试,并根据具体交易品种特点适当调整参数。
策略源码
/*backtest
start: 2024-10-28 00:00:00
end: 2024-11-27 00:00:00
period: 1h
basePeriod: 1h
exchanges: [{"eid":"Futures_Binance","currency":"BTC_USDT"}]
*/

//@version=5
strategy("EMA Cross Strategy with Targets and Fill", overlay=true)

// Define EMAs
ema20 = ta.ema(close, 20)
ema50 = ta.ema(close, 50)
ema200 = ta.ema(close, 200)

// Plot EMAs (hidden)
plot(ema20, color=color.blue, title="EMA 20", display=display.none)
plot(ema50, color=color.red, title="EMA 50", display=display.none)
plot(ema200, color=color.green, title="EMA 200", display=display.none)

// Define the conditions
priceCrossAboveEMA20 = ta.crossover(close, ema20)
priceCloseAboveEMA20 = close > ema20
ema20AboveEMA50 = ema20 > ema50
ema50AboveEMA200 = ema50 > ema200

// Buy condition
buyCondition = priceCrossAboveEMA20 and priceCloseAboveEMA20 and ema20AboveEMA50 and ema50AboveEMA200

// Plot buy signals
plotshape(series=buyCondition, location=location.belowbar, color=color.green, style=shape.labelup, text="BUY")

// Declare and initialize variables for take profit and stop loss levels
var float longTakeProfit = na
var float longStopLoss = na
var float buyPrice = na

// Update levels and variables on buy condition
if (buyCondition)
    // Enter a new buy position
    strategy.entry("Buy", strategy.long)

    // Set new take profit and stop loss levels
    longTakeProfit := strategy.position_avg_price * 1.10  // Target is 10% above the buy price
    longStopLoss := strategy.position_avg_price * 0.95    // Stop loss is 5% below the buy price
    buyPrice := strategy.position_avg_price

// Plot levels for the new trade
plotTakeProfit = plot(longTakeProfit, color=color.green, title="Take Profit", linewidth=1, offset=-1)
plotStopLoss = plot(longStopLoss, color=color.red, title="Stop Loss", linewidth=1, offset=-1)
plotBuyPrice = plot(buyPrice, color=color.blue, title="Buy Price", linewidth=1, offset=-1)

// Fill areas between buy price and take profit/stop loss levels
fill(plotBuyPrice, plotTakeProfit, color=color.new(color.green, 90), title="Fill to Take Profit")  // Light green fill to target
fill(plotBuyPrice, plotStopLoss, color=color.new(color.red, 90), title="Fill to Stop Loss")    // Light red fill to stop loss

// Exit conditions
strategy.exit("Take Profit/Stop Loss", from_entry="Buy", limit=longTakeProfit, stop=longStopLoss)
相关推荐