概述
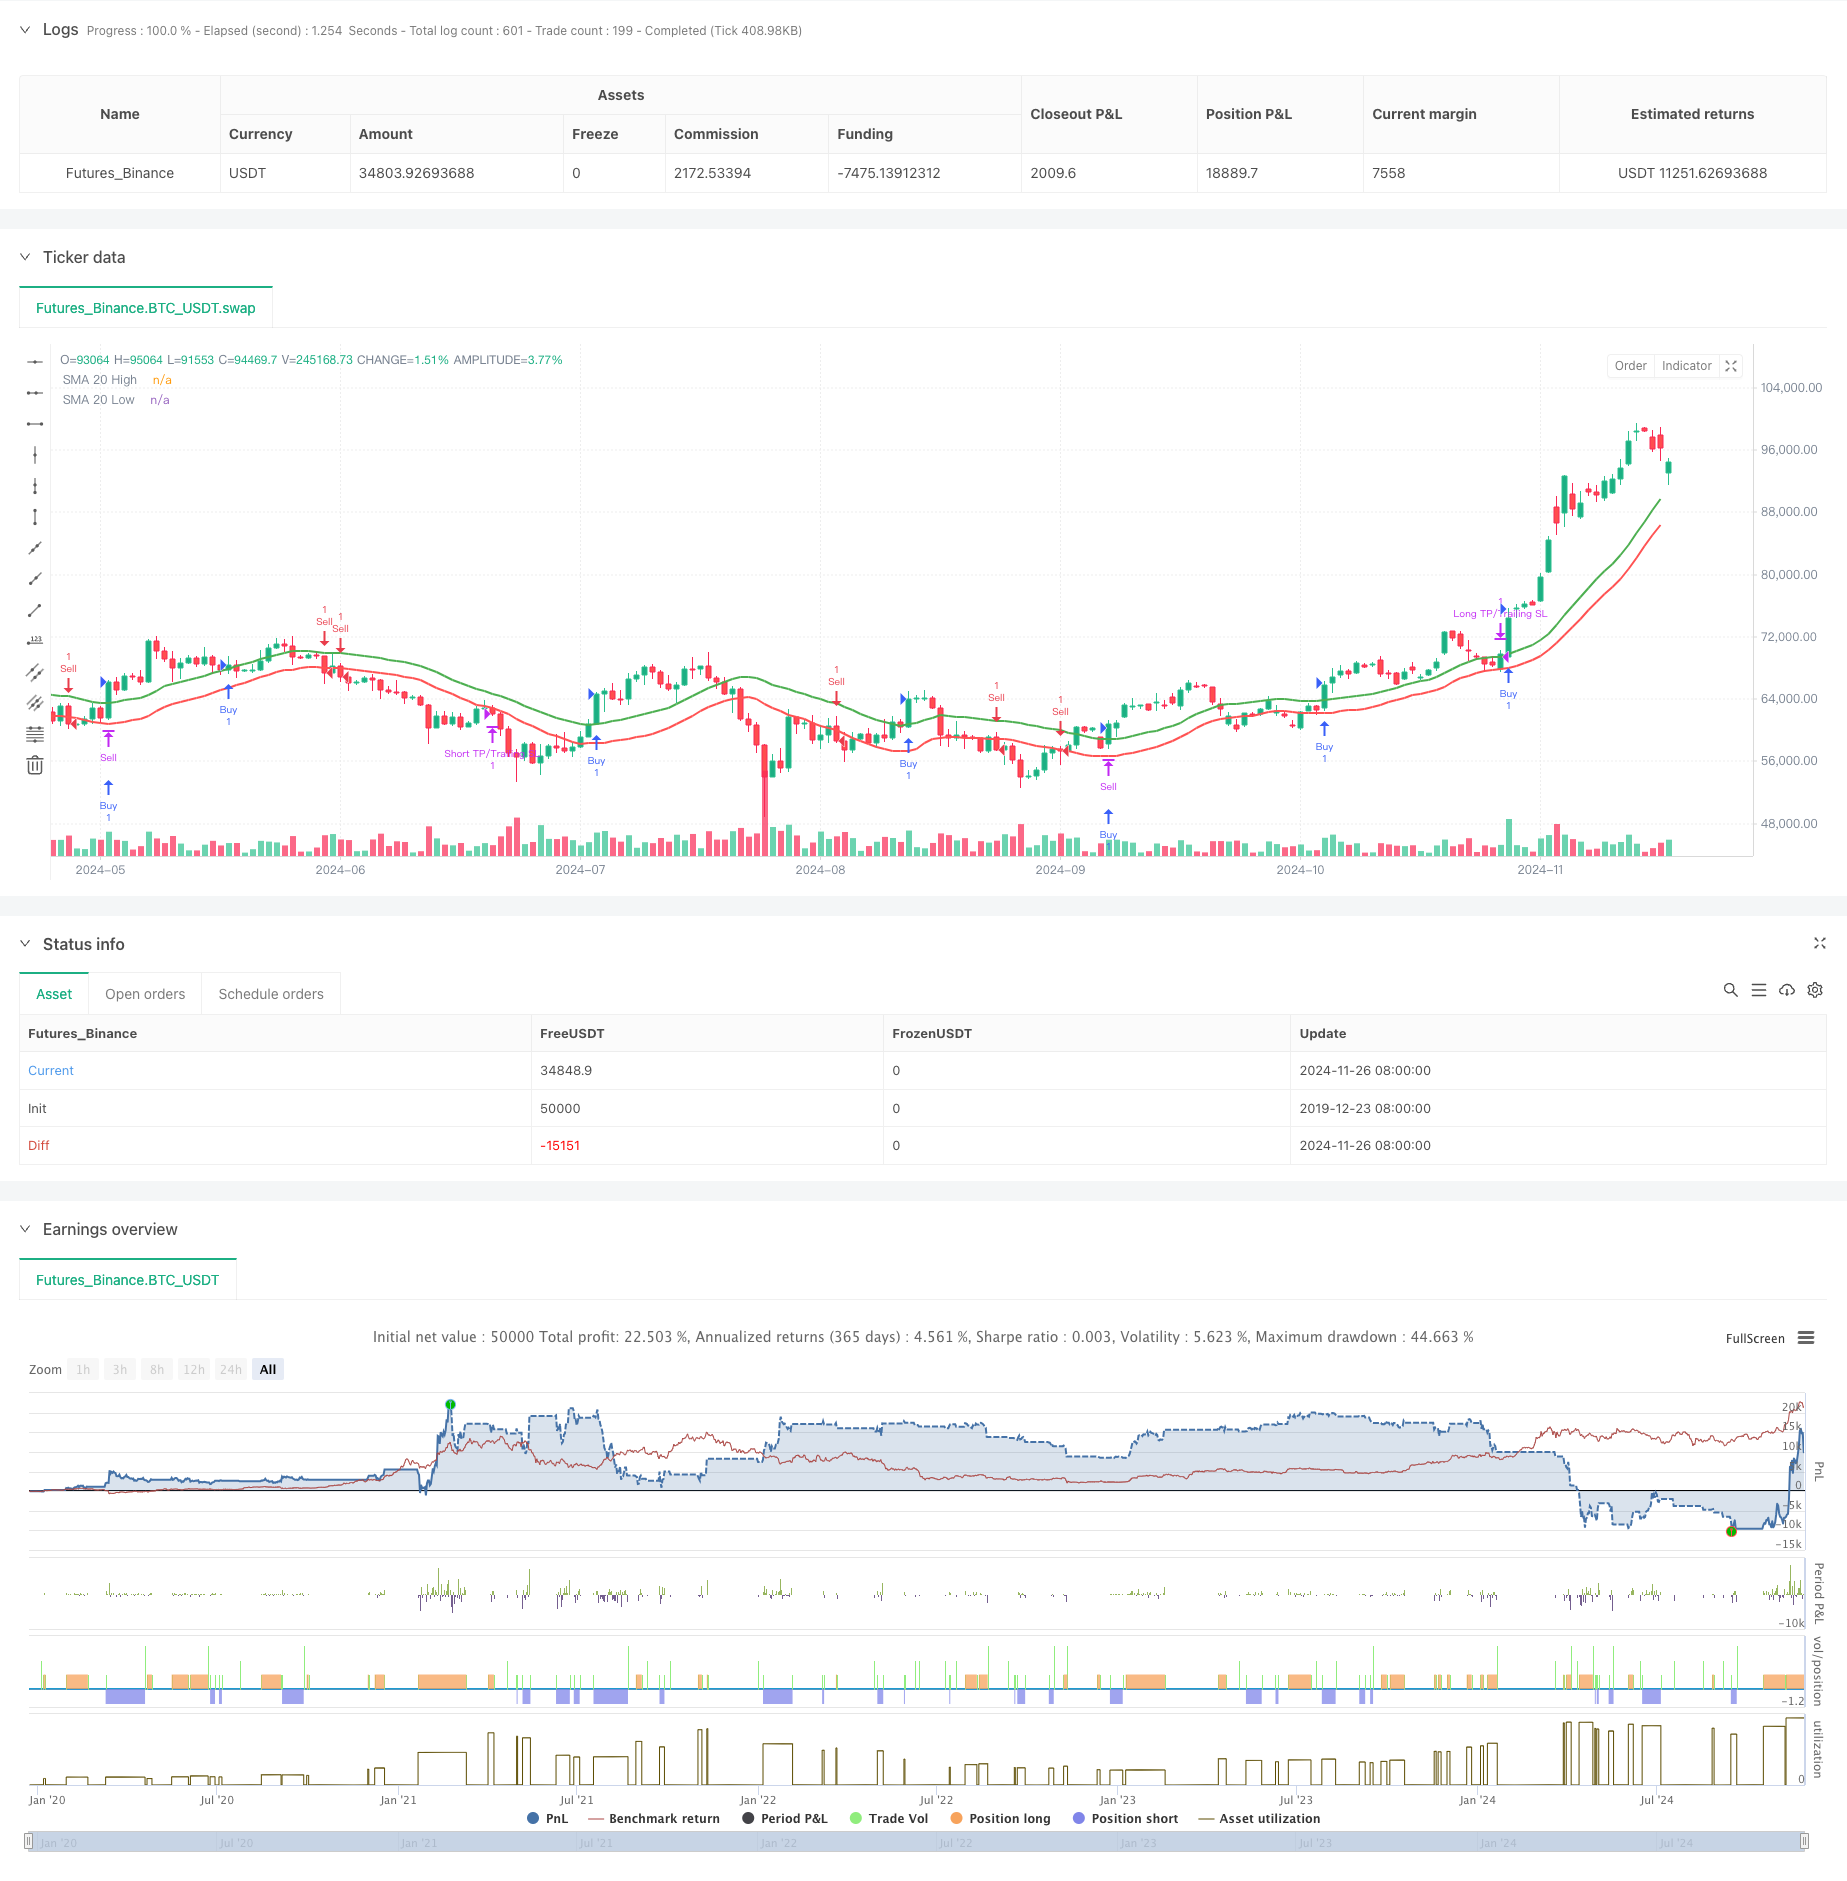
本策略是一个基于双均线的智能趋势跟踪系统,通过计算高点和低点的移动平均线以及斜率指标来识别市场趋势,并结合动态止盈止损机制进行风险管理。策略的核心在于通过斜率阈值过滤伪信号,同时采用trailing stop动态跟踪方式锁定利润,实现了趋势跟踪与风险控制的有机结合。
策略原理
策略采用双均线系统作为核心交易逻辑,分别在最高价和最低价序列上计算移动平均线。当价格突破上方均线且均线斜率显著向上时,系统产生做多信号;当价格跌破下方均线且均线斜率显著向下时,系统产生做空信号。为了避免震荡市中的频繁交易,策略引入斜率阈值机制,只有当均线斜率变化超过设定阈值时才确认趋势的有效性。在风险管理方面,策略设计了动态止盈止损机制,初始设定相对激进的止盈目标,同时使用跟踪止损保护已获得的利润。
策略优势
- 趋势识别准确性高:通过双均线和斜率阈值的组合,能够有效过滤掉横盘震荡中的虚假信号
- 风险控制完善:动态止损机制可以随着价格变动自动调整,既保护利润又给趋势足够发展空间
- 参数灵活可调:策略的关键参数如均线周期、止盈止损比例、斜率阈值等都可根据不同市场特征灵活调整
- 逻辑清晰简单:策略逻辑直观易懂,便于维护和优化
- 适应性强:可应用于不同的时间周期和交易品种
策略风险
- 趋势反转风险:在趋势突然反转时,trailing stop可能无法及时锁定全部利润
- 参数敏感性:策略表现对参数设置较为敏感,不同市场环境可能需要不同的参数组合
- 震荡市表现:虽然有斜率过滤,但在剧烈震荡市场中仍可能产生虚假信号
- 滑点影响:在波动剧烈时期,实际成交价格可能与信号价格存在较大偏差
策略优化方向
- 引入波动率自适应机制:可考虑根据ATR动态调整斜率阈值和止损距离
- 增加市场环境过滤:添加趋势强度指标,在不同市场环境下采用不同的参数组合
- 优化止盈止损机制:可以设计多层次的止盈目标,逐步锁定部分利润
- 添加交易量分析:结合成交量数据验证趋势的有效性
- 引入时间过滤:避免在市场波动性较大的时间段进行交易
总结
这是一个将趋势跟踪和风险管理有机结合的量化交易策略。通过双均线系统和斜率阈值的配合,策略能够较为准确地捕捉市场趋势,而动态的止盈止损机制则提供了完善的风险控制。虽然策略在参数选择和市场适应性方面还有改进空间,但其清晰的逻辑框架和灵活的参数体系为后续优化提供了良好基础。建议交易者在实盘应用时,需要根据具体的市场特征和自身风险偏好,对各项参数进行充分的回测和优化。
策略源码
/*backtest
start: 2019-12-23 08:00:00
end: 2024-11-27 08:00:00
period: 1d
basePeriod: 1d
exchanges: [{"eid":"Futures_Binance","currency":"BTC_USDT"}]
*/

//@version=5
strategy("SMA Buy/Sell Strategy with Significant Slope", overlay=true)

// Parametri configurabili
smaPeriod = input.int(20, title="SMA Period", minval=1)
initialTPPercent = input.float(5.0, title="Initial Take Profit (%)", minval=0.1)  // Take Profit iniziale (ambizioso)
trailingSLPercent = input.float(1.0, title="Trailing Stop Loss (%)", minval=0.1) // Percentuale di trailing SL
slopeThreshold = input.float(0.05, title="Slope Threshold (%)", minval=0.01)    // Soglia minima di pendenza significativa

// SMA calcolate su HIGH e LOW
smaHigh = ta.sma(high, smaPeriod)
smaLow = ta.sma(low, smaPeriod)

// Funzioni per pendenza significativa
isSignificantSlope(sma, threshold) =>
    math.abs(sma - sma[5]) / sma[5] > threshold / 100

slopePositive(sma) =>
    sma > sma[1] and isSignificantSlope(sma, slopeThreshold)

slopeNegative(sma) =>
    sma < sma[1] and isSignificantSlope(sma, slopeThreshold)

// Condizioni di BUY e SELL
buyCondition = close > smaHigh and low < smaHigh and close[1] < smaHigh and slopePositive(smaHigh)
sellCondition = close < smaLow and high > smaLow and close[1] > smaLow and slopeNegative(smaLow)

// Plot delle SMA
plot(smaHigh, color=color.green, linewidth=2, title="SMA 20 High")
plot(smaLow, color=color.red, linewidth=2, title="SMA 20 Low")

// Gestione TP/SL dinamici
longInitialTP = strategy.position_avg_price * (1 + initialTPPercent / 100)
shortInitialTP = strategy.position_avg_price * (1 - initialTPPercent / 100)

// Trailing SL dinamico
longTrailingSL = close * (1 - trailingSLPercent / 100)
shortTrailingSL = close * (1 + trailingSLPercent / 100)

// Chiusura di posizioni attive su segnali opposti
if strategy.position_size > 0 and sellCondition
    strategy.close("Buy", comment="Close Long on Sell Signal")
if strategy.position_size < 0 and buyCondition
    strategy.close("Sell", comment="Close Short on Buy Signal")

// Apertura di nuove posizioni con TP iniziale e Trailing SL
if buyCondition
    strategy.entry("Buy", strategy.long, comment="Open Long")
    strategy.exit("Long TP/Trailing SL", from_entry="Buy", limit=longInitialTP, stop=longTrailingSL)

if sellCondition
    strategy.entry("Sell", strategy.short, comment="Open Short")
    strategy.exit("Short TP/Trailing SL", from_entry="Sell", limit=shortInitialTP, stop=shortTrailingSL)
相关推荐