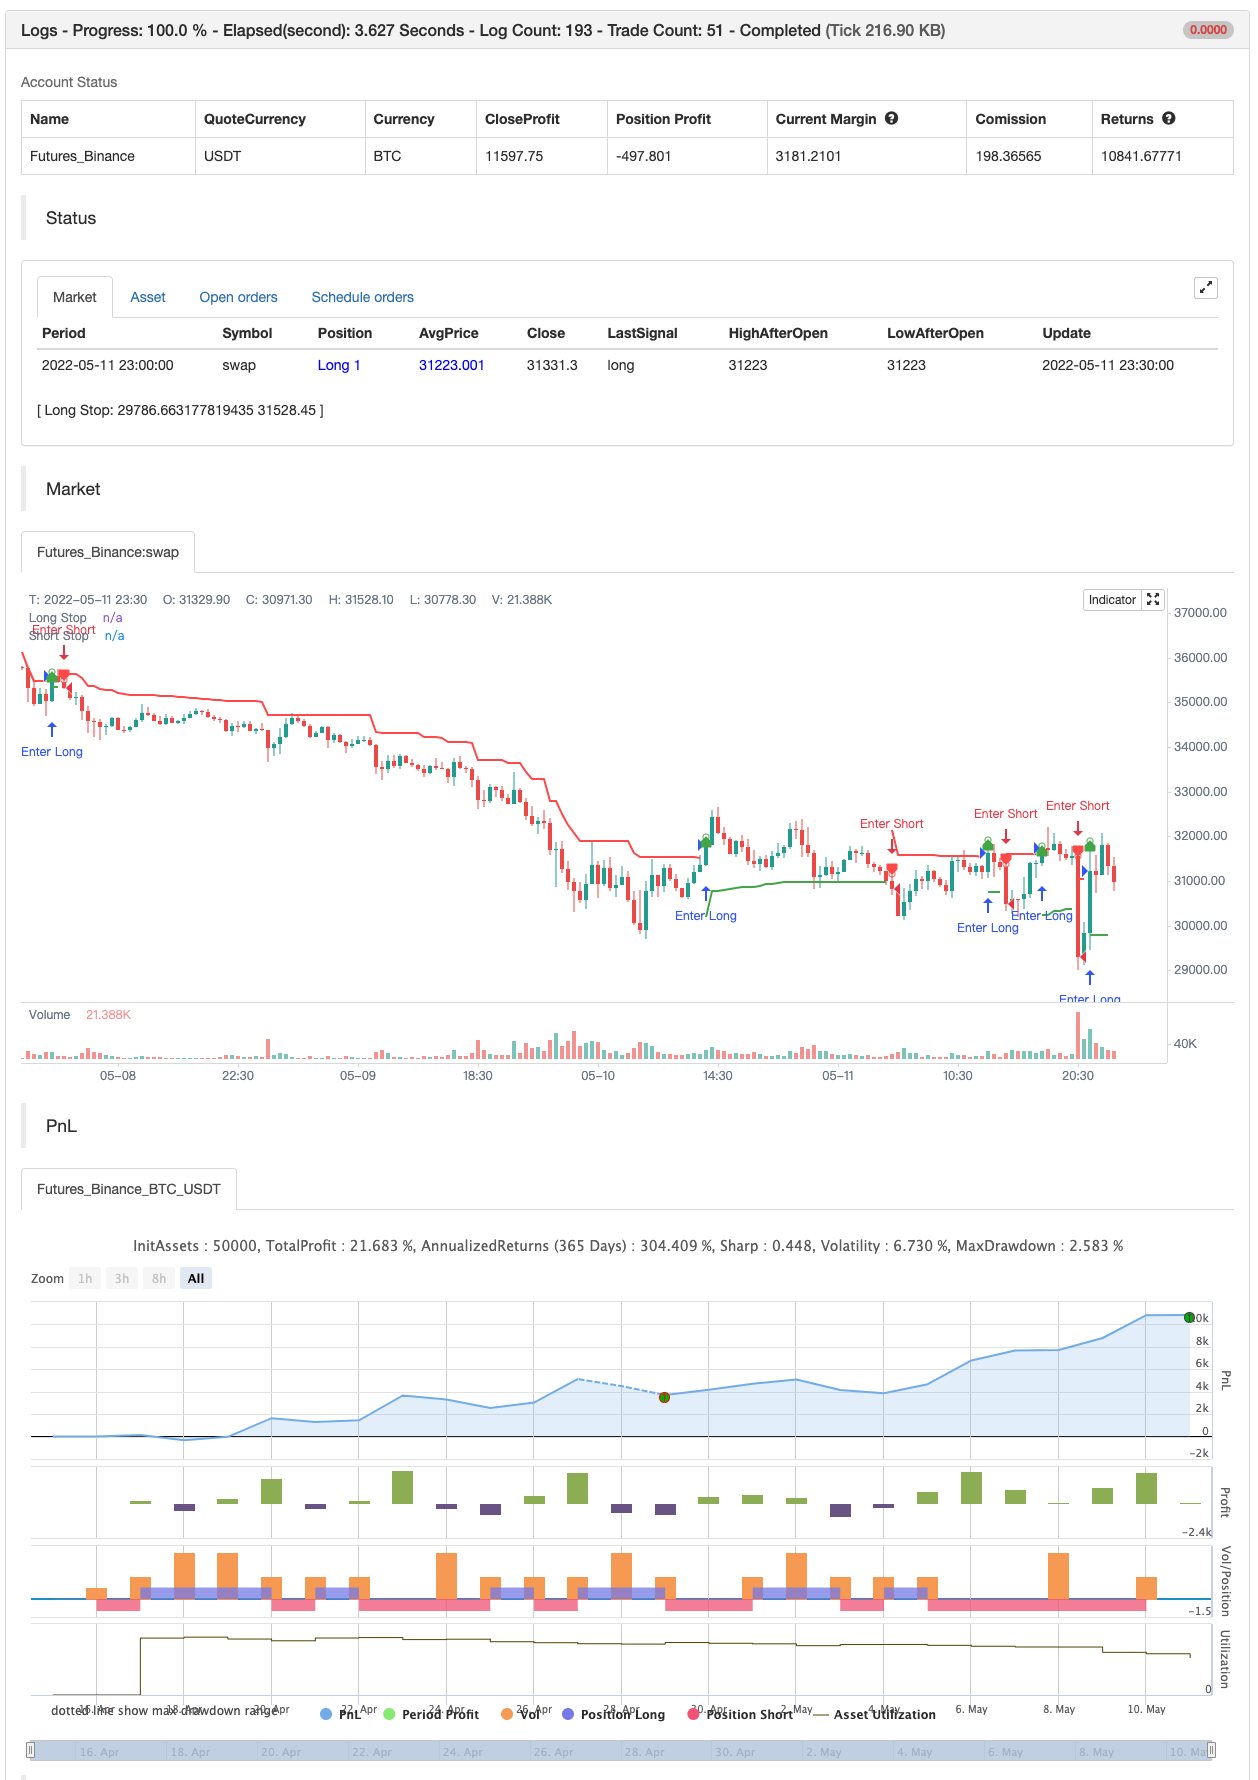
Keluar Chandelier
Penulis:ChaoZhang, Tarikh: 2022-05-17 17:10:19Tag:ATR
Ini adalah reka bentuk semula penunjuk Chandelier Exit. Ia menghilangkan peralihan bodoh antara keadaan Chandelier Exit
Indikator ini pada asalnya dibangunkan oleh Charles Le Beau dan dipopularkan oleh Dr. Alexander Elder dalam bukunya
Ringkasnya, ini adalah stop-loss yang mengikuti berdasarkan Julat Benar Purata (ATR).
Ujian belakang

/*backtest
start: 2022-04-16 00:00:00
end: 2022-05-11 23:59:00
period: 30m
basePeriod: 15m
exchanges: [{"eid":"Futures_Binance","currency":"BTC_USDT"}]
*/

//@version=4
// Copyright (c) 2019-present, Alex Orekhov (everget)
// Chandelier Exit script may be freely distributed under the terms of the GPL-3.0 license.
study("Chandelier Exit", shorttitle="CE", overlay=true)

length = input(title="ATR Period", type=input.integer, defval=22)
mult = input(title="ATR Multiplier", type=input.float, step=0.1, defval=3.0)
showLabels = input(title="Show Buy/Sell Labels ?", type=input.bool, defval=true)
useClose = input(title="Use Close Price for Extremums ?", type=input.bool, defval=true)
highlightState = input(title="Highlight State ?", type=input.bool, defval=true)

atr = mult * atr(length)

longStop = (useClose ? highest(close, length) : highest(length)) - atr
longStopPrev = nz(longStop[1], longStop)
longStop := close[1] > longStopPrev ? max(longStop, longStopPrev) : longStop

shortStop = (useClose ? lowest(close, length) : lowest(length)) + atr
shortStopPrev = nz(shortStop[1], shortStop)
shortStop := close[1] < shortStopPrev ? min(shortStop, shortStopPrev) : shortStop

var int dir = 1
dir := close > shortStopPrev ? 1 : close < longStopPrev ? -1 : dir

var color longColor = color.green
var color shortColor = color.red

longStopPlot = plot(dir == 1 ? longStop : na, title="Long Stop", style=plot.style_linebr, linewidth=2, color=longColor)
buySignal = dir == 1 and dir[1] == -1
plotshape(buySignal ? longStop : na, title="Long Stop Start", location=location.absolute, style=shape.circle, size=size.tiny, color=longColor, transp=0)
plotshape(buySignal and showLabels ? longStop : na, title="Buy Label", text="Buy", location=location.absolute, style=shape.labelup, size=size.tiny, color=longColor, textcolor=color.white, transp=0)

shortStopPlot = plot(dir == 1 ? na : shortStop, title="Short Stop", style=plot.style_linebr, linewidth=2, color=shortColor)
sellSignal = dir == -1 and dir[1] == 1
plotshape(sellSignal ? shortStop : na, title="Short Stop Start", location=location.absolute, style=shape.circle, size=size.tiny, color=shortColor, transp=0)
plotshape(sellSignal and showLabels ? shortStop : na, title="Sell Label", text="Sell", location=location.absolute, style=shape.labeldown, size=size.tiny, color=shortColor, textcolor=color.white, transp=0)

midPricePlot = plot(ohlc4, title="", style=plot.style_circles, linewidth=0, display=display.none, editable=false)

longFillColor = highlightState ? (dir == 1 ? longColor : na) : na
shortFillColor = highlightState ? (dir == -1 ? shortColor : na) : na
fill(midPricePlot, longStopPlot, title="Long State Filling", color=longFillColor)
fill(midPricePlot, shortStopPlot, title="Short State Filling", color=shortFillColor)

changeCond = dir != dir[1]
alertcondition(changeCond, title="Alert: CE Direction Change", message="Chandelier Exit has changed direction!")
alertcondition(buySignal, title="Alert: CE Buy", message="Chandelier Exit Buy!")
alertcondition(sellSignal, title="Alert: CE Sell", message="Chandelier Exit Sell!")


if buySignal
    strategy.entry("Enter Long", strategy.long)
else if sellSignal
    strategy.entry("Enter Short", strategy.short)
Kandungan berkaitan
- Sistem strategi pengukuran trend momentum dua penunjuk
- Penghakiman trend pelbagai dimensi dan strategi stop loss dinamik ATR
- Trend multi-indikator tinggi mengesahkan strategi dagangan
- Strategi Stop Loss Pemanduan Pintar Berasaskan Purata Bergerak dan Pola Hari
- Sistem perdagangan kuantitatif dengan regresi faktor dan strategi tali harga dinamik
- Strategi perdagangan kuantitatif dengan pengesanan trend silang dinamik dengan pelbagai pengesahan
- Strategi pengesanan stop loss dinamik yang tinggi berdasarkan margin peringkat yang banyak berlepas dari RSI
- Strategi perdagangan kuantitatif untuk membalikkan trend sinkronisasi pelbagai penunjuk
- Pelbagai saluran dinamik menyokong dan menentang strategi saluran Kenny
- Pembelajaran mesin menyesuaikan diri dengan strategi perdagangan kuantitatif supertrend
- Strategi perdagangan pengesanan trend purata berdasarkan penurunan kadar turun naik
Lebih lanjut
- Scalping PullBack Tool R1
- Strategi Beli&Jual bergantung kepada AO+Stoch+RSI+ATR
- EMA TREND CLOUD
- Rasio Tenaga Arah RedK Volume-Pengcepat
- Donchian Breakout tiada cat semula
- Bar Momentum RedK
- SuperJump Turn Back Bollinger Band
- Trend Fukuiz
- BOT Johny
- SSL Hibrid
- Risotto
- EMA Cloud Intraday Strategi
- Titik Pivot Supertrend
- Supertrend+4 bergerak
- ZigZag berasaskan momentum
- VuManChu Cipher B + Strategi Perbezaan
- Konsep Dual SuperTrend
- Super Scalper
- Ujian belakang- Penunjuk
- Trendycious