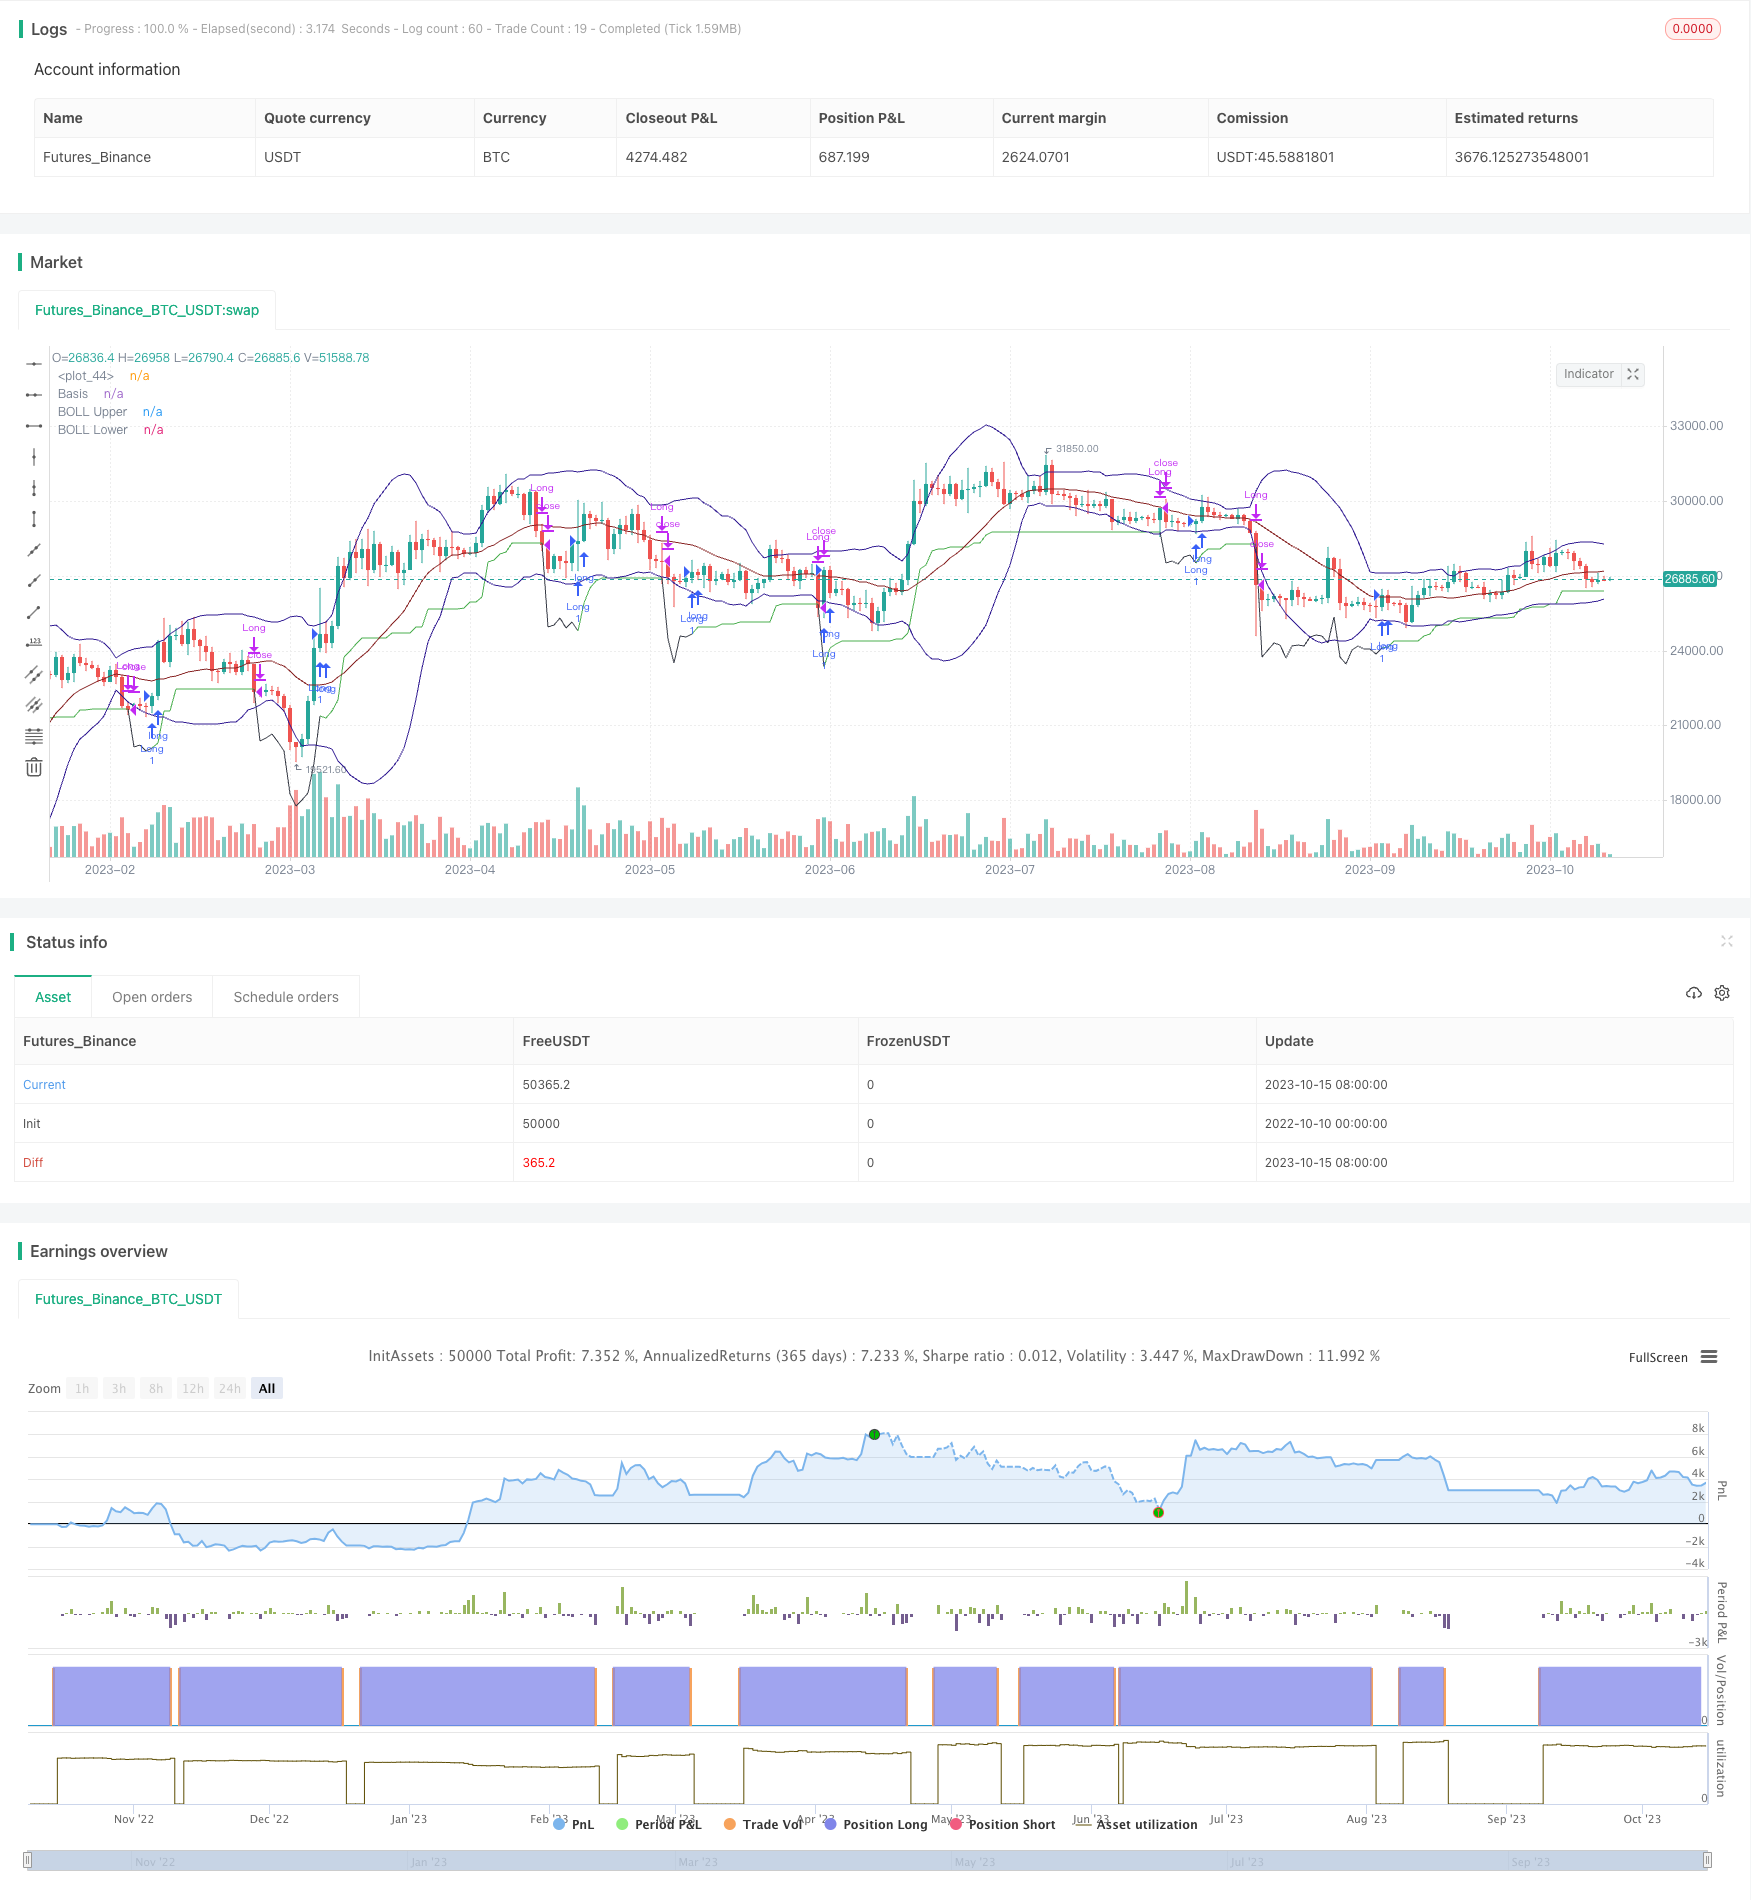
Trend Volume Relatif Berikutan Strategi Dagangan
Penulis:ChaoZhang, Tarikh: 2023-10-17 16:19:59Tag:

Ringkasan
Strategi ini menggabungkan penunjuk jumlah relatif dan penilaian trend tindakan harga untuk membina sistem perdagangan automatik yang mengintegrasikan trend berikut dan pecah.
Cara Ia Bekerja
-
Gunakan Bollinger Bands untuk menentukan sama ada turun naik harga adalah rendah. khususnya dengan membandingkan lebar band ATR dan BOLL.
-
Mengira jumlah purata N hari yang lalu, bandingkan dengan jumlah semasa untuk melihat sama ada jumlahnya meningkat.
-
Beli apabila harga hampir rendah, peningkatan jumlah dan turun naik rendah.
-
Tetapkan stop loss, jejak harga terendah.
-
Jual apabila harga pecah di bawah stop loss.
-
Jual apabila harga membentuk corak naik.
Kelebihan
-
Menggabungkan jumlah dan turun naik menapis pecah palsu dengan berkesan.
-
Mengikuti stop loss mengunci keuntungan maksimum.
-
Isyarat keluar seperti bullish engulfing menangkap pembalikan trend awal.
-
Intuitif dan mudah diikuti.
-
Peraturan yang jelas mengenai stop loss dan mengambil keuntungan mengurangkan ketidakpastian.
Risiko
-
Indikator jumlah kelewatan, boleh terlepas titik masuk terbaik.
-
Isyarat keluar seperti menelan kekurangan kebolehpercayaan, risiko keluar lebih awal.
-
Stop yang lebih luas berisiko kerugian yang lebih besar pada perdagangan tunggal.
-
Perlu menyesuaikan parameter seperti tempoh ATR dan tempoh jumlah untuk mengelakkan perdagangan berlebihan.
-
Perlu mengoptimumkan peraturan keluar untuk mengelakkan keluar yang tidak perlu.
Peluang Peningkatan
-
Cuba penapis tambahan seperti MACD untuk meningkatkan isyarat kemasukan.
-
Mengoptimumkan tempoh ATR dan jumlah untuk mengurangkan perdagangan berlebihan.
-
Meneroka isyarat keluar lain seperti harga memecahkan jalur bawah.
-
Penyelidikan menyusul stop loss untuk mengunci lebih banyak keuntungan.
-
Uji tempoh tahan yang berbeza untuk prestasi terbaik.
-
Uji semula pada produk yang berbeza untuk mencari yang paling sesuai.
Ringkasan
Strategi ini agak mudah, menggunakan tindakan jumlah dan harga untuk mengikuti trend. Ia mempunyai isyarat yang jelas dan mudah dijejaki. Tetapi kualiti penapis dan peraturan keluar dapat ditingkatkan lagi untuk prestasi yang lebih boleh dipercayai. Dengan usaha berterusan pada penyesuaian parameter dan reka bentuk kemasukan / keluar, hasil yang cemerlang dapat dicapai.
/*backtest
start: 2022-10-10 00:00:00
end: 2023-10-16 00:00:00
period: 1d
basePeriod: 1h
exchanges: [{"eid":"Futures_Binance","currency":"BTC_USDT"}]
*/

// This source code is subject to the terms of the Mozilla Public License 2.0 at https://mozilla.org/MPL/2.0/
// © DojiEmoji (kevinhhl)

//@version=4
strategy("[KL] Relative Volume Strategy",overlay=true,pyramiding=1)
ENUM_LONG = "Long"
VERBOSE_MODE = false
opened_position = false

// Timeframe {
backtest_timeframe_start = input(defval = timestamp("01 Apr 2016 13:30 +0000"), title = "Backtest Start Time", type = input.time)
USE_ENDTIME = input(false,title="Define backtest end-time (If false, will test up to most recent candle)")
backtest_timeframe_end = input(defval = timestamp("01 May 2021 19:30 +0000"), title = "Backtest End Time (if checked above)", type = input.time)
within_timeframe = true
// }

// Volatility Indicators {
// BOLL:
BOLL_length = 20, BOLL_src = close, SMA20 = sma(BOLL_src, BOLL_length), BOLL_sDEV_x2 = 2 * stdev(BOLL_src, BOLL_length)
BOLL_upper = SMA20 + BOLL_sDEV_x2, BOLL_lower = SMA20 - BOLL_sDEV_x2
plot(SMA20, "Basis", color=#872323, offset = 0)
BOLL_p1 = plot(BOLL_upper, "BOLL Upper", color=color.navy, offset = 0, transp=50)
BOLL_p2 = plot(BOLL_lower, "BOLL Lower", color=color.navy, offset = 0, transp=50)
//fill(BOLL_p1, BOLL_p2, title = "Background", color=#198787, transp=85)
// ATR v. sDev of prices
ATR_x2 = atr(input(10,title="Length of ATR [Trailing Stop Loss] (x2)"))*2
//plot(SMA20+ATR_x2, "SMA20 + ATR_x2", color=color.gray, offset = 0, transp=50)
//plot(SMA20-ATR_x2, "SMA20 - ATR_x2", color=color.gray, offset = 0, transp=50)
//plotchar(ATR_x2, "ATR_x2", "", location = location.bottom)
is_low_volat = ATR_x2 > BOLL_sDEV_x2
// }

// Trailing stop loss {
TSL_source = low

var entry_price = float(0), var stop_loss_price = float(0)

TSL_line_color = color.green
if strategy.position_size == 0 or not within_timeframe
    TSL_line_color := color.black
    stop_loss_price := TSL_source - ATR_x2
else if strategy.position_size > 0
    stop_loss_price := max(stop_loss_price, TSL_source - ATR_x2)
plot(stop_loss_price, color=TSL_line_color)

// }

// Relative volume indicator {
LEN_RELATIVE_VOL = input(5, title="SMA(volume) length (for relative comparison)")
relative_vol = sma(volume,LEN_RELATIVE_VOL)
// }

// price actions {
bar_range_ratio = abs(close-open)/(high-low)
engulfing = low < low[1] and high > high[1] and abs(close-open) > abs(close-open)[1]
// }

// MAIN:
if within_timeframe
	entry_msg = "", exit_msg = close <= entry_price ? "stop loss" : "take profit"

    // ENTRY :::::::::::::::::::::::::::::::::::::::::::::::::::::::::::::::::::::::::::::::::::::
	if close > open and volume > relative_vol and is_low_volat
		if strategy.position_size > 0
			entry_msg := "adding"
		else if strategy.position_size == 0
			entry_msg := "initial"

		if strategy.position_size == 0
			entry_price := close
			stop_loss_price := TSL_source - ATR_x2
			ATR_x2 := ATR_x2

		strategy.entry(ENUM_LONG, strategy.long, comment=entry_msg)

    // EXIT ::::::::::::::::::::::::::::::::::::::::::::::::::::::::::::::::::::::::::::::::::::::
	if strategy.position_size > 0
		bExit = false
		// EXIT: Case (A) touches trailing stop loss
		if TSL_source <= stop_loss_price
			exit_msg := exit_msg + "[TSL]"
			bExit := true
		// EXIT: Case (B)
		else if close < open and not is_low_volat and engulfing and (high-low) > ATR_x2
			exit_msg := VERBOSE_MODE ? exit_msg + "[engulfing bearish]" : exit_msg
			bExit := true
        strategy.close(ENUM_LONG, when=bExit, comment=exit_msg)

// CLEAN UP:
if strategy.position_size == 0
	entry_price := 0
	stop_loss_price := float(0)
- Trend DEMA Mengikut Strategi
- Algoritma RSI Range Breakout Strategi
- RSI Rising Strategi Tren Crypto
- EMA Slope Cross Trend Mengikut Strategi
- Strategi Perdagangan RSI Intraday TAM
- Strategi Crossover Purata Bergerak Eksponen
- Strategi Crossover Purata Bergerak
- Strategi Pengesanan Penarikan
- Model pemantauan purata bergerak berganda
- Strategi pembalikan purata berdasarkan ATR
- Strategi Pengimbangan Trend MACD
- EMA dan Strategi Dagangan Heikin Ashi
- Trend Mengikut Strategi Lama Hanya
- Strategi Gabungan corak candlestick pelbagai model
- Analisis Strategi Dagangan Pembalikan Saluran
- Strategi Dagangan Pembalikan Ringan Indikator Dua
- Strategi Surf Rider
- Strategi Pengesanan Momentum Berdasarkan Integrasi Penunjuk
- Hulk Pullback Strategi Pembalikan
- Strategi Pengurusan Wang Dinamik Multifactor