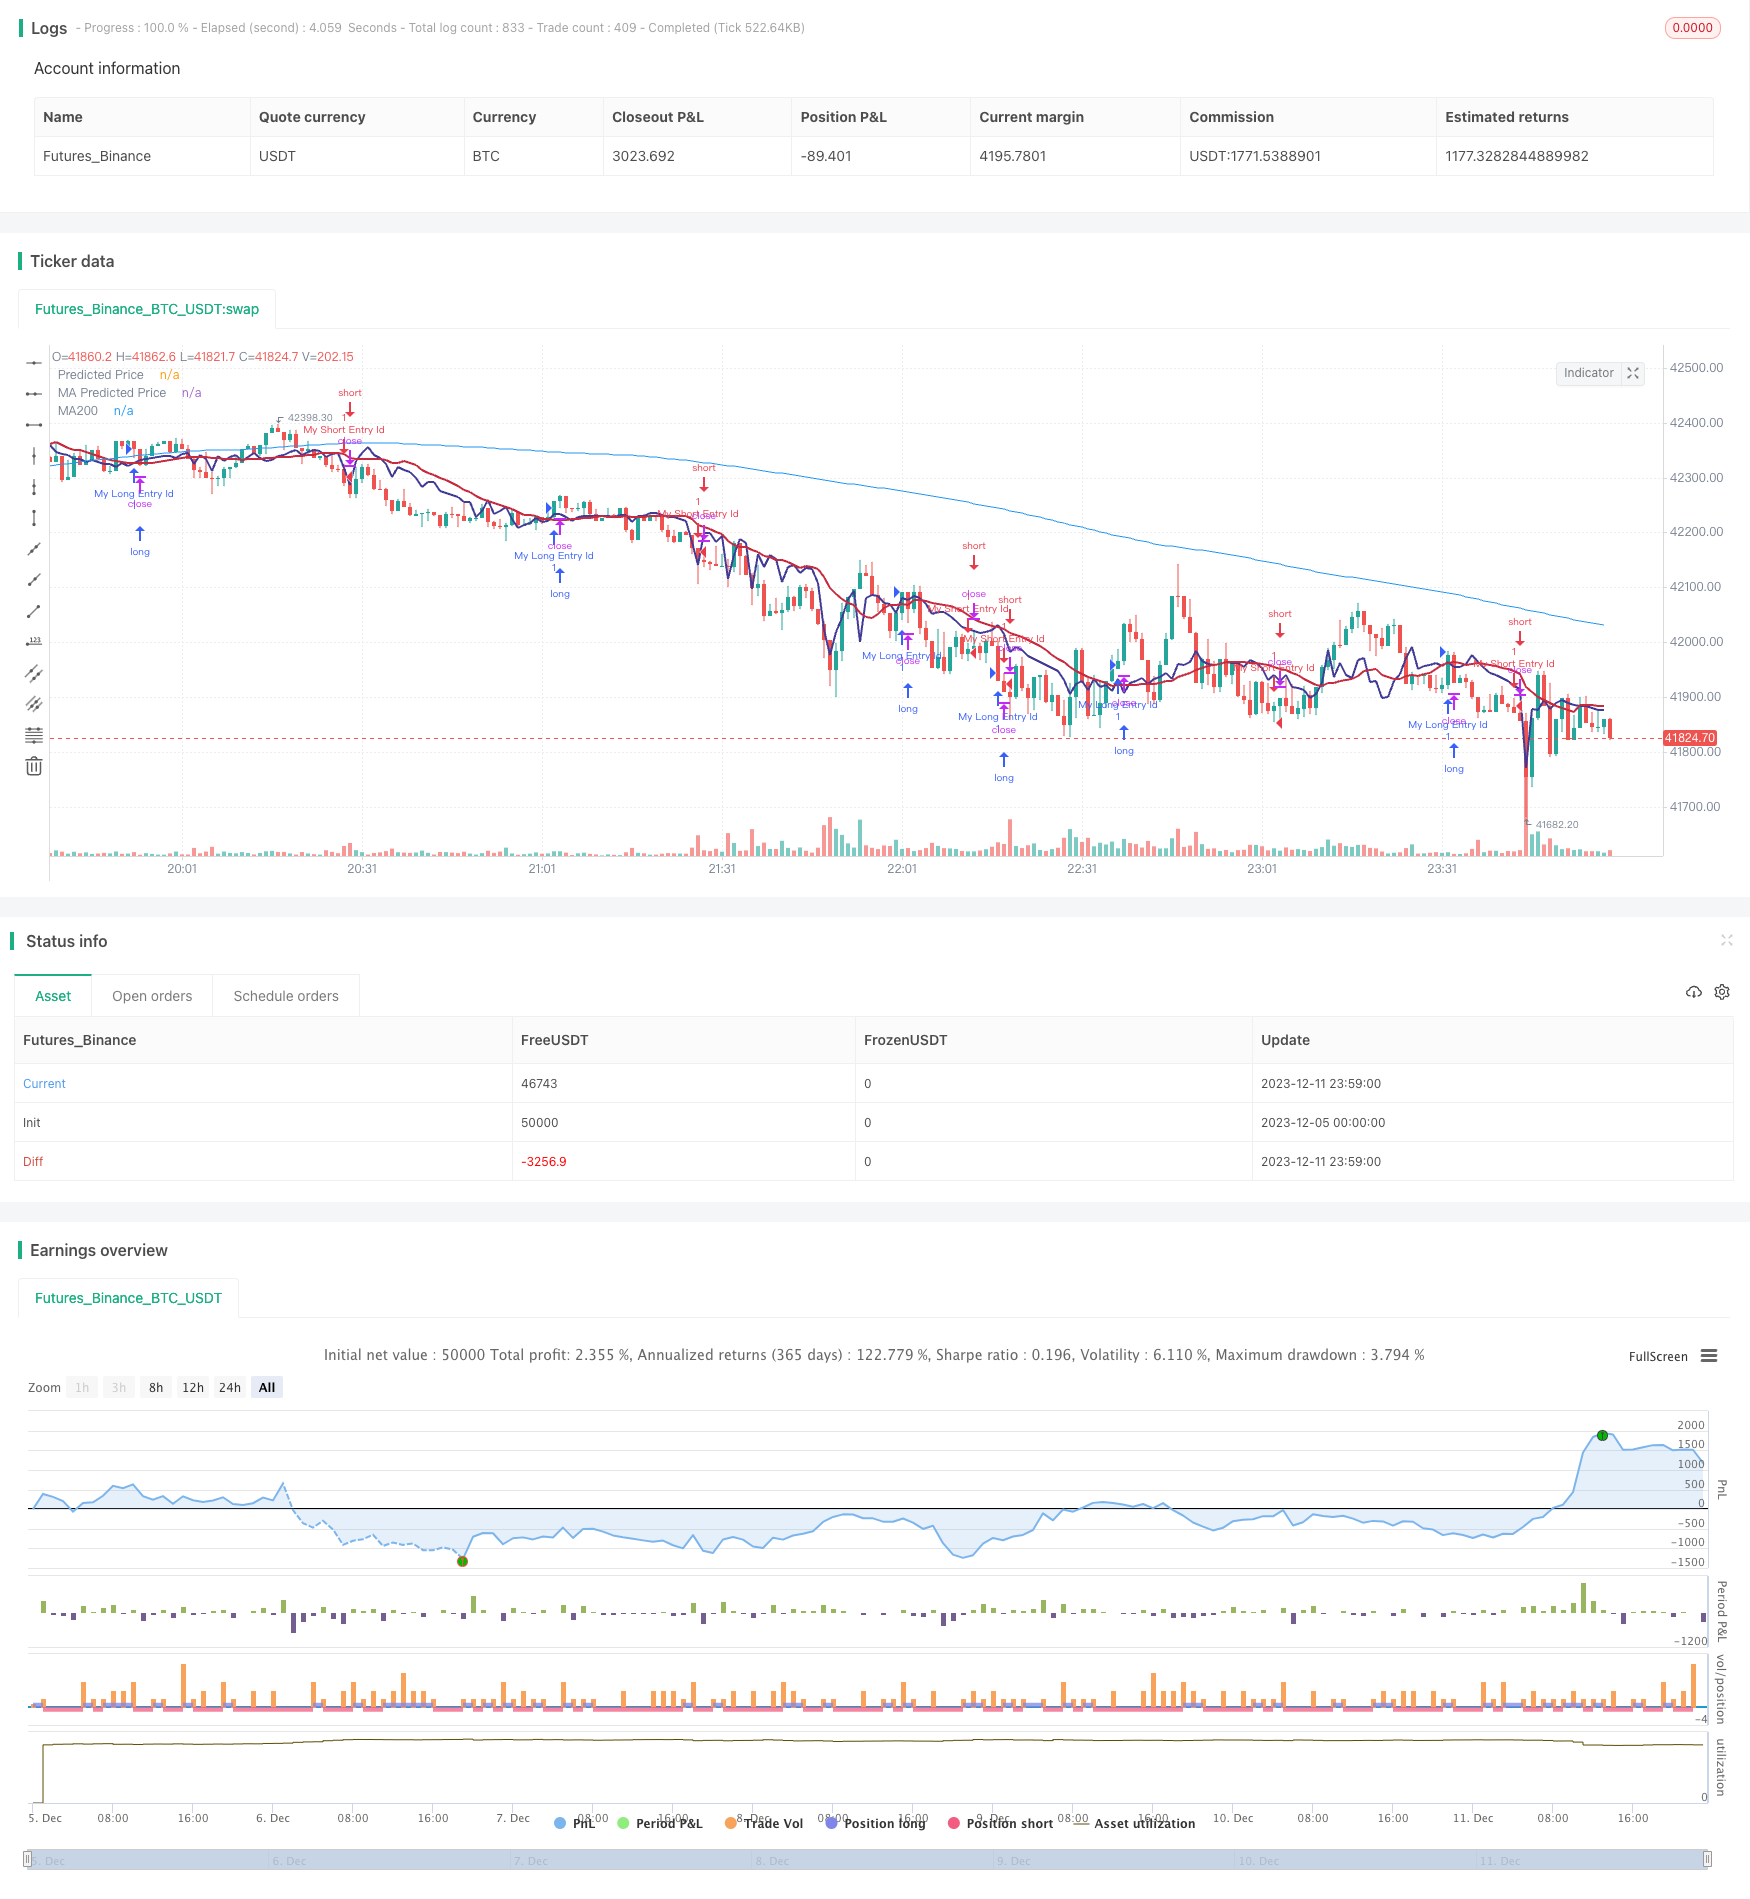
Strategi Pembalikan Aliran Ideologi Dinamik

Gambaran keseluruhan
Strategi pembalikan trend ideologi dinamik menggunakan harga ramalan regresi linear dan menggabungkan ideologi yang terbentuk dengan purata bergerak untuk menghasilkan isyarat perdagangan. Ia menghasilkan isyarat beli apabila harga ramalan melintasi purata bergerak dari bawah ke atas; ia menghasilkan isyarat jual apabila harga ramalan melintasi purata bergerak dari atas ke bawah, untuk menangkap pembalikan trend.
Prinsip Strategi
- Kembalian linear untuk harga saham berdasarkan jumlah dagangan, yang memberikan nilai ramalan harga
- Pengiraan purata bergerak dalam keadaan yang berbeza
- Apabila harga yang diramalkan melintasi purata bergerak dari bawah ke atas, ia menghasilkan isyarat beli
- Apabila harga yang diramalkan melintasi purata bergerak dari atas ke bawah, ia menghasilkan isyarat jual
- Tempoh perubahan trend yang dikombinasikan dengan indikator MACD
Isyarat di atas menggabungkan pelbagai pengesahan, mengelakkan penembusan palsu, dan meningkatkan ketepatan isyarat.
Analisis kelebihan
- Menggunakan regresi linear untuk meramalkan trend harga dan meningkatkan ketepatan isyarat
- Menggabungkan Moving Average dengan Ideologi, Capture Trend Reversal
- Regresi linear berdasarkan jumlah urus niaga lebih berfaedah untuk ekonomi
- Menggabungkan penunjuk seperti MACD untuk pengesahan berganda, mengurangkan isyarat palsu
Analisis risiko
- Tetapan parameter regresi linear mempunyai kesan yang besar terhadap hasil
- Pengaturan purata bergerak juga mempengaruhi kualiti isyarat
- Walaupun terdapat mekanisme pengesahan, masih ada risiko isyarat palsu
- Kod boleh dioptimumkan lagi untuk mengurangkan jumlah transaksi dan meningkatkan kadar keuntungan
Arah pengoptimuman
- Parameter untuk mengoptimumkan regresi linear dan purata bergerak
- Meningkatkan syarat pengesahan dan mengurangkan kadar isyarat palsu
- Kualiti dibalikkan dengan lebih banyak faktor
- Mengoptimumkan strategi hentikan kerugian dan mengurangkan risiko transaksi tunggal
ringkaskan
Strategi pembalikan trend ideologi dinamik menggabungkan ramalan regresi linear dan pembentukan purata bergerak untuk menangkap masa pembalikan trend. Ia mempunyai kebolehpercayaan yang lebih tinggi berbanding dengan satu petunjuk. Strategi ini dapat meningkatkan kualiti isyarat dan tahap keuntungan dengan penyesuaian parameter dan pengoptimuman syarat pengesahan.
/*backtest
start: 2023-12-05 00:00:00
end: 2023-12-12 00:00:00
period: 1m
basePeriod: 1m
exchanges: [{"eid":"Futures_Binance","currency":"BTC_USDT"}]
*/

// This source code is subject to the terms of the Mozilla Public License 2.0 at https://mozilla.org/MPL/2.0/
// © stocktechbot
//@version=5
strategy("Linear Cross", overlay=true, margin_long=100, margin_short=0)

//Linear Regression

vol = volume

// Function to calculate linear regression
linregs(y, x, len) =>
    ybar = math.sum(y, len)/len
    xbar = math.sum(x, len)/len
    b = math.sum((x - xbar)*(y - ybar),len)/math.sum((x - xbar)*(x - xbar),len)
    a = ybar - b*xbar
    [a, b]

// Historical stock price data
price = close

// Length of linear regression
len = input(defval = 21, title = 'Strategy Length')
linearlen=input(defval = 9, title = 'Linear Lookback')
[a, b] = linregs(price, vol, len)

// Calculate linear regression for stock price based on volume
//eps = request.earnings(syminfo.ticker, earnings.actual)
//MA For double confirmation

out = ta.sma(close, 200)
outf = ta.sma(close, 50)
outn = ta.sma(close, 90)
outt = ta.sma(close, 21)
outthree = ta.sma(close, 9)

// Predicted stock price based on volume
predicted_price = a + b*vol

// Check if predicted price is between open and close
is_between = open < predicted_price and predicted_price < close

//MACD
//[macdLine, signalLine, histLine] = ta.macd(close, 12, 26, 9)

// Plot predicted stock price
plot(predicted_price, color=color.rgb(65, 59, 150), linewidth=2, title="Predicted Price")
plot(ta.sma(predicted_price,linearlen), color=color.rgb(199, 43, 64), linewidth=2, title="MA Predicted Price")
//offset = input.int(title="Offset", defval=0, minval=-500, maxval=500)
plot(out, color=color.blue, title="MA200")
[macdLine, signalLine, histLine] = ta.macd(predicted_price, 12, 26, 9)

//BUY Signal

longCondition=false
mafentry =ta.sma(close, 50) > ta.sma(close, 90)
//matentry = ta.sma(close, 21) > ta.sma(close, 50)
matwohun = close > ta.sma(close, 200)
twohunraise = ta.rising(out, 2)
twentyrise = ta.rising(outt, 2)
macdrise = ta.rising(macdLine,2)
macdlong = ta.crossover(predicted_price, ta.wma(predicted_price,linearlen))  and (signalLine < macdLine)
if macdlong and macdrise
    longCondition := true

if (longCondition)
    strategy.entry("My Long Entry Id", strategy.long)
//Sell Signal
lastEntryPrice = strategy.opentrades.entry_price(strategy.opentrades - 1)
daysSinceEntry = len
daysSinceEntry := int((time - strategy.opentrades.entry_time(strategy.opentrades - 1)) / (24 * 60 * 60 * 1000))
percentageChange = (close - lastEntryPrice) / lastEntryPrice * 100
//trailChange = (ta.highest(close,daysSinceEntry) - close) / close * 100

//label.new(bar_index, high, color=color.black, textcolor=color.white,text=str.tostring(int(trailChange)))
shortCondition=false
mafexit =ta.sma(close, 50) < ta.sma(close, 90)
matexit = ta.sma(close, 21) < ta.sma(close, 50)
matwohund = close < ta.sma(close, 200)
twohunfall = ta.falling(out, 3)
twentyfall = ta.falling(outt, 2)
shortmafall = ta.falling(outthree, 1)
macdfall = ta.falling(macdLine,1)
macdsell = macdLine < signalLine
if macdfall and macdsell and (macdLine < signalLine) and ta.falling(low,2)
    shortCondition := true

if (shortCondition)
    strategy.entry("My Short Entry Id", strategy.short)