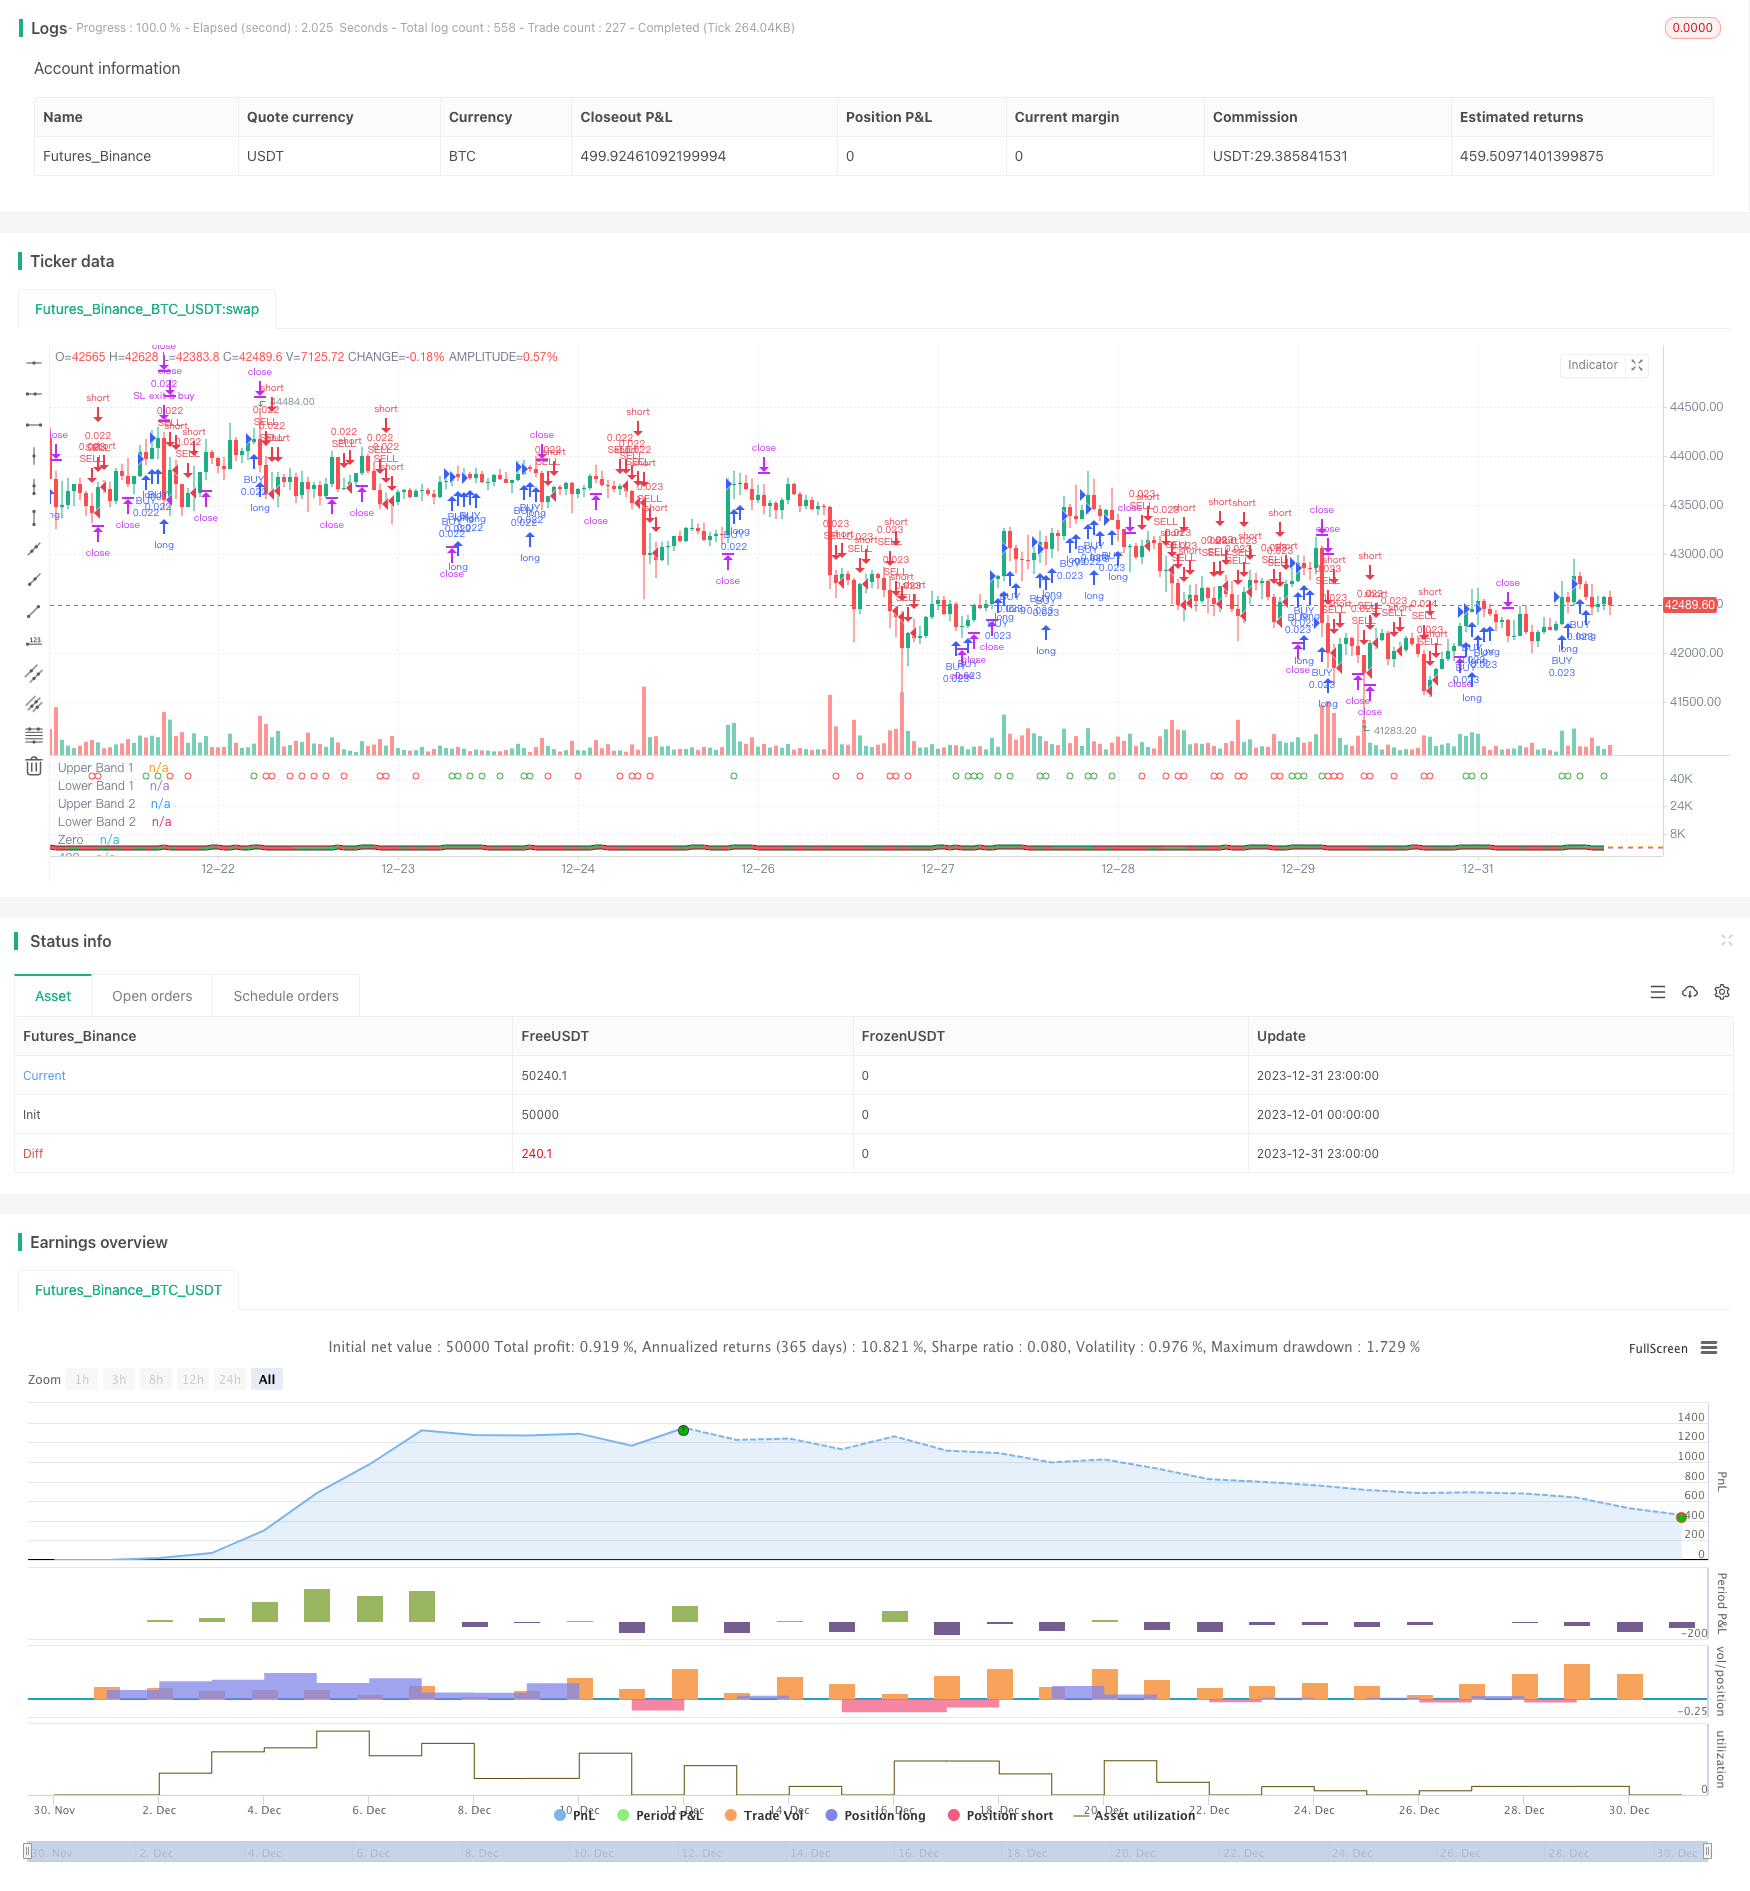
Strategi Hedging Trend Surfing Berdasarkan Petunjuk TSI dan HMACCI
Penulis:ChaoZhang, Tarikh: 2024-01-23 11:26:14Tag:

Ringkasan
Prinsip Strategi
Strategi ini terutamanya berdasarkan gabungan penunjuk TSI dan HMACCI.
Indikator TSI mengandungi purata bergerak pantas dan perlahan untuk menentukan isyarat perdagangan. Apabila garis pantas memecahkan garis perlahan ke atas, ia adalah isyarat beli, dan sebaliknya untuk isyarat jual. Ini dapat menangkap perubahan dalam trend pasaran dengan lebih sensitif.
Indikator HMACCI adalah berdasarkan penunjuk CCI tradisional yang menggunakan Hull Moving Average dan bukannya harga itu sendiri, yang boleh menapis beberapa bunyi bising dan menilai zon overbought dan oversold. Zon overbought dan oversold dapat mengesahkan arah isyarat penunjuk TSI.
Logik utama strategi ini adalah untuk menggabungkan penilaian kedua-dua penunjuk ini dan menetapkan beberapa syarat tambahan untuk menapis isyarat palsu, seperti memeriksa harga penutupan bar terdahulu dan harga maksimum dan minimum dalam beberapa tempoh untuk mengawal kualiti isyarat pembalikan.
Untuk membuka kedudukan, jika syarat dipenuhi, pesanan pasaran diletakkan setiap kali bar ditutup, pergi lama dan pendek.
Untuk mengambil keuntungan dan menghentikan kerugian, pembiakan berhenti rugi terapung dan menutup semua pesanan apabila mencapai keuntungan sasaran ditetapkan.
Kelebihan Strategi
Ini adalah strategi lindung nilai frekuensi tinggi yang agak stabil dan boleh dipercayai.
- Gabungan penunjuk dua dapat mengelakkan isyarat palsu dengan berkesan
- Operasi lindung nilai yang kerap setiap bar membawa kepada turun naik yang lebih stabil dalam keuntungan dan kerugian
- Logik pembukaan yang ketat dan keadaan stop loss boleh mengawal risiko
- Menggabungkan keputusan trend dan pembalikan membawa kepada toleransi kesalahan yang lebih tinggi
- Tiada bias arah, sesuai untuk pelbagai keadaan pasaran
- Ruang parameter yang boleh diselaraskan yang besar, boleh dioptimumkan untuk produk yang berbeza
Analisis Risiko
Risiko utama yang perlu diperhatikan ialah:
- Lebih banyak kerugian bayaran yang disebabkan oleh perdagangan frekuensi tinggi
- Kemungkinan untuk mengelakkan sepenuhnya terkunci dalam pagar pagar
- Masuk yang terlalu agresif jika parameter tidak ditetapkan dengan betul
- Kesukaran untuk menahan kerugian besar satu hala dalam jangka pendek
Risiko boleh dikurangkan melalui:
- Sesuaikan kekerapan pembukaan dengan sewajarnya untuk mengurangkan kesan yuran
- Mengoptimumkan parameter penunjuk untuk memastikan kualiti isyarat
- Meningkatkan amplitud stop loss tetapi mengalami lebih banyak kerugian lindung nilai
- Parameter ujian pada produk yang berbeza
Arahan pengoptimuman
Masih ada ruang yang besar untuk mengoptimumkan strategi ini, terutamanya:
- Mengoptimumkan parameter seperti tempoh, panjang dan lain-lain melalui ujian
- Mencuba kombinasi penunjuk yang berbeza e.g. MACD, BOLL dll.
- Mengubahsuai logik pembukaan, menetapkan penapis yang lebih ketat
- Mengoptimumkan mengambil keuntungan dan strategi berhenti kerugian e.g. dinamik, berhenti pecah
- Menggunakan kaedah pembelajaran mesin untuk mencari julat parameter yang lebih stabil
- Ujian pada produk perdagangan dan jangka masa yang berbeza
- Menggabungkan pengesanan trend untuk mengelakkan perdagangan yang terlalu agresif di pasaran terhad julat
Kesimpulan
Secara keseluruhan, strategi ini adalah strategi lindung nilai yang stabil dan boleh dipercayai dengan toleransi ralat yang tinggi. Ia menggabungkan indikator trend dan pembalikan, memperoleh pulangan yang stabil melalui perdagangan dua arah yang kerap. Juga, strategi itu sendiri mempunyai potensi yang kuat untuk pengoptimuman, dan mewakili idea perdagangan frekuensi tinggi yang berbaloi untuk diteliti lebih lanjut.
/*backtest
start: 2023-12-01 00:00:00
end: 2023-12-31 23:59:59
period: 1h
basePeriod: 15m
exchanges: [{"eid":"Futures_Binance","currency":"BTC_USDT"}]
*/

// This source code is subject to the terms of the suns bipolarity
//©SeaSide420
//@version=4
strategy(title="TSI HMA CCI", default_qty_type=strategy.cash,default_qty_value=1000,commission_type=strategy.commission.percent,commission_value=0.001)
long = input(title="TSI Long Length", type=input.integer, defval=25)
short = input(title="TSI Short Length", type=input.integer, defval=25)
signal = input(title="TSI Signal Length", type=input.integer, defval=13)
length = input(33, minval=1, title="HMACCI Length")
src = input(open, title="Price Source")
ld = input(50, minval=1, title="Line Distance")
CandlesBack = input(8,minval=1,title="Candles Look Back")
StopLoss= input(3000,minval=1, title="Stop Loss")
TargetProfitAll= input(3000,minval=1, title="Target Profit Close All")
FromMonth=input(defval=1,title="FromMonth",minval=1,maxval=12)
FromDay=input(defval=1,title="FromDay",minval=1,maxval=31)
FromYear=input(defval=2020,title="FromYear",minval=2020)
ToMonth=input(defval=1,title="ToMonth",minval=1,maxval=12)
ToDay=input(defval=1,title="ToDay",minval=1,maxval=31)
ToYear=input(defval=9999,title="ToYear",minval=2017)
start=timestamp(FromYear,FromMonth,FromDay,00,00)
finish=timestamp(ToYear,ToMonth,ToDay,23,59)
window()=>true
ul = (ld)
ll = (ld-ld*2)
ma = hma(src, length)
cci = (src - ma) / (0.015 * dev(src, length))
price = close
double_smooth(src, long, short) =>
	fist_smooth = ema(src, long)
	ema(fist_smooth, short)
pc = change(price)
double_smoothed_pc = double_smooth(pc, long, short)
double_smoothed_abs_pc = double_smooth(abs(pc), long, short)
tsi_value = 100 * (double_smoothed_pc / double_smoothed_abs_pc)*10
tsi_value2=ema(tsi_value/10, signal)*10
cc = color.white
ct = color.new(color.gray, 90)
if cci<ll or cci[1]<ll
    cc:=color.red
if cci>ul or cci[1]>ul
    cc:=color.green
if cci<ul and cci>ll
    cc:=color.new(color.yellow, 90)
ccc = color.white
if cci>ul
    ccc:=color.green
if cci<cci[1] and cci<ul and cci>ll
    ccc:=color.red
if cci<ll
    ccc:=color.red
if cci>cci[1] and cci>ll and cci<ul
    ccc:=color.green
tsiplot= plot(tsi_value, color=color.lime)
tsiplot2=plot(tsi_value2, color=color.red)
colorchange2 =tsi_value>tsi_value2?color.lime:color.orange
fill(tsiplot, tsiplot2, color=colorchange2, title="TSIBackground", transp=50)
band1 = hline(ul, "Upper Band 1", color=ct, linestyle=hline.style_dashed)
band0 = hline(ll, "Lower Band 1", color=ct, linestyle=hline.style_dashed)
fill(band1, band0, color=cc, title="MidBandBackground", transp=0)
band2 = hline(ul, "Upper Band 2", color=ct, linestyle=hline.style_dashed)
band3 = hline(ll, "Lower Band 2", color=ct, linestyle=hline.style_dashed)
cciplot2 = plot(cci, "CCIvHMA 2", color=color.black, transp=0, linewidth=5)
cciplot = plot(cci, "CCIvHMA", color=ccc, transp=0, linewidth=3)
hline(0, title="Zero")
hline(420, title="420")
hline(-420, title="-420")
fill(cciplot, cciplot2, color=ccc, title="CCIBackground", transp=0)
LongCondition=cci>cci[1] and cci>ll and src>src[CandlesBack] and tsi_value>tsi_value2
ShortCondition=cci<cci[1] and cci<ul and src<src[CandlesBack] and tsi_value<tsi_value2
plotshape(LongCondition, title="BUY", style=shape.circle, location=location.top, color=color.green)
plotshape(ShortCondition, title="SELL", style=shape.circle, location=location.top, color=color.red)
if  strategy.openprofit>TargetProfitAll
    strategy.close_all(when=window(),comment="close all profit target")
if LongCondition and strategy.openprofit>-1
    strategy.order("BUY", strategy.long,when=window())
if ShortCondition and strategy.openprofit>-1
    strategy.order("SELL", strategy.short,when=window())
strategy.exit("SL exit a sell", "SELL", loss = StopLoss,when=window())
strategy.exit("SL exit a buy", "BUY", loss = StopLoss,when=window())
- Strategi Perpindahan Indeks Momentum dan Takut
- Strategi Dagangan Panjang/Pendek Secara Automatik Berdasarkan Titik Pivot Harian
- Strategi Perdagangan Kepelbagaian Purata Bergerak
- Strategi Perpindahan Momentum Berdasarkan Purata Bergerak Eksponensial
- Adaptive Moving Average dan Strategi Dagangan Crossover Moving Average
- RSI MACD Multi-timeframe CCI StochRSI MA Strategi Perdagangan Linier
- Trend MACD Berbilang Jangka Masa Mengikut Strategi
- Trend Mengikut Strategi Dagangan Berdasarkan MACD dan RSI
- Tren ATR dan RSI adaptif mengikut strategi dengan Stop Loss Trailing
- Trend MACD Crossover Dual Moving Average Mengikut Strategi
- Algoritma Silang Emas Rata-rata Bergerak Berganda
- Golden Cross Death Cross Strategi pelbagai faktor jangka panjang
- Strategi Perdagangan Divergensi RSI
- Trend Pelbagai Jangka Masa Mengikut Strategi
- Strategi Perdagangan Grid Dinamik
- Strategi Garis Kelebihan Pengesahan Purata Bergerak Berganda
- Crypto RSI Mini-Sniper Quick Response Trend Mengikut Strategi