Bollinger Bands dan Strategi Gabungan RSI
Penulis:ChaoZhang, Tarikh: 2024-01-30 15:15:32Tag:

Ringkasan
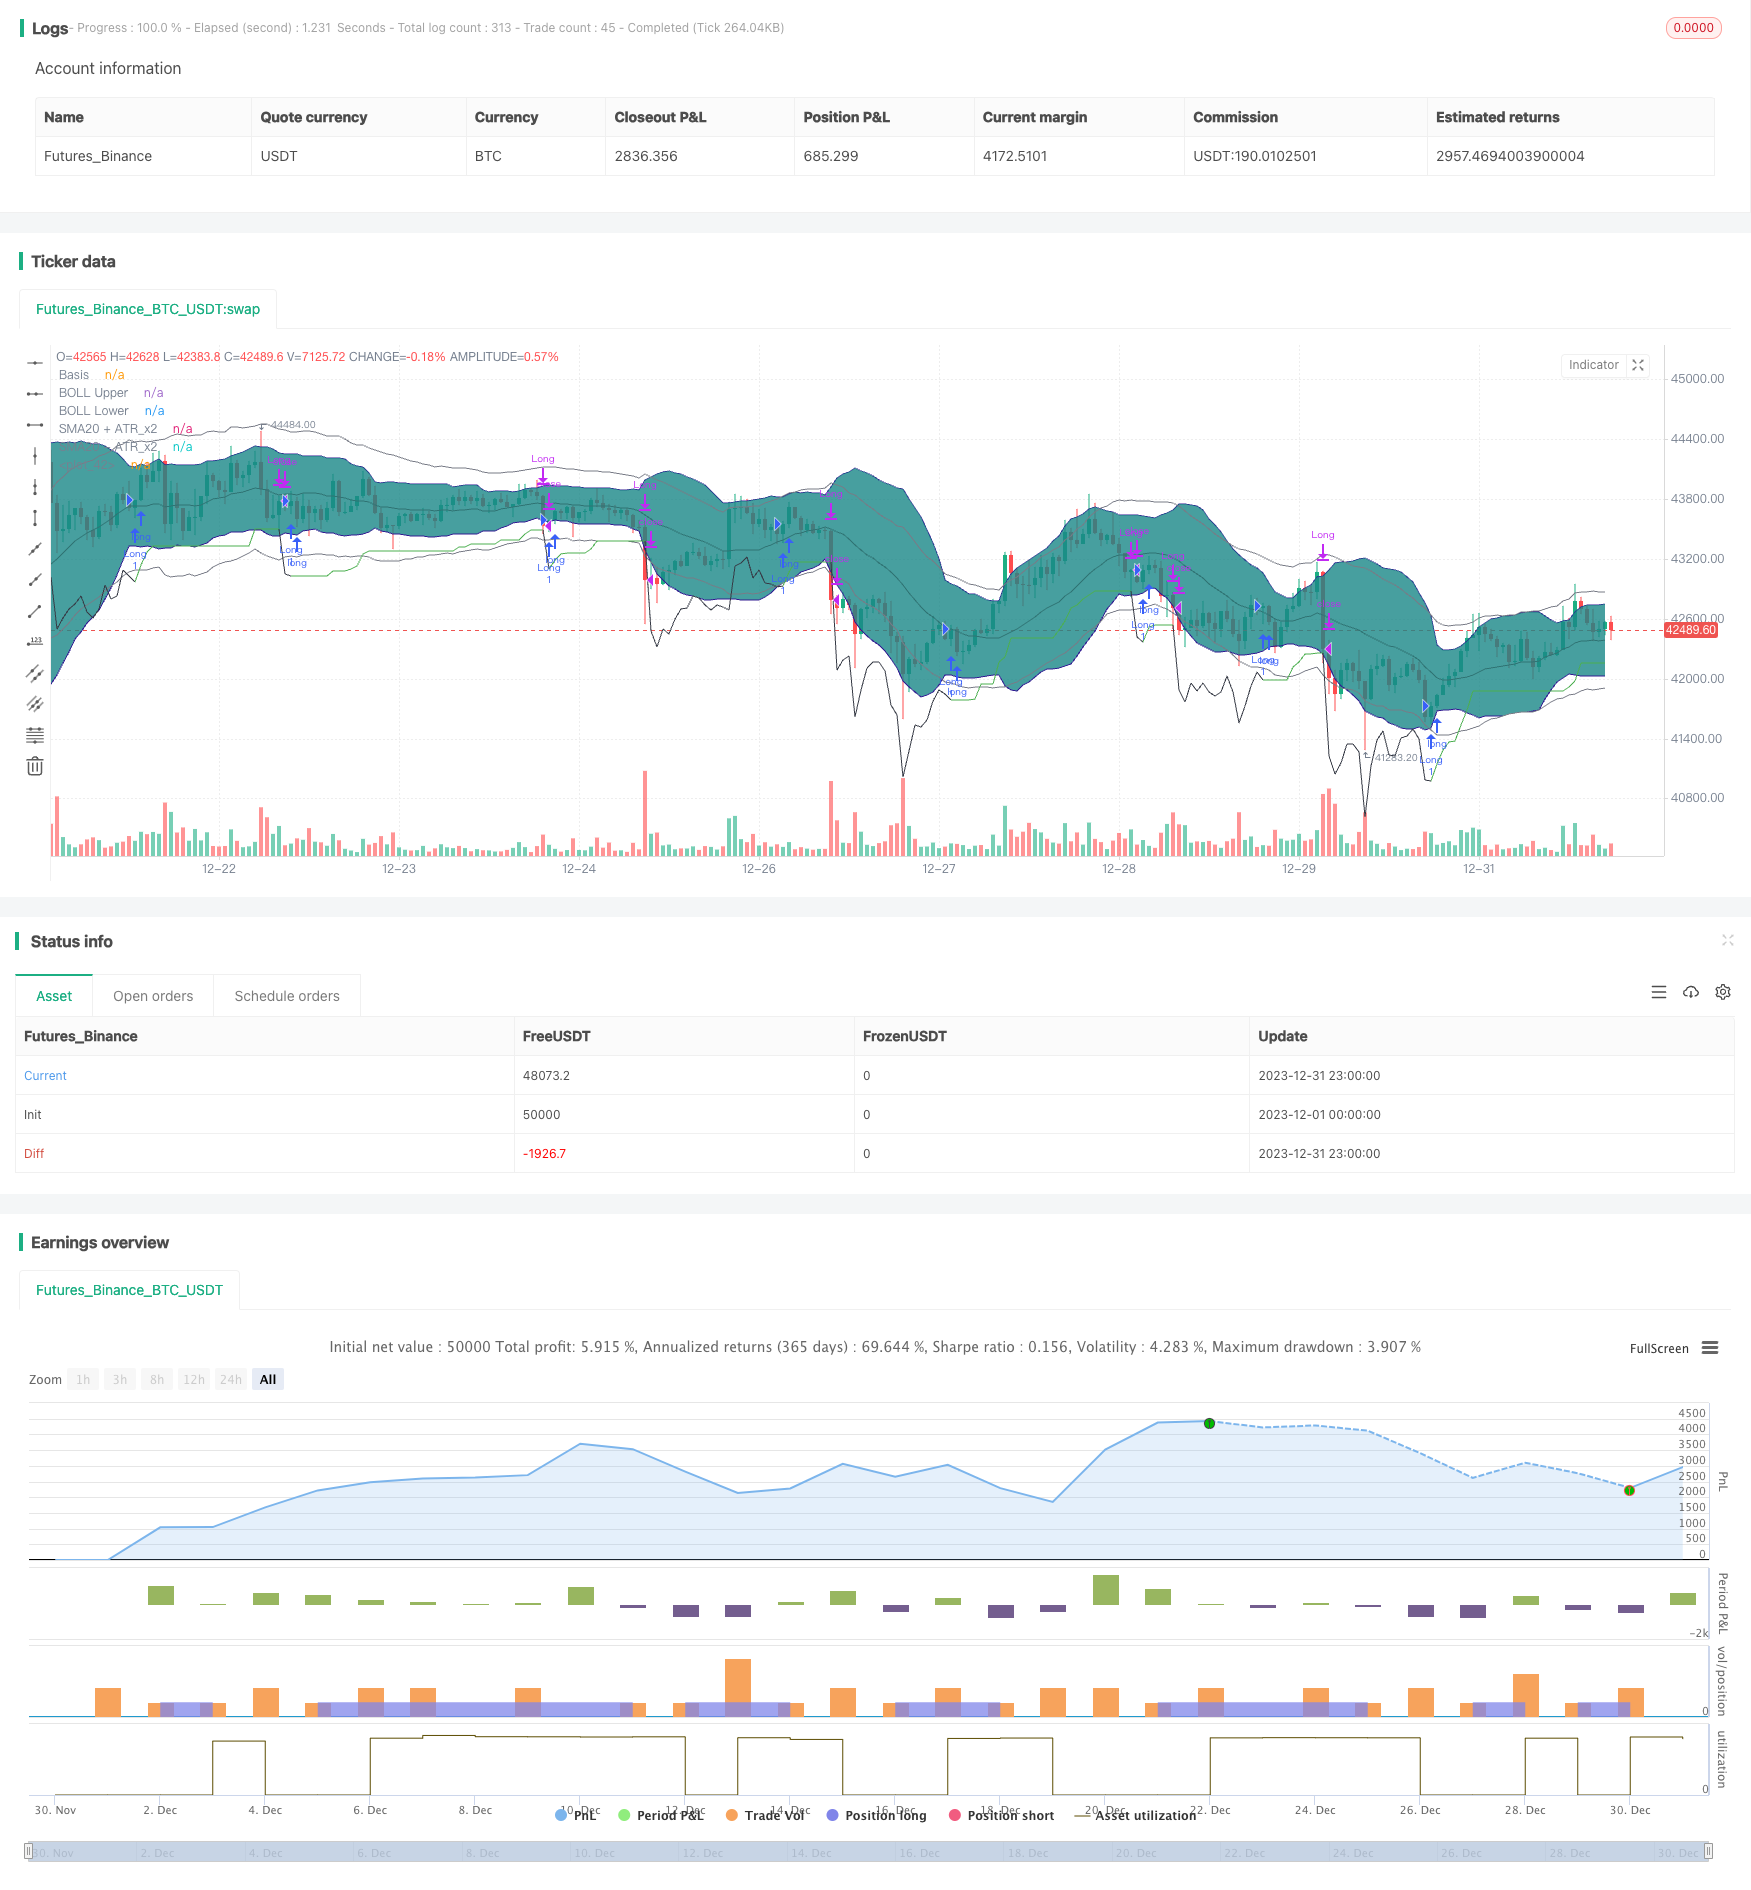
Strategi ini menggabungkan Bollinger Bands dan Indeks Kekuatan Relatif (RSI) untuk mengenal pasti peluang apabila Bollinger Bands memerah dan RSI meningkat, dengan menghentikan kerugian untuk mengawal risiko.
Logika Strategi
Logik teras strategi ini adalah untuk mengenal pasti perampasan Bollinger Bands dan meramalkan harga pecah apabila RSI berada dalam trend menaik. Khususnya, apabila penyimpangan standard 20-period BB band tengah adalah kurang daripada ATR * 2, kita menentukan BB menekan berlaku; Sementara itu, jika kedua-dua 10 dan 14 tempoh RSI meningkat, kita meramalkan harga mungkin memecahkan di atas BB band atas tidak lama lagi dan pergi lama.
Selepas memasuki pasaran, kami menggunakan jarak keselamatan ATR + adaptif stop loss untuk mengunci keuntungan dan menguruskan risiko. Posisi akan ditutup apabila harga mencapai stop loss atau RSI menjadi overbought (14-period RSI melebihi 70 dan 10-period RSI melebihi 14).
Analisis Kelebihan
Kelebihan terbesar strategi ini adalah untuk mengenal pasti tempoh penyatuan dengan memerah BB dan meramalkan arah pecah dengan RSI. Juga, menggunakan stop loss adaptif berdasarkan turun naik pasaran dan bukannya stop loss tetap dapat mengunci keuntungan dengan lebih baik sambil mengawal risiko.
Analisis Risiko
Risiko utama strategi ini adalah salah mengenal pasti BB memerah dan RSI uptrend, yang boleh membawa kepada pecah palsu. Selain itu, stop loss adaptif mungkin gagal untuk menutup kedudukan tepat pada masanya semasa turun naik yang tinggi.
Garis Panduan Pengoptimuman
Strategi ini boleh dioptimumkan lagi dalam aspek berikut:
-
Meningkatkan parameter BB untuk mengenal pasti memerah dengan lebih tepat
-
Uji nilai yang berbeza untuk tempoh RSI
-
Periksa teknik stop loss lain seperti SL melengkung atau SL yang melihat ke belakang
-
Sesuaikan parameter berdasarkan ciri simbol
Kesimpulan
Strategi ini memanfaatkan pelengkap BB dan RSI untuk mencapai pulangan yang diselaraskan risiko yang baik. Pengoptimuman lanjut mengenai aspek seperti stop loss dan penyesuaian parameter dapat menjadikannya lebih sesuai untuk instrumen perdagangan yang berbeza.
/*backtest
start: 2023-12-01 00:00:00
end: 2023-12-31 23:59:59
period: 1h
basePeriod: 15m
exchanges: [{"eid":"Futures_Binance","currency":"BTC_USDT"}]
*/

// This source code is subject to the terms of the Mozilla Public License 2.0 at https://mozilla.org/MPL/2.0/
// © DojiEmoji
//

//@version=4
strategy("[KL] BOLL + RSI Strategy",overlay=true,pyramiding=1)

// Timeframe {
backtest_timeframe_start = input(defval = timestamp("01 Apr 2016 13:30 +0000"), title = "Backtest Start Time", type = input.time)
USE_ENDTIME = input(false,title="Define backtest end-time (If false, will test up to most recent candle)")
backtest_timeframe_end = input(defval = timestamp("01 May 2021 19:30 +0000"), title = "Backtest End Time (if checked above)", type = input.time)
within_timeframe = true
// }

// Bollinger bands (sdv=2, len=20) {
BOLL_length = 20, BOLL_src = close, SMA20 = sma(BOLL_src, BOLL_length), BOLL_sDEV_x2 = 2 * stdev(BOLL_src, BOLL_length)
BOLL_upper = SMA20 + BOLL_sDEV_x2, BOLL_lower = SMA20 - BOLL_sDEV_x2
plot(SMA20, "Basis", color=#872323, offset = 0)
BOLL_p1 = plot(BOLL_upper, "BOLL Upper", color=color.navy, offset = 0, transp=50)
BOLL_p2 = plot(BOLL_lower, "BOLL Lower", color=color.navy, offset = 0, transp=50)
fill(BOLL_p1, BOLL_p2, title = "Background", color=#198787, transp=85)
// }

// Volatility Indicators {
ATR_x2 = atr(BOLL_length) * 2 // multiplier aligns with BOLL
avg_atr = sma(ATR_x2, input(1,title="No. of candles to lookback when determining ATR is decreasing"))
plot(SMA20+ATR_x2, "SMA20 + ATR_x2", color=color.gray, offset = 0, transp=50)
plot(SMA20-ATR_x2, "SMA20 - ATR_x2", color=color.gray, offset = 0, transp=50)
plotchar(ATR_x2, "ATR_x2", "", location = location.bottom)
//}

// Trailing stop loss {
TSL_source = low
var entry_price = float(0), var stop_loss_price = float(0)

trail_profit_line_color = color.green
if strategy.position_size == 0 or not within_timeframe
    trail_profit_line_color := color.black
    stop_loss_price := TSL_source - ATR_x2
else if strategy.position_size > 0
    stop_loss_price := max(stop_loss_price, TSL_source - ATR_x2)
plot(stop_loss_price, color=trail_profit_line_color)

if strategy.position_size > 0 and stop_loss_price > stop_loss_price[1]
	alert("Stop loss limit raised", alert.freq_once_per_bar)

// } end of Trailing stop loss

//Buy setup - Long positions {
is_squeezing = ATR_x2 > BOLL_sDEV_x2
if is_squeezing and within_timeframe and not is_squeezing[1]
	alert("BOLL bands are squeezing", alert.freq_once_per_bar)
else if not is_squeezing and within_timeframe and is_squeezing[1]
	alert("BOLL bands stopped squeezing", alert.freq_once_per_bar)

ema_trend = ema(close, 20)

concat(a, b) =>
	concat = a
	if a != ""
		concat := concat + ", "
	concat := concat + b
	concat
// }

// Sell setup - Long position {
rsi_10 = rsi(close, 10), rsi_14 = rsi(close, 14)
overbought = rsi_14 > input(70,title="[Exit] RSI(14) value considered as overbought") and rsi_10 > rsi_14
// } end of Sell setup - Long position

// MAIN: {
if within_timeframe
	entry_msg = ""
	exit_msg = ""

    // ENTRY {
	conf_count = 0
    volat_decr = avg_atr <= avg_atr[1]
	rsi_upslope = rsi_10 > rsi_10[1] and rsi_14 > rsi_14[1]

	if volat_decr and rsi_upslope and is_squeezing and strategy.position_size == 0
		strategy.entry("Long",strategy.long, comment=entry_msg)
		entry_price := close
		stop_loss_price := TSL_source - ATR_x2
	// }

    // EXIT	{
	if strategy.position_size > 0
		bExit = false
		if close <= entry_price and TSL_source <= stop_loss_price
            exit_msg := concat(exit_msg, "stop loss [TSL]")
			bExit := true
        else if close > entry_price and TSL_source <= stop_loss_price
            exit_msg := concat(exit_msg, "take profit [TSL]")
            bExit := true
		else if overbought
			exit_msg := concat(exit_msg, "overbought")
			bExit := true

        strategy.close("Long", when=bExit, comment=exit_msg)
	// }
// }

// CLEAN UP:
if strategy.position_size == 0 and not is_squeezing
	entry_price := 0
	stop_loss_price := float(0)
- Strategi Dagangan Momentum 5 Minit Berdasarkan MACD dan RSI
- Strategi Penembusan Fractal Berganda
- Noro Bertukar Strategi Stop Loss Moving Average
- Strategi Dagangan RSI Rata-rata Bergerak Eksponensial Berganda
- Strategi silang purata bergerak mudah
- Strategi Scalping Berdasarkan Kecairan dan Trend Pasaran
- Strategy 5EMA untuk Peralihan Penembusan Jangka Pendek Salib
- Strategi Perdagangan Saham Berasaskan Penunjuk RSI
- Semua tentang Strategi Perdagangan Saluran EMA
- Strategi Perdagangan RSI Double Decker
- Double Inside Bar & Trend Strategi
- Strategi Penembusan Harga Luar Biasa
- Strategi Pelancongan Trend yang Kuat
- Strategi Crossover Purata Bergerak Pengesanan Trend
- Model Pembalikan Penembusan Berdasarkan Strategi Perdagangan Penyu
- Strategi Trend Momentum
- Peanut 123 Peralihan dan Julat Penembusan Strategi Dagangan Jangka Pendek
- Strategi Perdagangan Saham Berasaskan RSI yang Dihapuskan
- Strategi Band Volatiliti yang lancar
- Strategi Perdagangan Pembalikan Indeks Saluran Komoditi