Strategi Hentian Belakang ATR Berganda
Penulis:ChaoZhang, Tarikh: 2024-01-31 17:10:32Tag:

Ringkasan
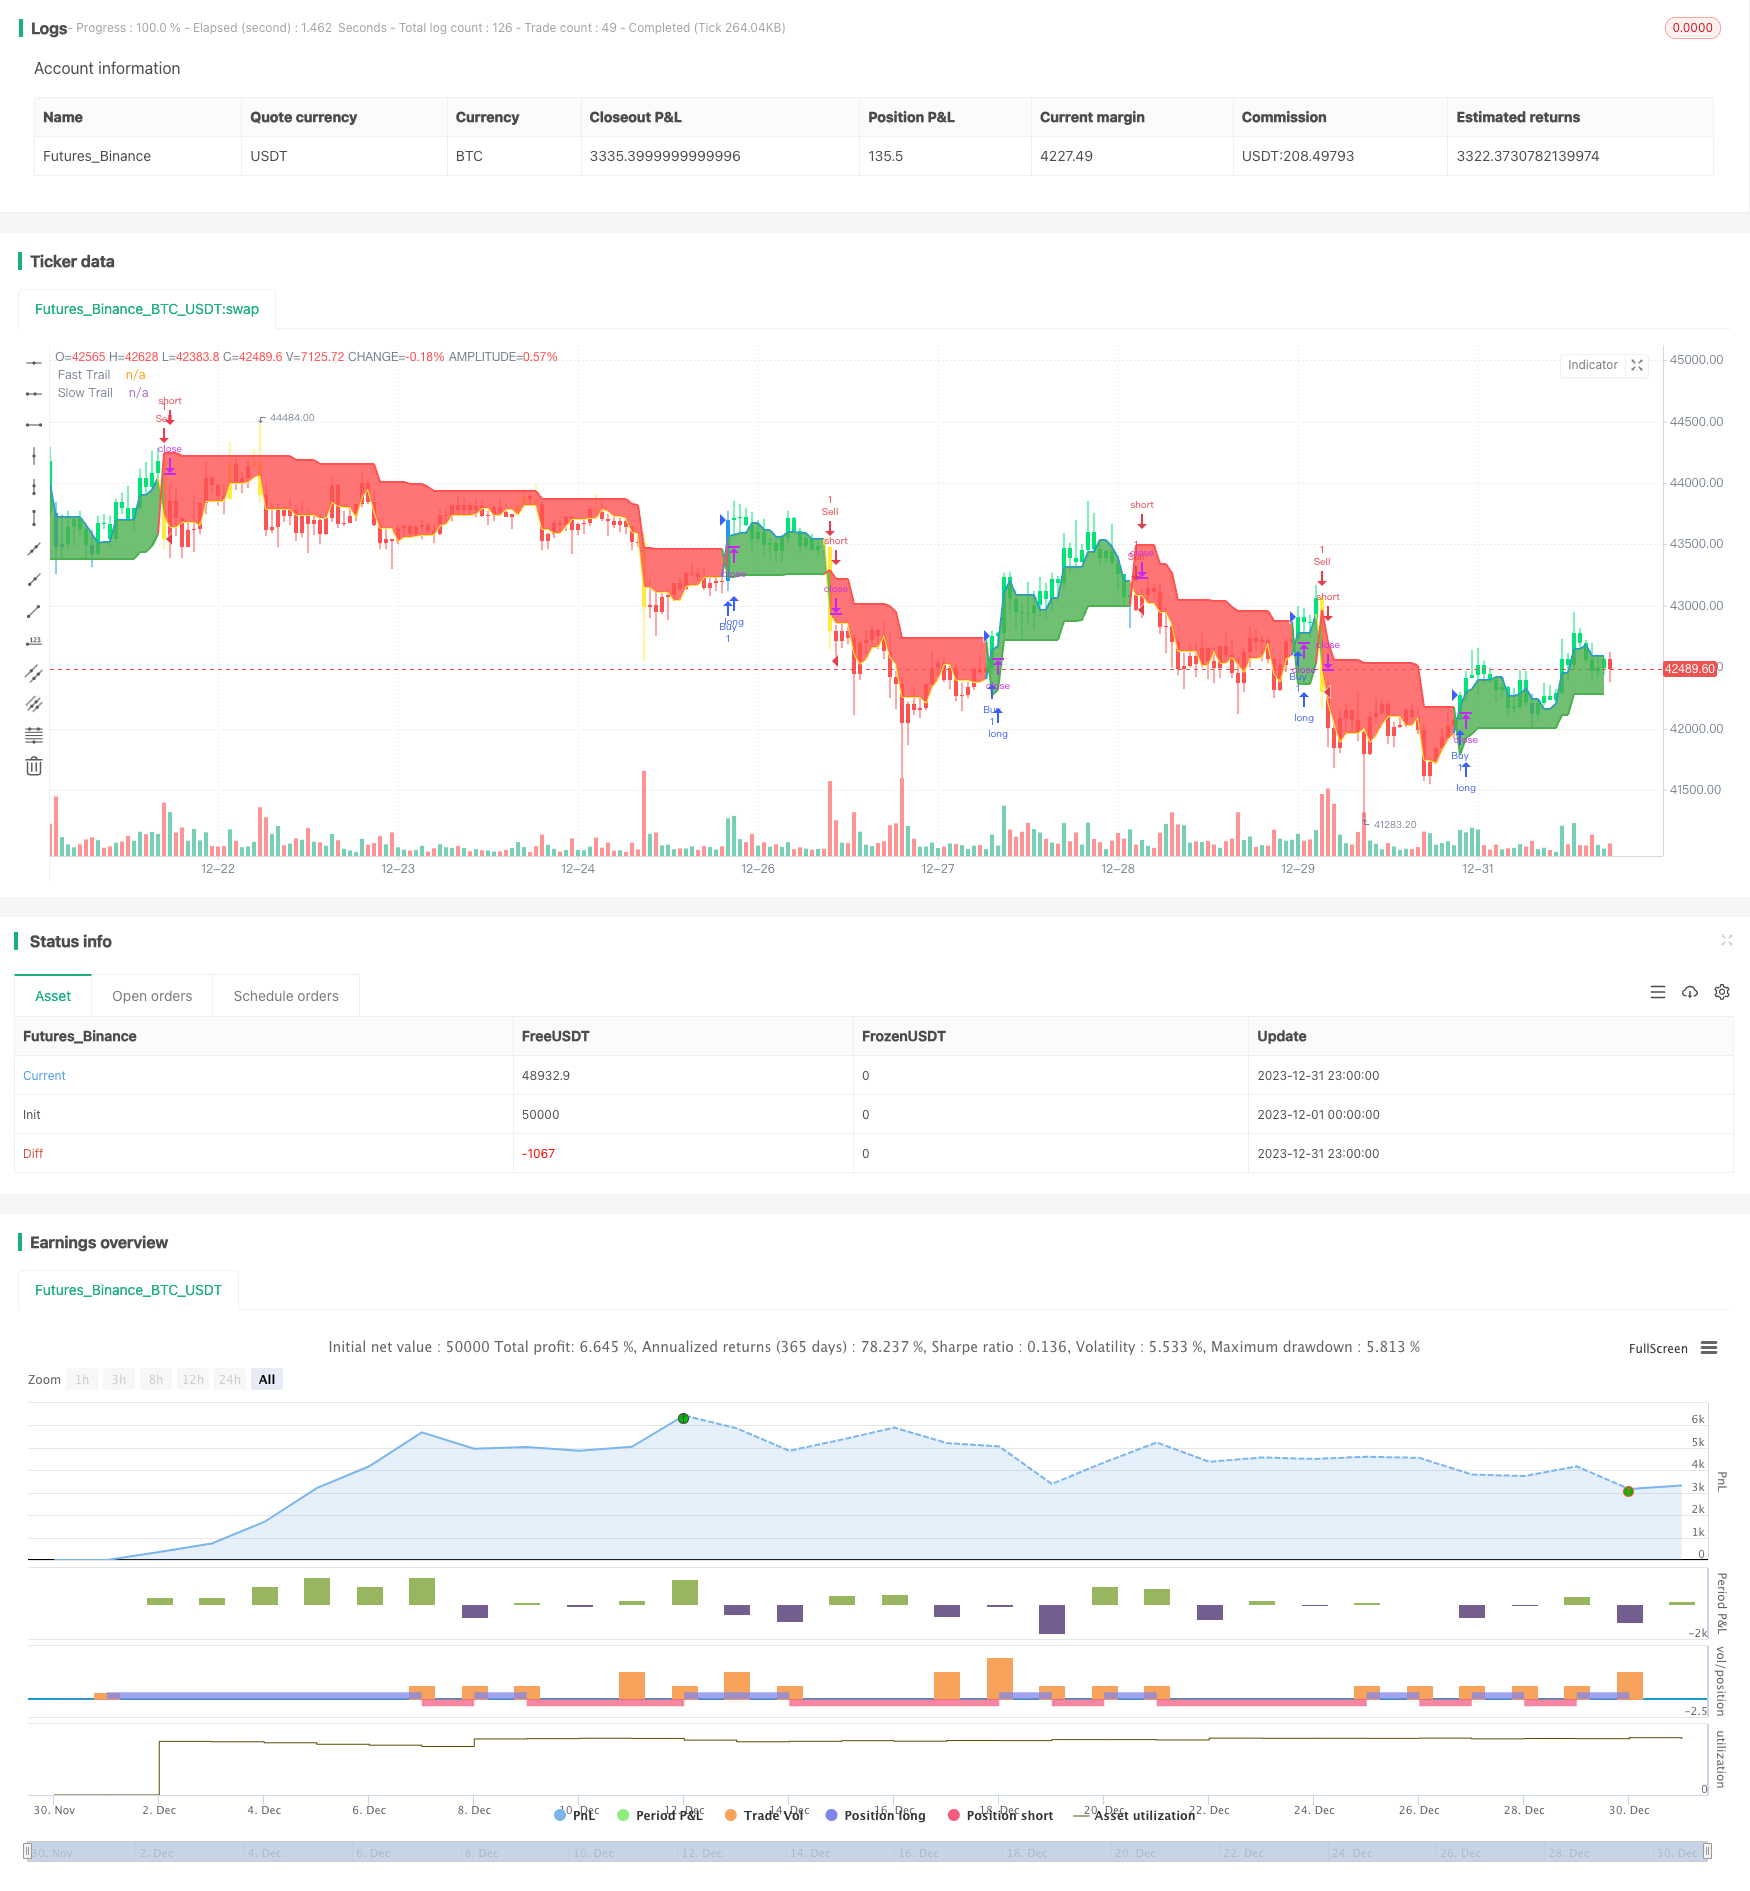
Dual ATR Trailing Stop adalah strategi perdagangan jangka pendek berdasarkan penunjuk Average True Range (ATR). Strategi ini menetapkan dua garis stop loss, garis ATR pantas dan garis ATR perlahan, pada masa yang sama, dan menentukan masuk dan keluar berdasarkan persilangan kedua-dua garis. Strategi ini mudah, responsif, dan sesuai untuk pasaran turun naik yang tinggi.
Prinsip Strategi
Inti strategi ini adalah menggunakan dua garis stop loss ATR. Satu adalah garis ATR pantas dengan tempoh pendek dan pengganda kecil untuk tindak balas pantas. Yang lain adalah garis ATR perlahan dengan tempoh yang lebih lama dan pengganda yang lebih besar untuk penapisan. Apabila garis ATR pantas melintasi di atas garis ATR perlahan, ia menghasilkan isyarat beli. Apabila garis ATR pantas melintasi di bawah garis ATR perlahan, ia menghasilkan isyarat jual. Jadi strategi menggunakan persilangan dua garis ATR untuk menentukan masuk dan keluar, yang dapat mengawal stop loss dengan berkesan.
Logik tertentu adalah: mengira garisan ATR cepat dan garisan ATR perlahan. Apabila harga di atas garis perlahan, gunakan garisan pantas untuk menyusuri stop loss. Jika tidak, gunakan garisan perlahan untuk menyusuri stop loss. Warna Kline mewakili garisan stop loss semasa. Hijau dan biru bermaksud menggunakan garisan pantas. Merah dan kuning bermaksud menggunakan garisan perlahan. Keluar apabila harga pasaran menyentuh garisan stop loss.
Analisis Kelebihan
Kelebihan strategi ini ialah:
- Logik yang mudah dan jelas, mudah difahami dan dilaksanakan.
- Cepat bertindak balas terhadap perubahan pasaran, sesuai untuk pasaran turun naik yang tinggi.
- Kontrol kehilangan henti ATR berganda mengambil risiko dengan berkesan.
- Indikator ATR adalah parameter untuk menyesuaikan julat stop loss.
- Warna visual Kline menunjukkan keadaan stop loss dengan jelas.
Analisis Risiko
Terdapat juga beberapa risiko:
- Kecenderungan untuk terlalu berdagang.
- ATR mempunyai pemasangan lengkung yang buruk, boleh memperkuat kerugian.
- Tidak dapat menapis pasaran sampingan dan tren dengan berkesan.
Kita boleh mengurangkan risiko dengan mengoptimumkan tempoh ATR, menyesuaikan pengganda ATR, menggabungkan penunjuk lain untuk penapisan dll.
Arah pengoptimuman
Arah pengoptimuman adalah:
- Mengoptimumkan parameter ATR untuk jarak stop loss yang lebih baik.
- Tambah penunjuk penapis untuk mengelakkan perdagangan yang tidak sah, seperti MA.
- Tambah keadaan terbuka untuk mengelakkan kesalahan.
- Tambah keluar untuk tempoh penahan untuk mengelakkan perdagangan berlebihan.
Kesimpulan
Strategi Dual ATR Trailing Stop mudah difahami dan dilaksanakan, terutama sesuai untuk senario turun naik yang tinggi, dan dapat mengawal risiko dengan berkesan.
/*backtest
start: 2023-12-01 00:00:00
end: 2023-12-31 23:59:59
period: 1h
basePeriod: 15m
exchanges: [{"eid":"Futures_Binance","currency":"BTC_USDT"}]
*/

// This source code is subject to the terms of the Mozilla Public License 2.0 at https://mozilla.org/MPL/2.0/
// © ceyhun

//@version=4
strategy("ATR Trailing Stop Strategy by ceyhun", overlay=true)

/////////notes////////////////////////////////////////
// This is based on the ATR trailing stop indicator //
// width addition of two levels of stops and        //
// different interpretation.                        //
// This is a fast-reacting system and is better     //
// suited for higher volatility markets             //
//////////////////////////////////////////////////////

SC = input(close, "Source", input.source)

// Fast Trail //
AP1 = input(5, "Fast ATR period", input.integer)  // ATR Period
AF1 = input(0.5, "Fast ATR multiplier", input.float)  // ATR Factor
SL1 = AF1 * atr(AP1)  // Stop Loss
Trail1 = 0.0
Trail1 := iff(SC > nz(Trail1[1], 0) and SC[1] > nz(Trail1[1], 0), max(nz(Trail1[1], 0), SC - SL1), iff(SC < nz(Trail1[1], 0) and SC[1] < nz(Trail1[1], 0), min(nz(Trail1[1], 0), SC + SL1), iff(SC > nz(Trail1[1], 0), SC - SL1, SC + SL1)))

// Slow Trail //
AP2 = input(10, "Slow ATR perod", input.integer)  // ATR Period
AF2 = input(2, "Slow ATR multiplier", input.float)  // ATR Factor
SL2 = AF2 * atr(AP2)  // Stop Loss
Trail2 = 0.0
Trail2 := iff(SC > nz(Trail2[1], 0) and SC[1] > nz(Trail2[1], 0), max(nz(Trail2[1], 0), SC - SL2), iff(SC < nz(Trail2[1], 0) and SC[1] < nz(Trail2[1], 0), min(nz(Trail2[1], 0), SC + SL2), iff(SC > nz(Trail2[1], 0), SC - SL2, SC + SL2)))

// Bar color for trade signal //
Green = Trail1 > Trail2 and close > Trail2 and low > Trail2
Blue = Trail1 > Trail2 and close > Trail2 and low < Trail2
Red = Trail2 > Trail1 and close < Trail2 and high < Trail2
Yellow = Trail2 > Trail1 and close < Trail2 and high > Trail2

// Signals //
Bull = barssince(Green) < barssince(Red)
Bear = barssince(Red) < barssince(Green)

Buy = crossover(Trail1, Trail2)
Sell = crossunder(Trail1, Trail2)

TS1 = plot(Trail1, "Fast Trail", style=plot.style_line,color=Trail1 > Trail2 ? color.blue : color.yellow, linewidth=2)
TS2 = plot(Trail2, "Slow Trail", style=plot.style_line,color=Trail1 > Trail2 ? color.green : color.red, linewidth=2)
fill(TS1, TS2, Bull ? color.green : color.red, transp=90)

plotcolor = input(true, "Paint color on chart", input.bool)

bcl = iff(plotcolor == 1, Blue ? color.blue : Green ? color.lime : Yellow ? color.yellow : Red ? color.red : color.white, na)
barcolor(bcl)

if Buy
    strategy.entry("Buy", strategy.long, comment="Buy")

if Sell
    strategy.entry("Sell", strategy.short, comment="Sell")
- Strategi Dagangan Jangka Pendek Berdasarkan RSI dan SMA
- Strategi Dagangan Intraday Momentum Breakout
- KDJ Golden Cross Long Entry Strategy
- Strategi Ribut Breakback dalam Peluang Tersembunyi
- Strategi Pengesanan Momentum Jangka Masa
- Trend purata bergerak mengikut strategi
- Pivot SuperTrend Strategi Melalui Pelbagai Jangka Masa
- corak candlestick kuantitatif dan trend mengikut strategi
- Supertrend digabungkan dengan RSI Strategi Dagangan Kuantitatif
- Cape Town 15 minit Candle Breakout Strategi
- Strategi Pengesanan Pelarian Qullamaggie
- Versi melampau Noro's Trend Moving Averages Strategi
- Strategi Dagangan Momentum Rekursif
- Trend Donchian Mengikuti Strategi
- SuperTrend RSI EMA Crossover Strategi
- Strategi Dagangan Kuantitatif Pergerakan Purata Tiga Titik Dua hala
- Strategi Dagangan Berdasarkan Indikator RSI dan MACD
- Strategi Scalping berasaskan CCI dan EMA
- Strategi Pengesanan Trend Gelombang yang Ditingkatkan
- Ichimoku Masuk Strategi