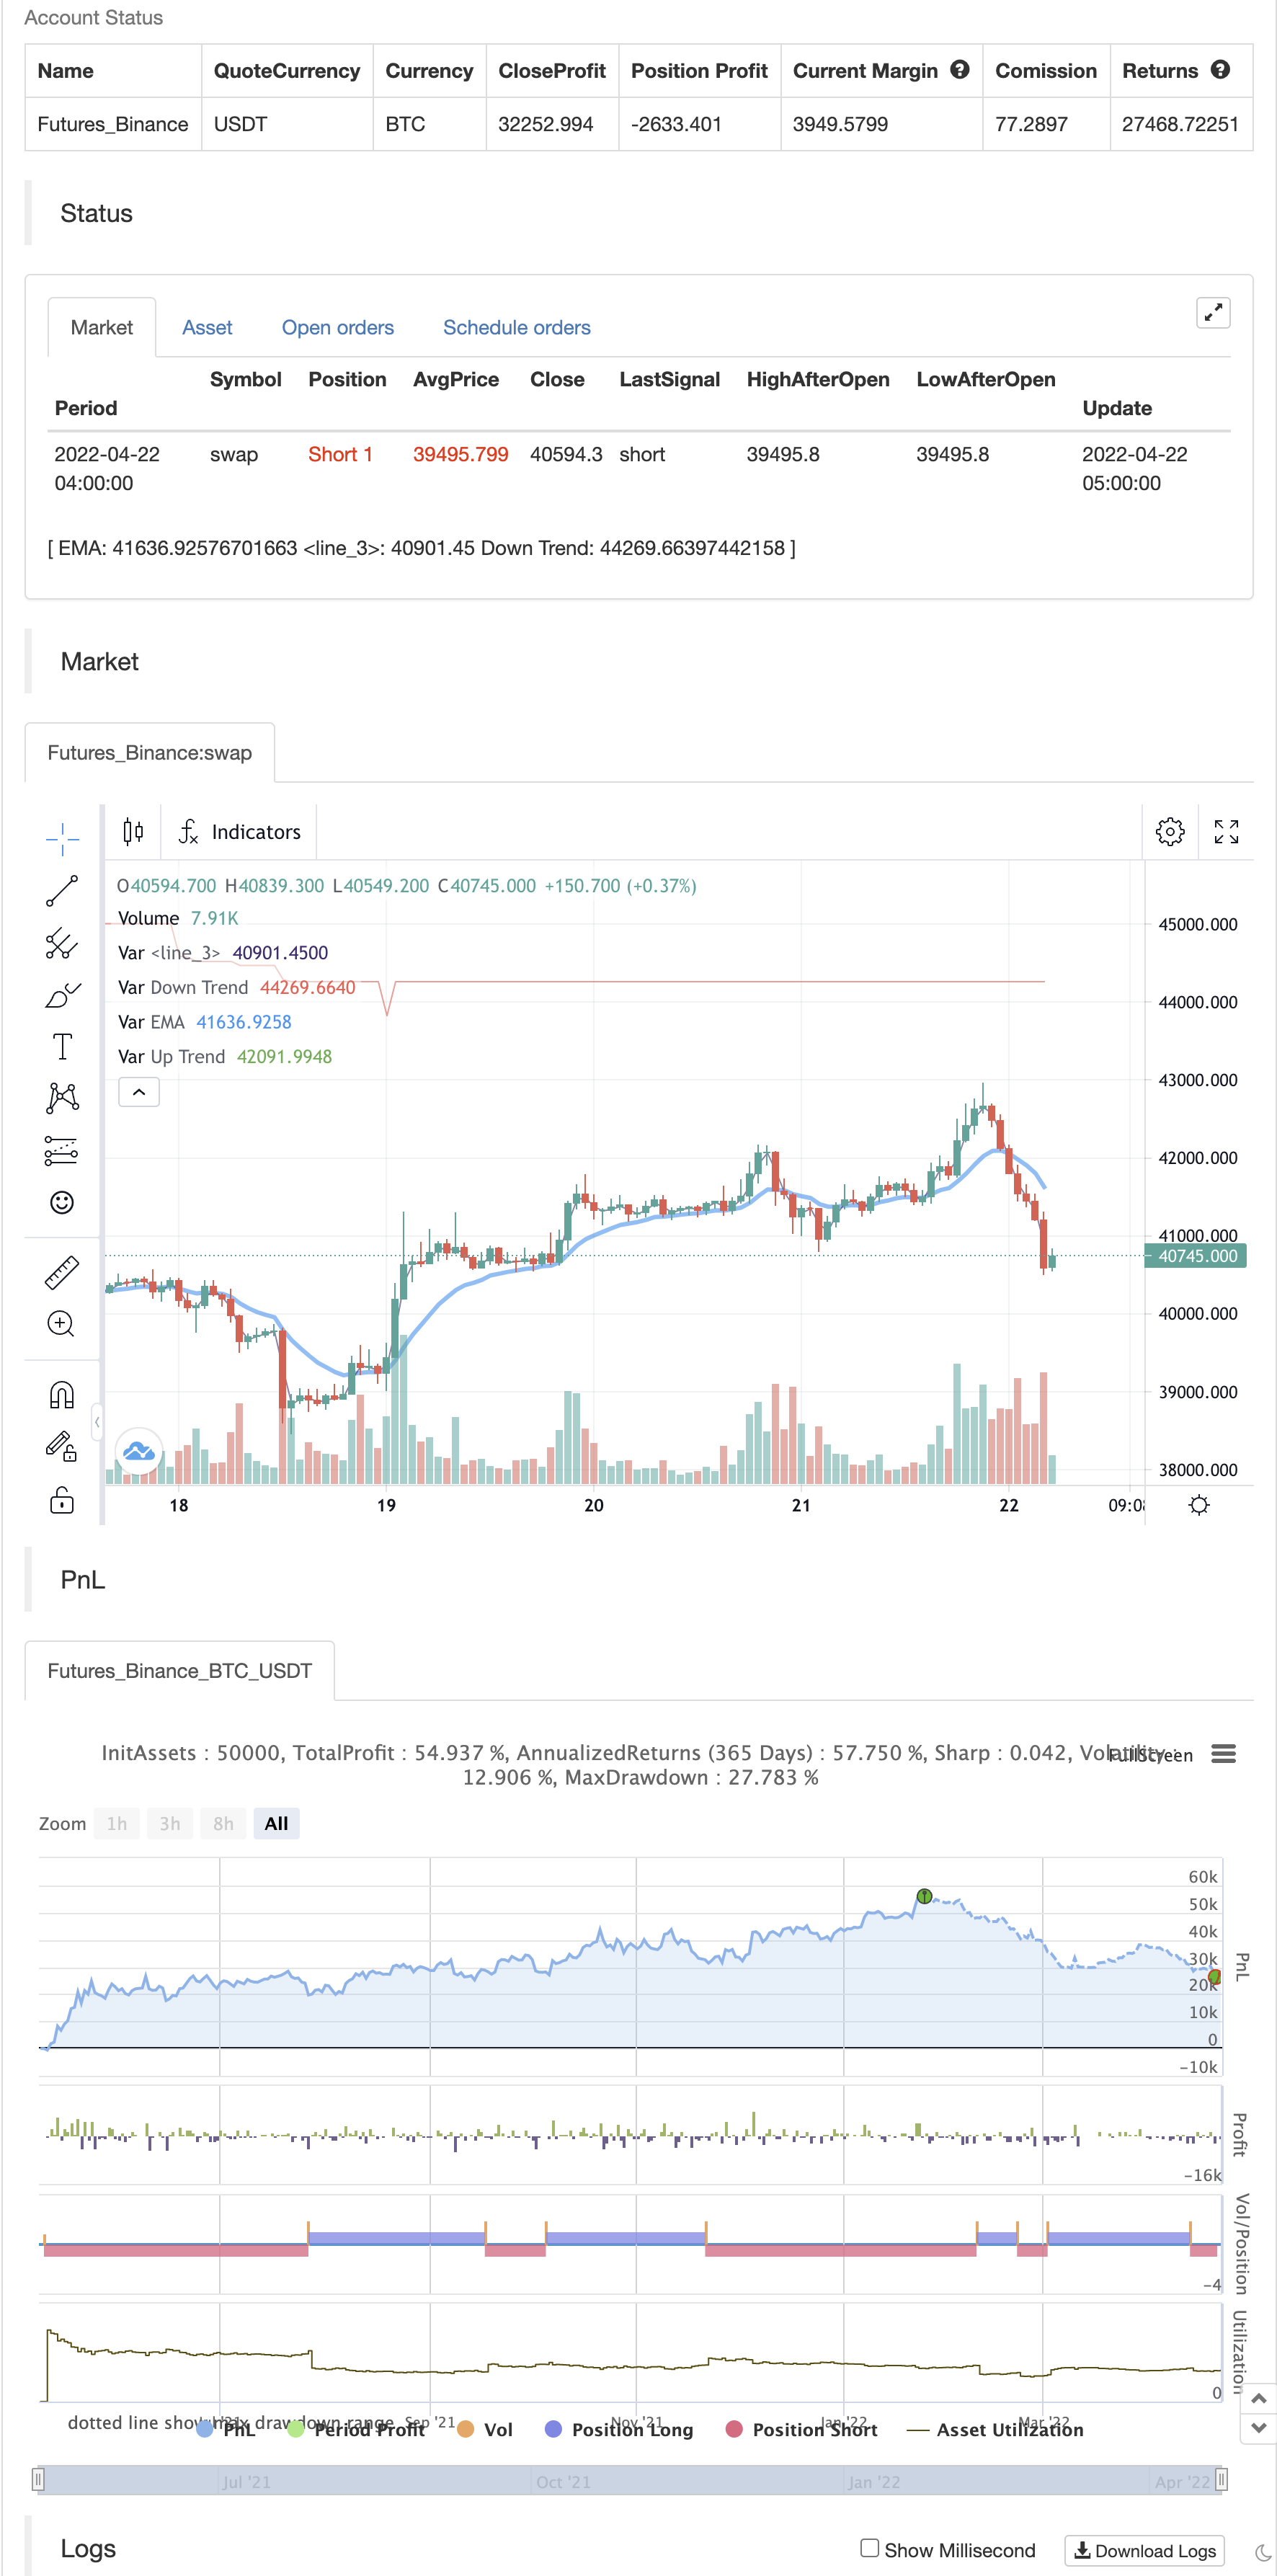
EMA/SMA de cor média móvel
Autora:ChaoZhang, Data: 2022-05-11 21:03:07Tags:EMA
Amazon Prime Video apresenta o Garaj Garaj Jugalbandi Video Song de Bandish Bandits. Uma canção folclórica interpretada por Ritwik Bhowmik e Atul Kulkarni, cantada por Farid Hasan & Mohammed Aman, música dirigida por Shankar Ehsaan Loy e letras de Sameer Samant. No final da temporada, Radhe e Digvijay repetem essa canção como uma ode ao seu professor comum, Panditji.
backtest

/*backtest
start: 2021-05-10 00:00:00
end: 2022-04-22 05:20:00
period: 1h
basePeriod: 15m
exchanges: [{"eid":"Futures_Binance","currency":"BTC_USDT"}]
*/

// This source code is subject to the terms of the Mozilla Public License 2.0 at https://mozilla.org/MPL/2.0/
// © subhajitbhattacharya


//@version=5
indicator('Moving Average Colored EMA/SMA', overlay=true, precision=2)
gr1 = "Moving Average Colored EMA/SMA"
emaplot = input(true, title='Show EMA on chart',group=gr1)
len = input.int(13, minval=1, title='Ema Length',group=gr1)
src = close
out = ta.ema(src, len)
up = out > out[1]
down = out < out[1]
mycolor = up ? color.green : down ? color.red : color.blue
plot(out and emaplot ? out : na, title='EMA', color=mycolor, linewidth=3)


smaplot = input(false, title='Show SMA on chart',group=gr1)
len2 = input.int(23, minval=1, title='Sma Length',group=gr1)
src2 = close
out2 = ta.sma(src2, len2)
up2 = out2 > out2[1]
down2 = out2 < out2[1]
mycolor2 = up2 ? color.green : down2 ? color.red : color.blue
plot(out2 and smaplot ? out2 : na, title='SMA', color=mycolor2, linewidth=1)


//===================== Holders Sentiment ==================================================

gr2 = 'Holders Sentiment'
length = input.int(50,group=gr2)
src3 = input(close, title='Source',group=gr2)

zeroline = 0
// hzplot = plot(zeroline, color=color.new(color.black, 0))
difabs = (src3[0] - src3[length]) / src3[length] * 100
plotColour = difabs > 0 ? color.green : color.red
// changeplot = plot(difabs, color=plotColour, linewidth=2)
// fill(plot1=changeplot, plot2=hzplot, color=color.new(color.blue, 90))

//================ Supertrend ================================================

gr3 = "Supertrend"
tf = input.timeframe('D', "Resolution",group=gr3)
atrPeriod = input(10, "ATR Length",group=gr3)
factor = input.float(3.0, "Factor", step = 0.01,group=gr3)

[supertrend, direction] = request.security(syminfo.tickerid, tf, ta.supertrend(factor, atrPeriod), barmerge.gaps_off, barmerge.lookahead_off)

bodyMiddle = plot((open + close) / 2, display=display.none)
upTrend = plot(direction < 0 ? supertrend : na, "Up Trend", color = color.green, style=plot.style_linebr)
downTrend = plot(direction < 0? na : supertrend, "Down Trend", color = color.red, style=plot.style_linebr)

//fill(bodyMiddle, upTrend, color.new(color.green, 90), fillgaps=false)
//fill(bodyMiddle, downTrend, color.new(color.red, 90), fillgaps=false)

//=================================================================================

bs1 = ta.crossover(out,out2) ? 1 : ta.crossunder(out,out2) ? -1 : 0
bs2 = difabs > 0 ? 1 : -1
bs3 = direction < 0 ? 1 : -1
bs = 0
bs := bs1 == 1 and bs2 == 1 and bs3 == 1 ? 1 : bs1 == -1 and bs2 == -1 and bs3 == -1 ? -1 : 0

buy = bs == 1 and nz(bs[1]) !=1
sell = bs == -1 and nz(bs[1]) != -1

//bgcolor(buy ? color.new(#00ff00, 50) : na)
//if buy
//    label.new(bar_index, low, yloc = yloc.belowbar, text="Buy", textcolor = #00ff00, size = size.large, style=label.style_none)
//
//bgcolor(sell ? color.new(#b92ad8, 80) : na)
//if sell
//    label.new(bar_index,high, yloc = yloc.abovebar, text="Sell", textcolor = #b92ad8, size = size.large, style=label.style_none)


alertcondition(buy, title='Buy Alert', message='Buy')
alertcondition(sell, title='sell Alert', message='Sell')


if buy
    strategy.entry("Enter Long", strategy.long)
else if sell
    strategy.entry("Enter Short", strategy.short)
Relacionado
- Julgamento de tendências multidimensionais e estratégias de stop loss dinâmicas do ATR
- Tendências de negociação confirmadas por múltiplos indicadores avançados
- Estratégias de rastreamento de tendências de adaptação e confirmação múltipla
- Estratégias de otimização de negociação diurna combinadas com o indicador de momentum RSI do sistema dinâmico equilíbrio
- Múltiplos indicadores tecnológicos estratégias de rastreamento de tendências de movimento
- A tendência da EMA combinada com a rotação de reversão da estratégia de negociação
- Estratégias de negociação quantitativas de parâmetros dinâmicos RSI auxiliados por cruzamento multilinear
- Tendências dinâmicas determinam a estratégia de cruzamento do RSI
- Estratégias de rastreamento de duplo cruzamento de tendências: sistema de negociação homogêneo do índice com o MACD
- Múlti-indicadores, tendências multidimensionais e estratégias de quantificação avançadas
- Múltiplas estratégias de negociação quantitativas de rastreamento de tendências de cruzamento dinâmico e de confirmação múltipla
Mais informações
- Modelo de alertas de lançamento lunar [indicador]
- HALFTREND + HEMA + SMA (estratégia de sinal falso)
- RSI Divergência com Pivot, BB, SMA, EMA, SMMA, WMA, VWMA
- RSI e BB e simultaneamente OverSold
- Velas de Heikin Ashi
- Combinação 2/20 EMA e Filtro de banda
- A ESSMA
- 3EMA
- Blocos de ordens pivotantes
- NMVOB-S
- Banda MAHL
- 3 Supertrend adicionar neste único script
- Indicador de alta/baixa oscilante com confirmações do MACD e do EMA
- EMA tripla + MACD
- A jogar a cruz
- Fractals menores (+ Transparência)
- Pontos de entrada BB-RSI-ADX
- Hull-4ema
- Indicador de linha de ataque do ângulo
- Linha KijunSen com Cruz