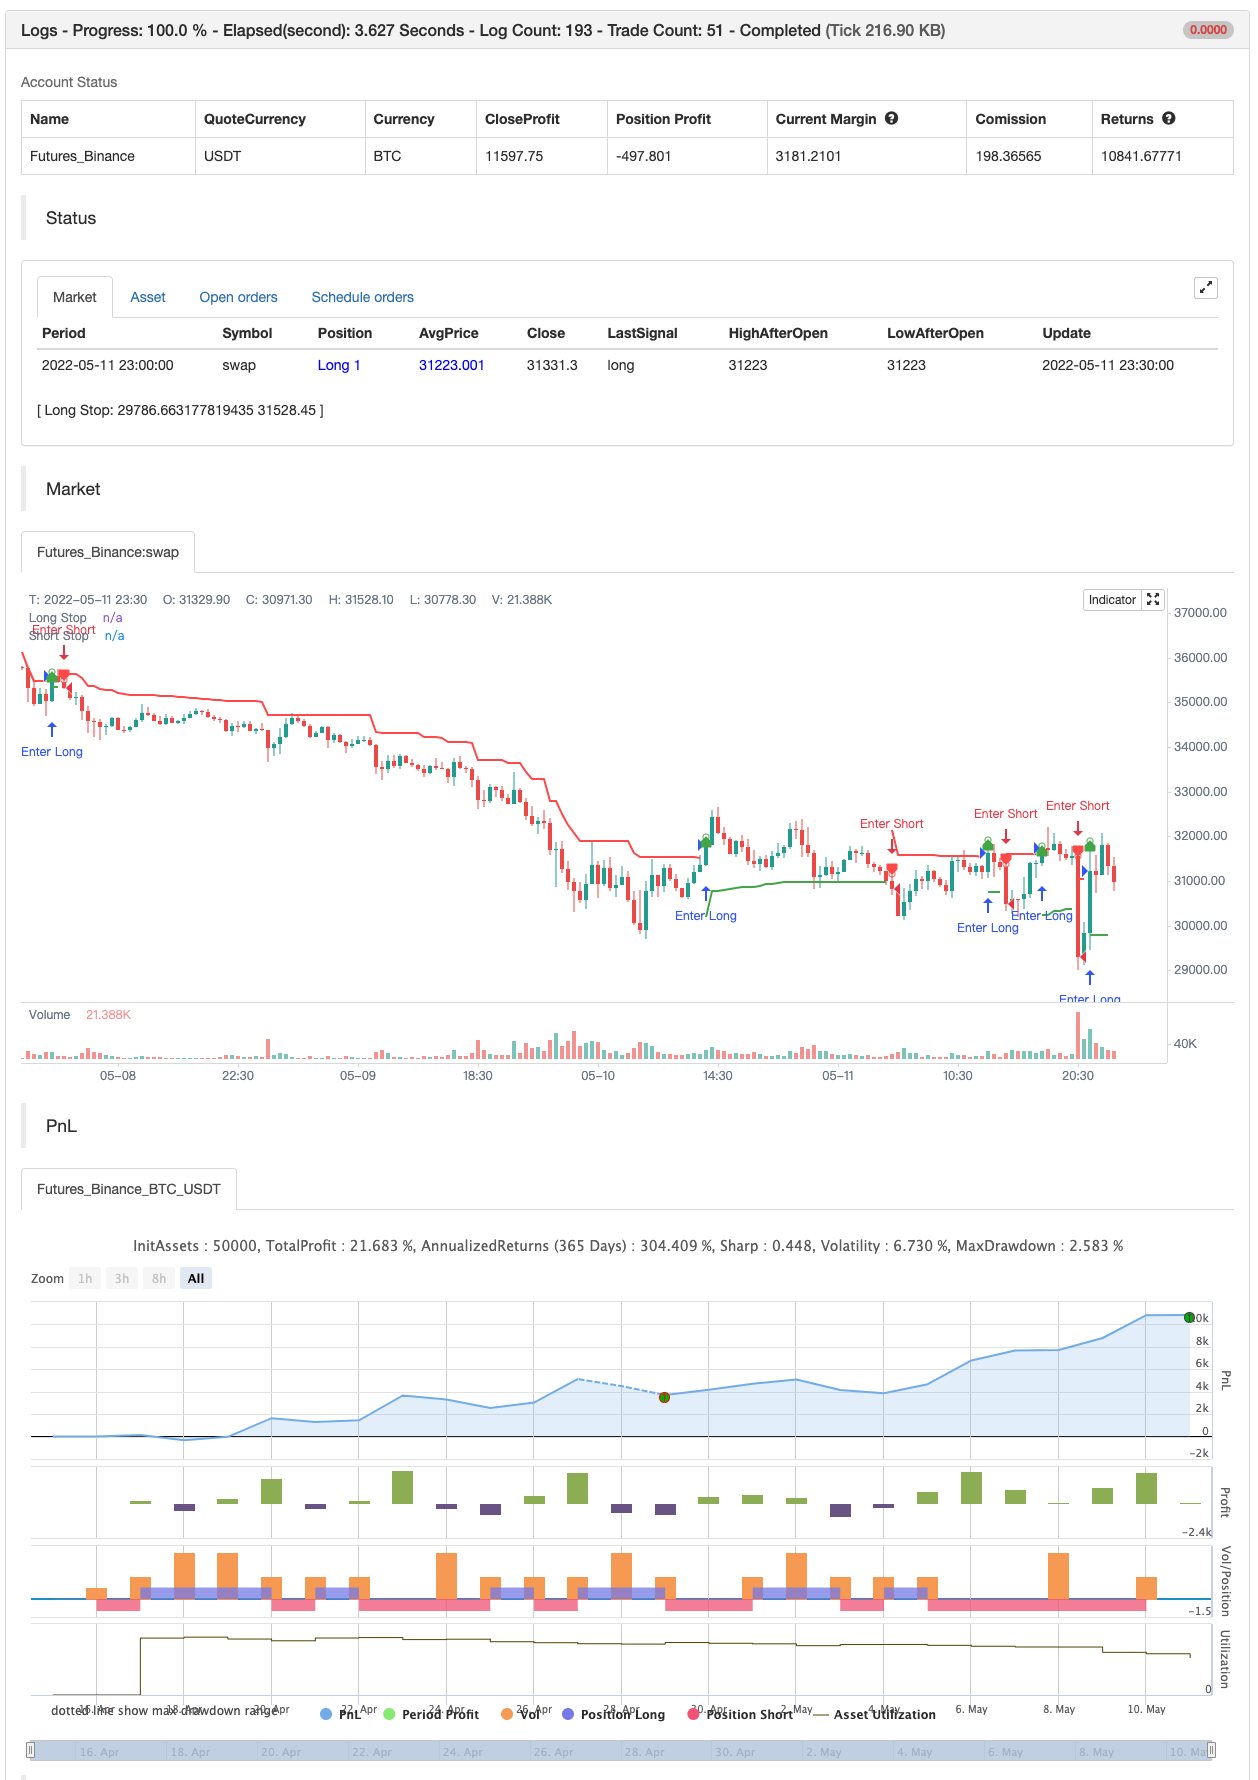
Saída do candelabro
Autora:ChaoZhang, Data: 2022-05-17 17:10:19Tags:ATR
Este é um redesenho do indicador Chandelier Exit. Ele remove transições estúpidas entre os estados Chandelier Exit
Este indicador foi originalmente desenvolvido por Charles Le Beau e popularizado pelo Dr. Alexander Elder no seu livro
Em resumo, trata-se de um stop-loss final baseado no Average True Range (ATR).
backtest

/*backtest
start: 2022-04-16 00:00:00
end: 2022-05-11 23:59:00
period: 30m
basePeriod: 15m
exchanges: [{"eid":"Futures_Binance","currency":"BTC_USDT"}]
*/

//@version=4
// Copyright (c) 2019-present, Alex Orekhov (everget)
// Chandelier Exit script may be freely distributed under the terms of the GPL-3.0 license.
study("Chandelier Exit", shorttitle="CE", overlay=true)

length = input(title="ATR Period", type=input.integer, defval=22)
mult = input(title="ATR Multiplier", type=input.float, step=0.1, defval=3.0)
showLabels = input(title="Show Buy/Sell Labels ?", type=input.bool, defval=true)
useClose = input(title="Use Close Price for Extremums ?", type=input.bool, defval=true)
highlightState = input(title="Highlight State ?", type=input.bool, defval=true)

atr = mult * atr(length)

longStop = (useClose ? highest(close, length) : highest(length)) - atr
longStopPrev = nz(longStop[1], longStop)
longStop := close[1] > longStopPrev ? max(longStop, longStopPrev) : longStop

shortStop = (useClose ? lowest(close, length) : lowest(length)) + atr
shortStopPrev = nz(shortStop[1], shortStop)
shortStop := close[1] < shortStopPrev ? min(shortStop, shortStopPrev) : shortStop

var int dir = 1
dir := close > shortStopPrev ? 1 : close < longStopPrev ? -1 : dir

var color longColor = color.green
var color shortColor = color.red

longStopPlot = plot(dir == 1 ? longStop : na, title="Long Stop", style=plot.style_linebr, linewidth=2, color=longColor)
buySignal = dir == 1 and dir[1] == -1
plotshape(buySignal ? longStop : na, title="Long Stop Start", location=location.absolute, style=shape.circle, size=size.tiny, color=longColor, transp=0)
plotshape(buySignal and showLabels ? longStop : na, title="Buy Label", text="Buy", location=location.absolute, style=shape.labelup, size=size.tiny, color=longColor, textcolor=color.white, transp=0)

shortStopPlot = plot(dir == 1 ? na : shortStop, title="Short Stop", style=plot.style_linebr, linewidth=2, color=shortColor)
sellSignal = dir == -1 and dir[1] == 1
plotshape(sellSignal ? shortStop : na, title="Short Stop Start", location=location.absolute, style=shape.circle, size=size.tiny, color=shortColor, transp=0)
plotshape(sellSignal and showLabels ? shortStop : na, title="Sell Label", text="Sell", location=location.absolute, style=shape.labeldown, size=size.tiny, color=shortColor, textcolor=color.white, transp=0)

midPricePlot = plot(ohlc4, title="", style=plot.style_circles, linewidth=0, display=display.none, editable=false)

longFillColor = highlightState ? (dir == 1 ? longColor : na) : na
shortFillColor = highlightState ? (dir == -1 ? shortColor : na) : na
fill(midPricePlot, longStopPlot, title="Long State Filling", color=longFillColor)
fill(midPricePlot, shortStopPlot, title="Short State Filling", color=shortFillColor)

changeCond = dir != dir[1]
alertcondition(changeCond, title="Alert: CE Direction Change", message="Chandelier Exit has changed direction!")
alertcondition(buySignal, title="Alert: CE Buy", message="Chandelier Exit Buy!")
alertcondition(sellSignal, title="Alert: CE Sell", message="Chandelier Exit Sell!")


if buySignal
    strategy.entry("Enter Long", strategy.long)
else if sellSignal
    strategy.entry("Enter Short", strategy.short)
Relacionado
- Sistema de estratégia de quantificação de tendências de potência de dois indicadores
- Julgamento de tendências multidimensionais e estratégias de stop loss dinâmicas do ATR
- Tendências de negociação confirmadas por múltiplos indicadores avançados
- Estratégias inteligentes de rastreamento de stop loss baseadas em médias móveis e padrões diários
- Sistema de negociação quantitativa com regressão de múltiplos fatores e estratégias de faixa de preços dinâmicos
- Múltiplas estratégias de negociação quantitativas de rastreamento de tendências de cruzamento dinâmico e de confirmação múltipla
- Estratégias de rastreamento dinâmico de stop loss avançadas baseadas em desvios do RSI de uma linha de curva de grande escala
- Método de negociação de conversão quantitativa da tendência de sincronização de múltiplos indicadores
- Múltiplos canais dinâmicos de apoio resistem à estratégia de canais de Kenny
- A aprendizagem automática adapta-se a estratégias de negociação de super-tendências quantitativas
- Estratégias de negociação de rastreamento de tendências de linha média baseadas em paralisação de volatilidade
Mais informações
- Instrumento de recuperação de scalping R1
- A estratégia de compra e venda depende de AO+Stoch+RSI+ATR
- EMA TREND CLOUD
- RedK Relação volume-aceleração da energia direcional
- Donchian Breakout sem pintura
- Barras de Momento RedK
- SuperJump Volta para trás Banda de Bollinger
- Tendência Fukuiz
- O BOT do Johnny.
- SSL híbrido
- RISOTTO
- Estratégia intradiária de nuvem da EMA
- Supertendência do ponto pivô
- Supertrend+4 movendo
- ZigZag baseado em momento
- VuManChu Cipher B + Divergências Estratégia
- Conceito Dual SuperTrend
- Super Scalper
- Testes de regresso - Indicador
- Trendelicious