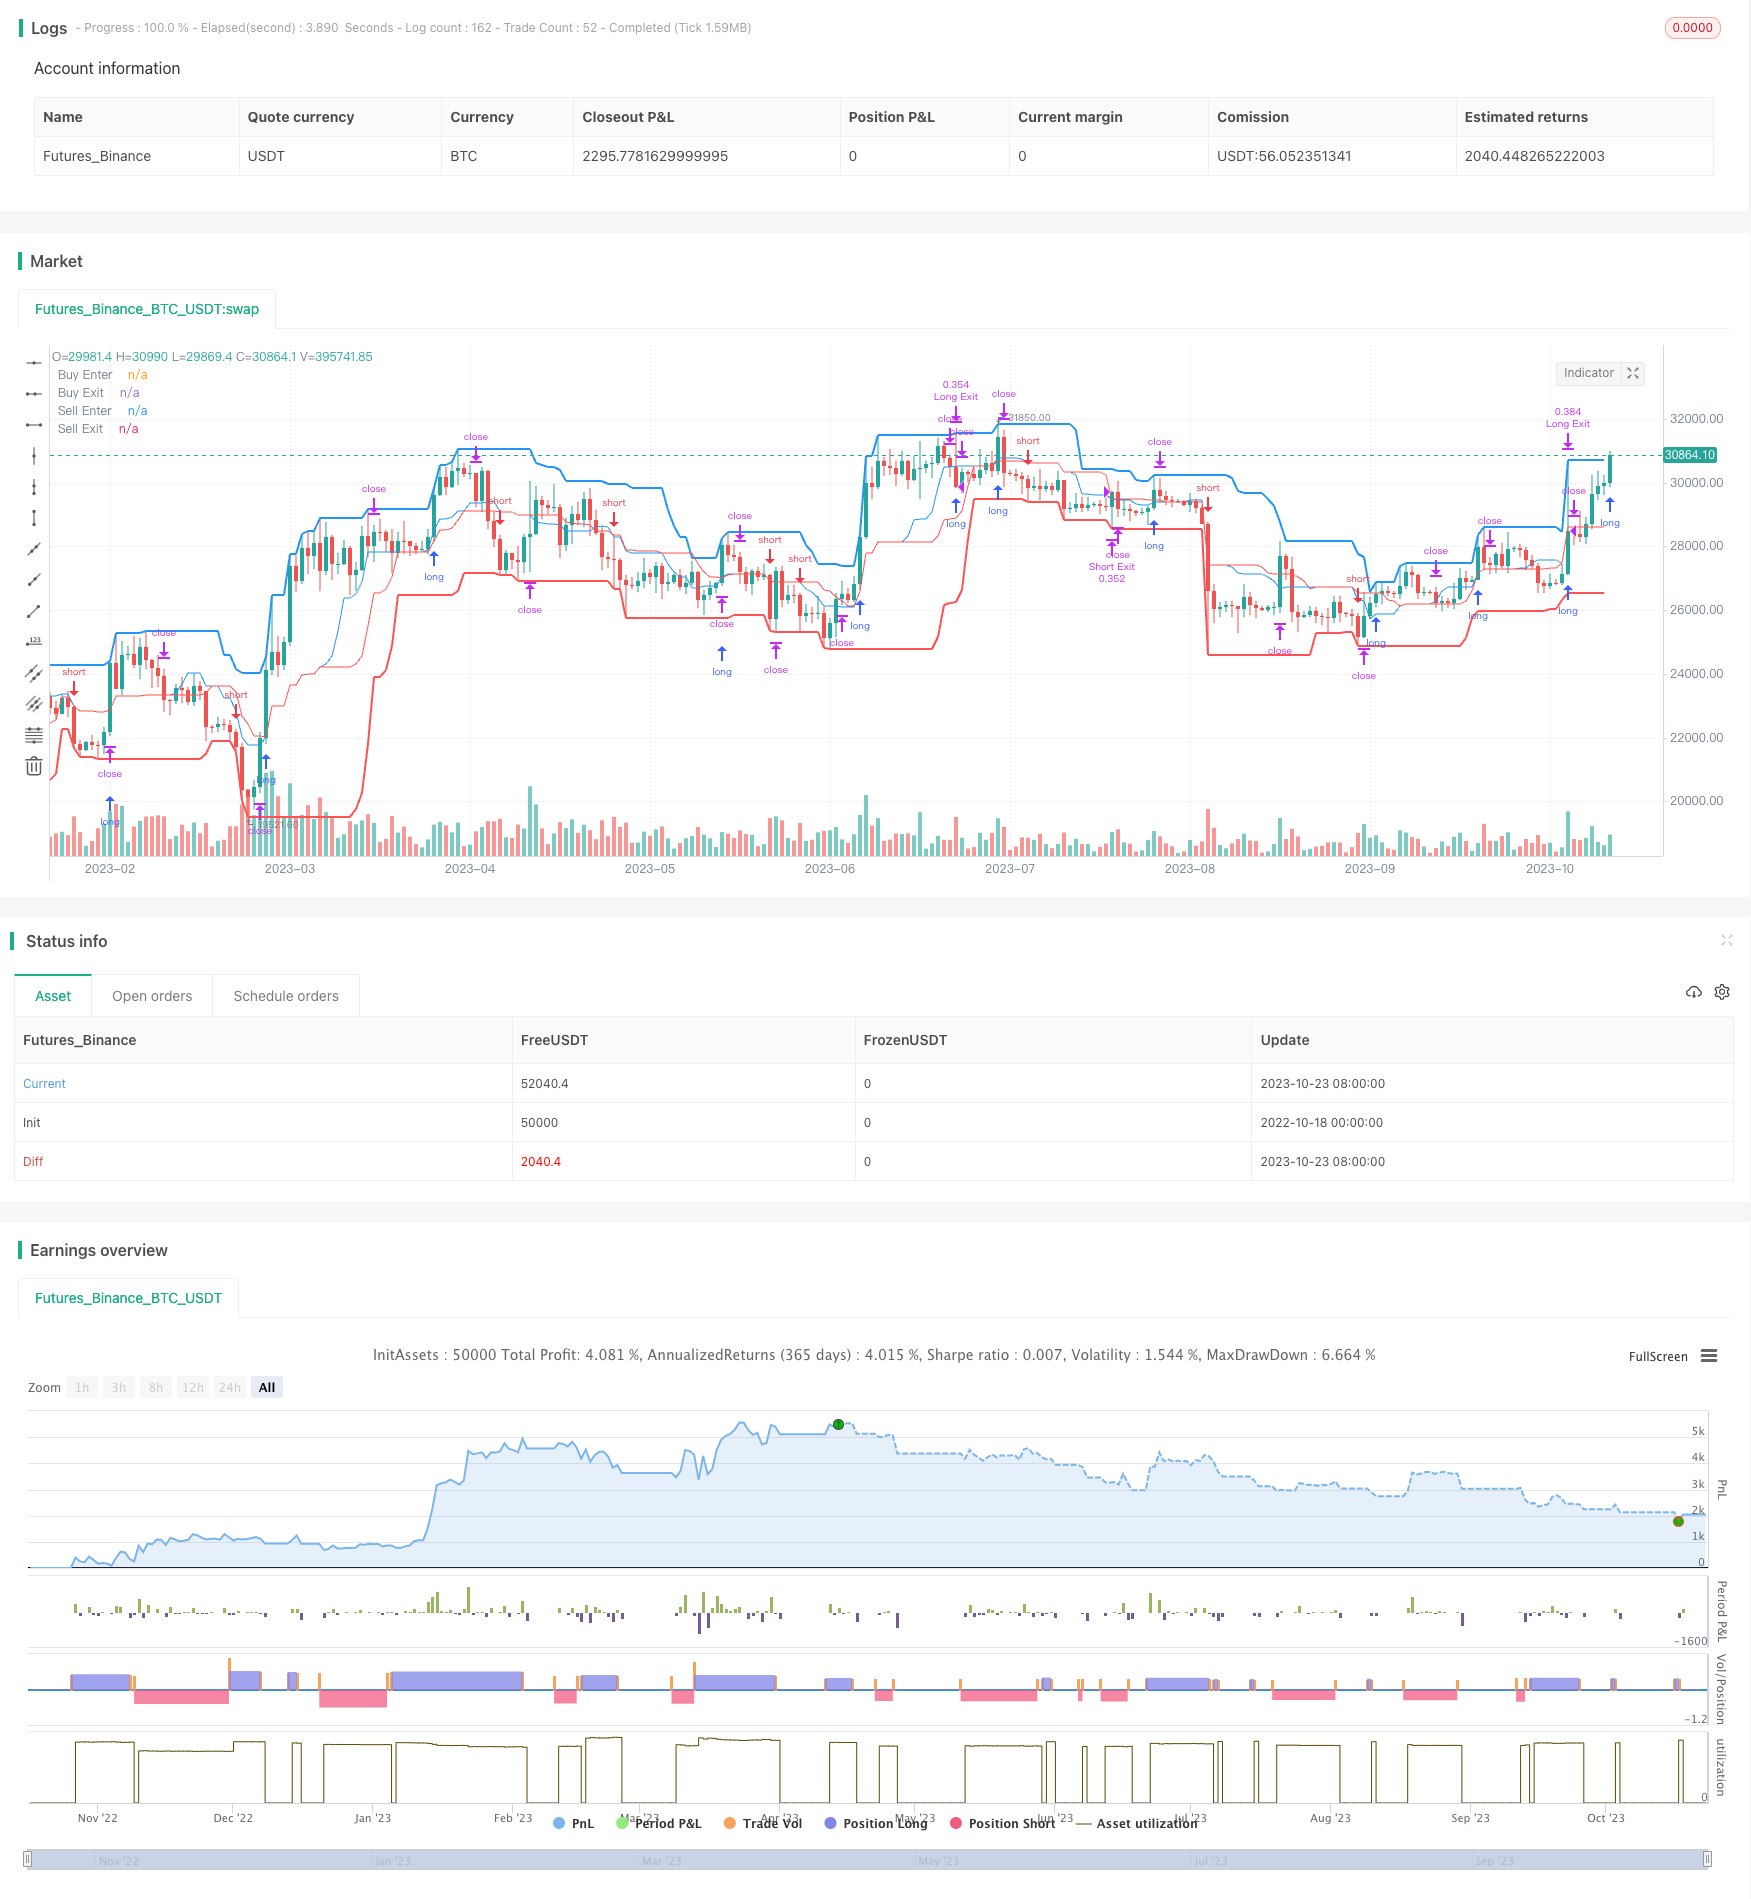
estratégia de negociação a curto prazo
Autora:ChaoZhang, Data: 2023-10-25 14:40:21Tags:

Resumo
Esta é uma estratégia de negociação de curto prazo baseada em breakouts de canal. Ele usa as breakouts do canal superior e inferior para determinar o início e o fim das tendências, e tomar decisões de negociação em conformidade.
Estratégia lógica
-
A estratégia calcula, em primeiro lugar, a maior e a menor altitude durante um determinado período para construir o trilho superior e inferior do canal.
-
Se o preço ultrapassar a linha superior, vá longo. Se o preço ultrapassar a linha inferior, vá curto.
-
Usar um stop loss móvel para controlar os riscos.
-
Existem duas regras de saída opcionais: voltar para a linha do meio ou seguir o stop loss em movimento.
-
O período do canal e outros parâmetros podem ser ajustados para otimizar a estratégia para diferentes condições de mercado.
Análise das vantagens
-
Simples de implementar, basta monitorizar a relação preço-canal e seguir as regras para negociar.
-
Negociar ao longo da tendência, sem riscos de contra-tendência.
-
Um canal claro e intuitivo dá sinais de entrada explícitos.
-
Uma boa margem de lucro, pode alcançar retornos satisfatórios na maioria dos casos.
-
Muitos parâmetros ajustáveis para otimização em diferentes mercados.
Análise de riscos
-
A fuga pode falhar, existem riscos de ficarmos presos.
-
O canal precisa de um período de formação, não adequado para mercados de gama limitada.
-
A reversão para o stop loss médio pode ser demasiado conservadora, incapaz de manter as tendências.
-
A otimização de parâmetros requer dados históricos, sobreajuste possível na negociação ao vivo.
-
A negociação mecânica de pontos de ruptura pode aumentar a frequência de negociação e os custos de deslizamento.
Orientações de otimização
-
Avalie os canais de diferentes períodos e selecione o mais adequado.
-
Teste a reversão para o meio e a movimentação de stop loss para encontrar um melhor mecanismo de saída.
-
Otimizar a percentagem de stop loss para reduzir as hipóteses de ser parado.
-
Adicionar um filtro de tendência para evitar operações de ruptura inadequadas.
-
Considere aumentar o tamanho da posição mas controlar os riscos.
Resumo
No geral, esta é uma estratégia de breakout madura de curto prazo. Tem regras de entrada claras, controle de risco adequado e funciona bem em geral. Uma melhoria adicional pode ser alcançada através do ajuste de parâmetros. Mas devem ser notadas limitações inerentes, ajustes necessários para diferentes mercados. Se usado sistematicamente, deve gerar lucros globais consistentes.
/*backtest
start: 2022-10-18 00:00:00
end: 2023-10-24 00:00:00
period: 1d
basePeriod: 1h
exchanges: [{"eid":"Futures_Binance","currency":"BTC_USDT"}]
*/

// This source code is subject to the terms of the Mozilla Public License 2.0 at https://mozilla.org/MPL/2.0/
// Strategy testing and optimisation for free Bitmex trading bot
// © algotradingcc

//@version=4
strategy("Channel Break [for free bot]", overlay=true, default_qty_type= strategy.percent_of_equity, initial_capital = 1000, default_qty_value = 20, commission_type=strategy.commission.percent, commission_value=0.075)

//Options
buyPeriod = input(13, "Channel Period for Long position")
sellPeriod = input(18, "Channel Period for Short position")
isMiddleExit = input(true, "Is exit on Base Line?")
takeProfit = input(46, "Take Profit (%) for position")
stopLoss = input(9, "Stop Loss (%) for position")

// Test Start
startYear = input(2005, "Test Start Year")
startMonth = input(1, "Test Start Month")
startDay = input(1, "Test Start Day")
startTest = timestamp(startYear,startMonth,startDay,0,0)

//Test End
endYear = input(2050, "Test End Year")
endMonth = input(12, "Test End Month")
endDay = input(30, "Test End Day")
endTest = timestamp(endYear,endMonth,endDay,23,59)

timeRange = time > startTest and time < endTest ? true : false

// Long&Short Levels
BuyEnter = highest(buyPeriod)
BuyExit = isMiddleExit ? (highest(buyPeriod) + lowest(buyPeriod)) / 2: lowest(buyPeriod)

SellEnter = lowest(sellPeriod)
SellExit = isMiddleExit ? (highest(sellPeriod) + lowest(sellPeriod)) / 2: highest(sellPeriod)

// Plot Data
plot(BuyEnter, style=plot.style_line, linewidth=2, color=color.blue, title="Buy Enter")
plot(BuyExit, style=plot.style_line, linewidth=1, color=color.blue, title="Buy Exit", transp=50)
plot(SellEnter, style=plot.style_line, linewidth=2, color=color.red, title="Sell Enter")
plot(SellExit, style=plot.style_line, linewidth=1, color=color.red, title="Sell Exit", transp=50)

// Calc Take Profits & Stop Loss
TP = 0.0
SL = 0.0
if strategy.position_size > 0
    TP := strategy.position_avg_price*(1 + takeProfit/100)
    SL := strategy.position_avg_price*(1 - stopLoss/100)

if strategy.position_size > 0 and SL > BuyExit
    BuyExit := SL

if strategy.position_size < 0
    TP := strategy.position_avg_price*(1 - takeProfit/100)
    SL := strategy.position_avg_price*(1 + stopLoss/100)

if strategy.position_size < 0 and SL < SellExit
    SellExit := SL


// Long Position
if timeRange and strategy.position_size <= 0
    strategy.entry("Long", strategy.long, stop = BuyEnter)
strategy.exit("Long Exit", "Long", stop=BuyExit, limit = TP, when = strategy.position_size > 0)


// Short Position
if timeRange and strategy.position_size >= 0
    strategy.entry("Short", strategy.short, stop = SellEnter)

strategy.exit("Short Exit", "Short", stop=SellExit, limit = TP, when = strategy.position_size < 0)

// Close & Cancel when over End of the Test
if time > endTest
    strategy.close_all()
    strategy.cancel_all()
- Estratégia de negociação de ruptura de acumulação gradual
- Estratégia dinâmica de direção das velas
- RSI Divergência Estratégia de negociação
- Estratégia de tendência de curto prazo baseada em decisões com múltiplos indicadores
- Estratégia de mapa de calor MACD multi-tempo
- Estratégia de cruzamento de média móvel dupla
- ATR Adjustable Trailing Stop Loss Strategy
- Estratégia de filtro de tendência de média móvel dupla
- Estratégia de stop loss para o seguimento do gradiente
- Bollinger Bands e estratégia dos indicadores RSI
- Tendência da Linha de Balanço de Ichimoku após a Estratégia
- Estratégia de ruptura do duplo spread da EMA
- Contrarian Breakout Trading Strategy (Estratégia de negociação de ruptura contrária)
- Williams VIX Fix Estratégia
- RSI Linha de oscilação de trilho duplo Estratégia de negociação bidirecional longa e curta
- Estratégia de rotação de impulso multifator
- RSI Estratégia de cruzamento da EMA
- Tendência na sequência da estratégia de média móvel dupla
- Estratégia de fuga do Glory Hole
- Heiken Ashi Moving Average Crossover Strategy com o MACD Filter V3