Estratégia de ruptura de bandas de Bollinger duplas
Autora:ChaoZhang, Data: 2023-12-13 17:33:24Tags:

Resumo
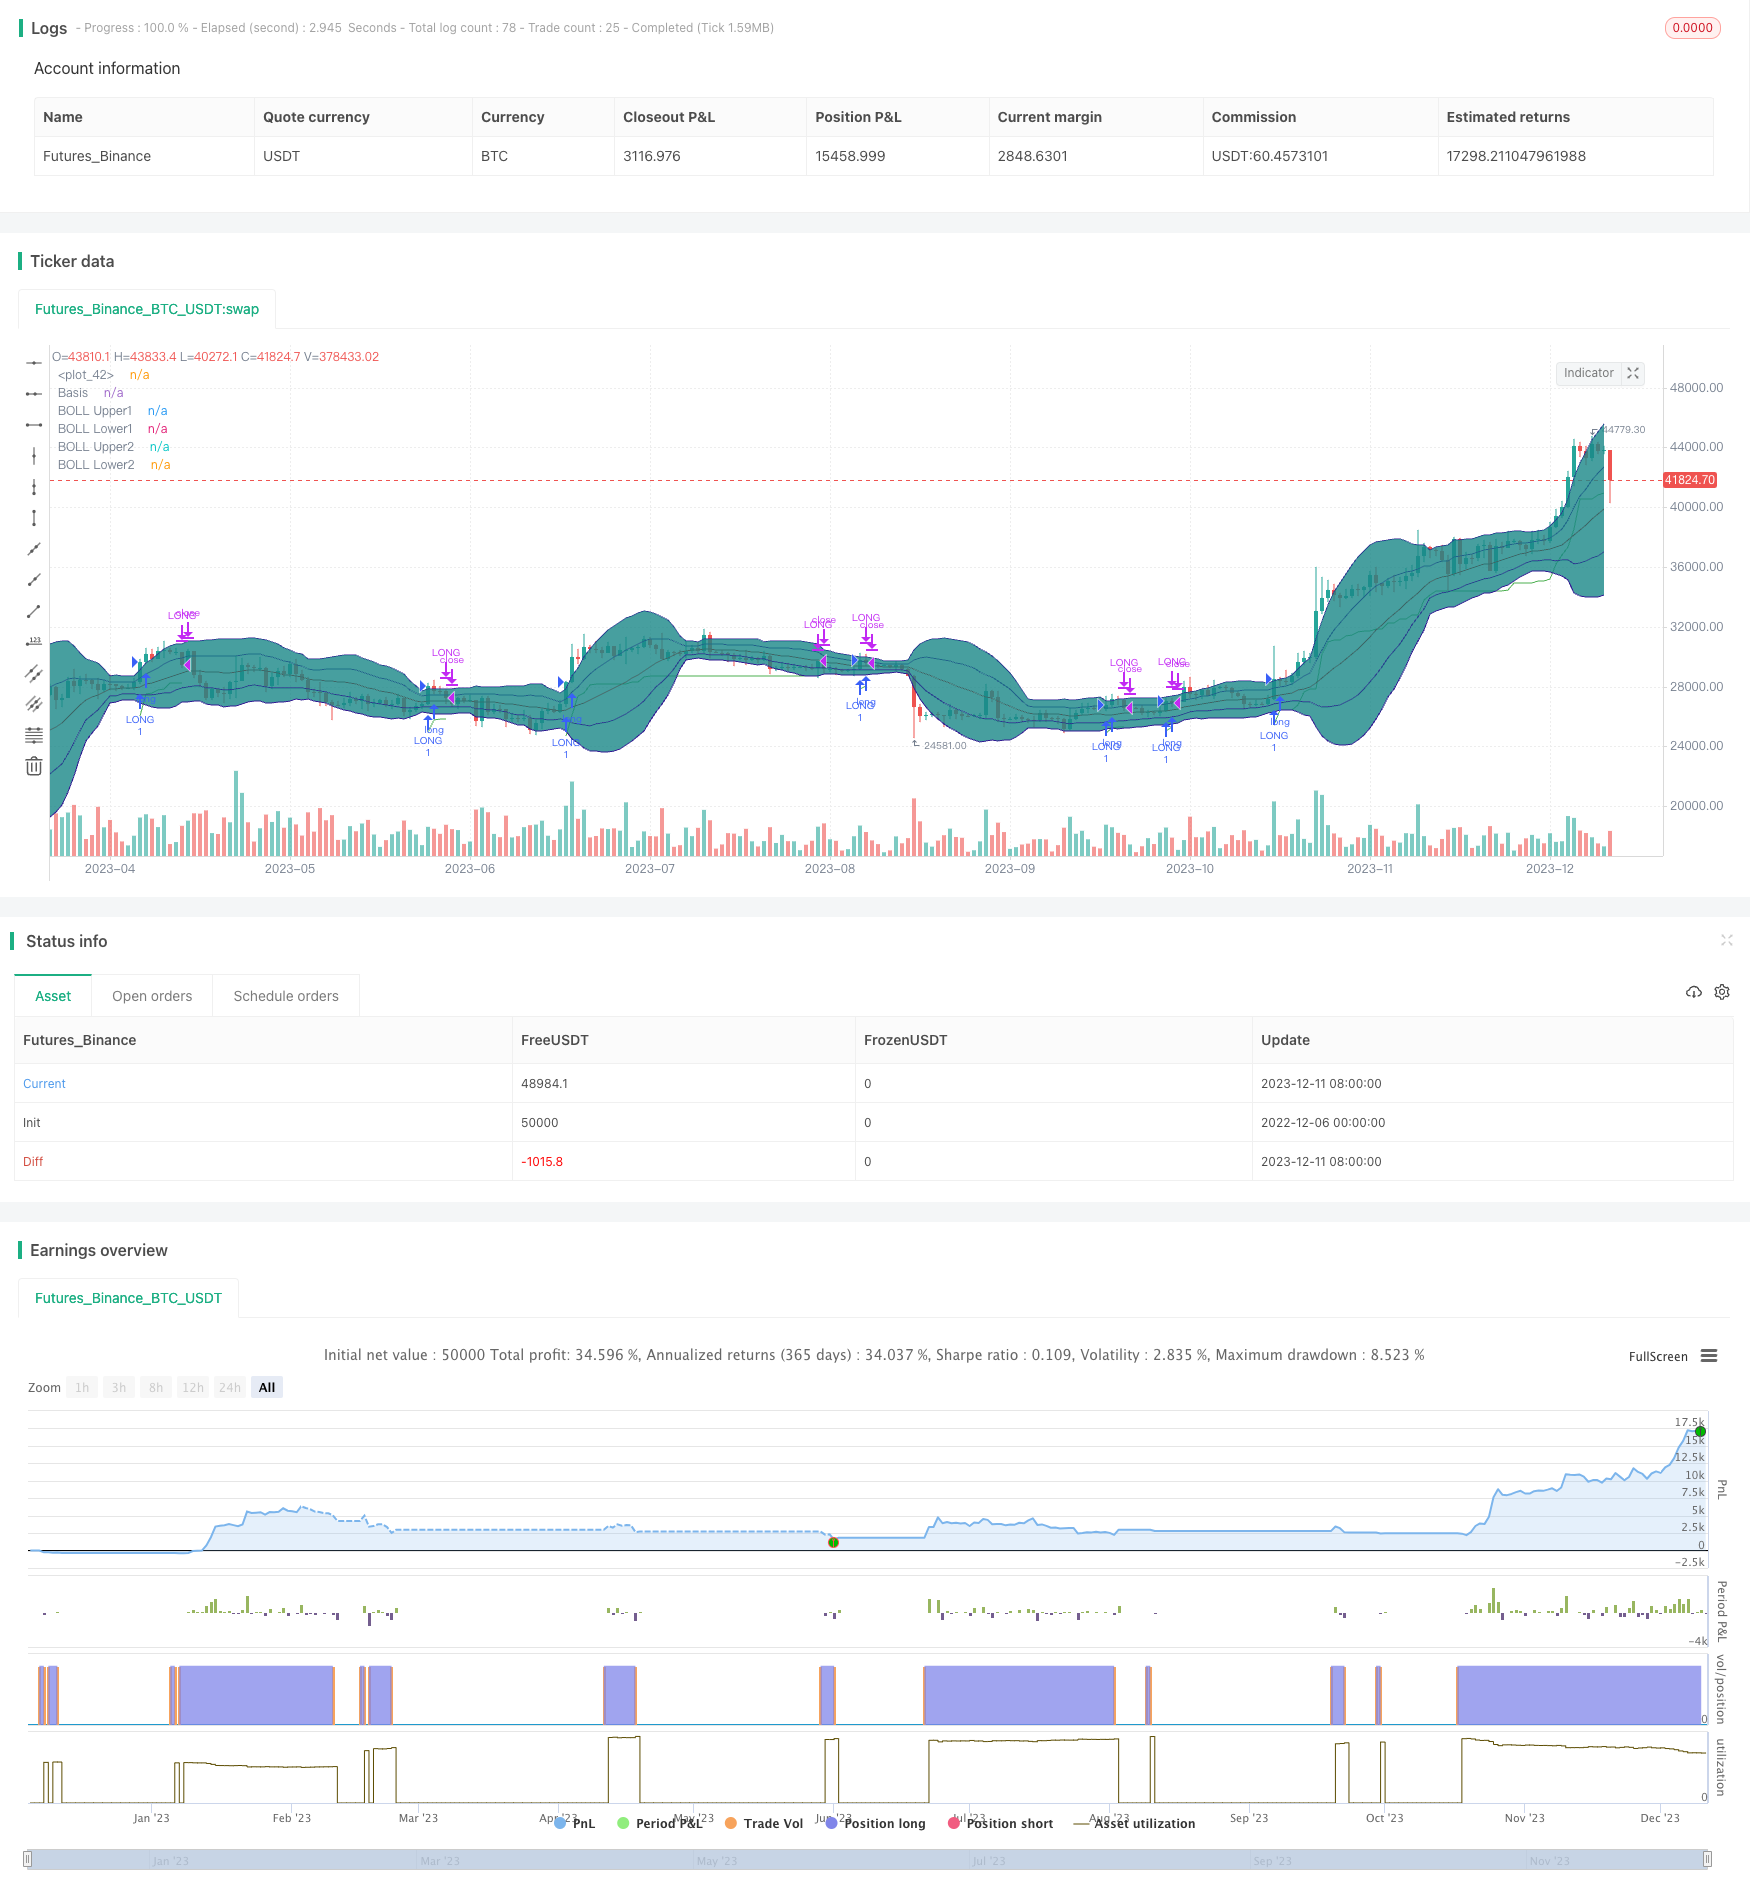
Esta estratégia usa bandas de Bollinger duplas para identificar zonas de consolidação e sinais de ruptura para implementar uma estratégia de negociação de baixa compra-alta venda.
Estratégia lógica
A estratégia emprega duas Bandas de Bollinger. O BB interno tem bandas superior/inferior de 20SMA ± 1 desvio padrão. O BB externo tem bandas superior/inferior de 20SMA ± 2 desvios padrão. A área entre os dois BBs é definida como a zona neutra.
Quando o preço permanece dentro da zona neutra por duas velas consecutivas, é considerado consolidação.
Após entrar em longo, o stop loss é definido no preço mais baixo - 2xATR para bloquear o lucro e controlar o risco.
Análise das vantagens
Esta estratégia combina indicadores e tendência para identificar zonas de consolidação e determinar o início da tendência, permitindo uma negociação de baixa compra-alta venda com grande potencial de lucro.
Análise de riscos
A estratégia baseia-se em sinais de breakout que podem revelar-se ser falsos breakouts, resultando em perdas de negócios.
As soluções incluem a otimização dos parâmetros do BB, a adição de filtros para reduzir sinais falsos e permitir paradas mais largas.
Orientações de otimização
- Otimizar os parâmetros do BB para reduzir falhas
- Adicionar outros filtros, por exemplo, volume para evitar falhas de baixo volume
- Ajustar a estratégia de stop loss para evitar interrupções e paradas precoces
- Escala das posições para reduzir os riscos do comércio único
Conclusão
Esta estratégia integra BBs duplos e estratégias de tendência para negociação de baixa compra-alta venda com grande potencial de lucro.
/*backtest
start: 2022-12-06 00:00:00
end: 2023-12-12 00:00:00
period: 1d
basePeriod: 1h
exchanges: [{"eid":"Futures_Binance","currency":"BTC_USDT"}]
*/

// This source code is subject to the terms of the Mozilla Public License 2.0 at https://mozilla.org/MPL/2.0/
// © DojiEmoji

//@version=4
strategy("[KL] Double BB Strategy",overlay=true,pyramiding=1)
ENUM_LONG = "LONG"

// Timeframe {
backtest_timeframe_start = input(defval = timestamp("01 Apr 2020 13:30 +0000"), title = "Backtest Start Time", type = input.time)
USE_ENDTIME = input(false,title="Define backtest end-time (If false, will test up to most recent candle)")
backtest_timeframe_end = input(defval = timestamp("19 Apr 2021 19:30 +0000"), title = "Backtest End Time (if checked above)", type = input.time)
within_timeframe = true
// }

// Bollinger bands
BOLL_length = 20, BOLL_src = close, SMA20 = sma(BOLL_src, BOLL_length)
BOLL_sDEV = stdev(BOLL_src, BOLL_length)
BOLL_upper1 = SMA20 + BOLL_sDEV, BOLL_lower1 = SMA20 - BOLL_sDEV
BOLL_upper2 = SMA20 + BOLL_sDEV*2, BOLL_lower2 = SMA20 - BOLL_sDEV*2
SMA_20_plot = plot(SMA20, "Basis", color=#872323, offset = 0)
BOLL_upper1_plot = plot(BOLL_upper1, "BOLL Upper1", color=color.navy, offset = 0, transp=50)
BOLL_lower1_plot = plot(BOLL_lower1, "BOLL Lower1", color=color.navy, offset = 0, transp=50)
BOLL_upper2_plot = plot(BOLL_upper2, "BOLL Upper2", color=color.navy, offset = 0, transp=50)
BOLL_lower2_plot = plot(BOLL_lower2, "BOLL Lower2", color=color.navy, offset = 0, transp=50)
fill(BOLL_upper2_plot, BOLL_upper1_plot, title = "Background", color=#198787, transp=85)
fill(BOLL_upper1_plot, SMA_20_plot, title = "Background", color=#198787, transp=75)
fill(SMA_20_plot, BOLL_lower1_plot, title = "Background", color=#198787, transp=75)
fill(BOLL_lower1_plot, BOLL_lower2_plot, title = "Background", color=#198787, transp=85)


// Trailing stop loss {
ATR_X2_TSL = atr(input(14,title="Length of ATR for trailing stop loss")) * input(2.0,title="ATR Multiplier for trailing stop loss",type=input.float)
TSL_source = low
var stop_loss_price = float(0)
TSL_line_color = color.green, TSL_transp = 100
if strategy.position_size == 0 or not within_timeframe
    TSL_line_color := color.black
    stop_loss_price := TSL_source - ATR_X2_TSL
else if strategy.position_size > 0
    stop_loss_price := max(stop_loss_price, TSL_source - ATR_X2_TSL)
    TSL_transp := 0
plot(stop_loss_price, color=color.new(TSL_line_color, TSL_transp))
// }

// Signals for entry
is_neutral = close < BOLL_upper1 and close > BOLL_lower2
is_consol = is_neutral and is_neutral[2]
entry_signal = is_consol[1] and close > BOLL_upper1


// MAIN:
if within_timeframe
    // EXIT ::::::::::::::::::::::::::::::::::::::::::::::::::::::::::::::::::::
	exit_msg = close <= strategy.position_avg_price ? "stop loss" : "take profit"
	end_of_rally = close < BOLL_upper1 and strategy.position_avg_price > stop_loss_price	// also detects false breakouts
	if strategy.position_size > 0 and (TSL_source <= stop_loss_price or end_of_rally)
        strategy.close(ENUM_LONG, comment=exit_msg)

    // ENTRY :::::::::::::::::::::::::::::::::::::::::::::::::::::::::::::::::::
    if (strategy.position_size == 0 or (strategy.position_size > 0 and close > stop_loss_price)) and entry_signal
		entry_msg = strategy.position_size > 0 ? "adding" : "initial"
		strategy.entry(ENUM_LONG, strategy.long, comment=entry_msg)

// CLEAN UP:
if strategy.position_size == 0
	stop_loss_price := float(0)
- Estratégia de candelabro de inversão de pivô
- Valeria 181 Robô Estratégia Melhorada 2.4
- Estratégia de RSI estocástico para negociação de criptomoedas
- Estratégia de acompanhamento da tendência de reversão dupla
- Divergência de convergência da média móvel ponderada por volume
- Estratégia combinada de reversão baseada no fator de reversão estocástico e no sinal chave de reversão
- RSI e tendência cruzada da média móvel
- Heiken Ashi Crossover Estratégia
- Estratégia WAMI
- Estratégia do ponto médio de cruzamento da média móvel
- Estratégia de negociação bidirecional baseada em sinais de alta e baixa dos indicadores quantitativos
- Estratégia de rastreamento da tendência da média móvel adaptativa de Kaufman
- Estratégia de previsão do caminho futuro da MacD
- Estratégia quantitativa baseada na reversão e na força relativa comparativa
- Estratégia de rastreamento de tendências da grade de Bollinger Fibonacci
- Estratégia de ruptura do impulso
- Crossover MACD com estratégia de sinal
- Estratégia de inversão da tendência do padrão dinâmico
- Supertrend Blind Seguindo Estratégia
- Estratégia de negociação quantitativa composta baseada no MACD