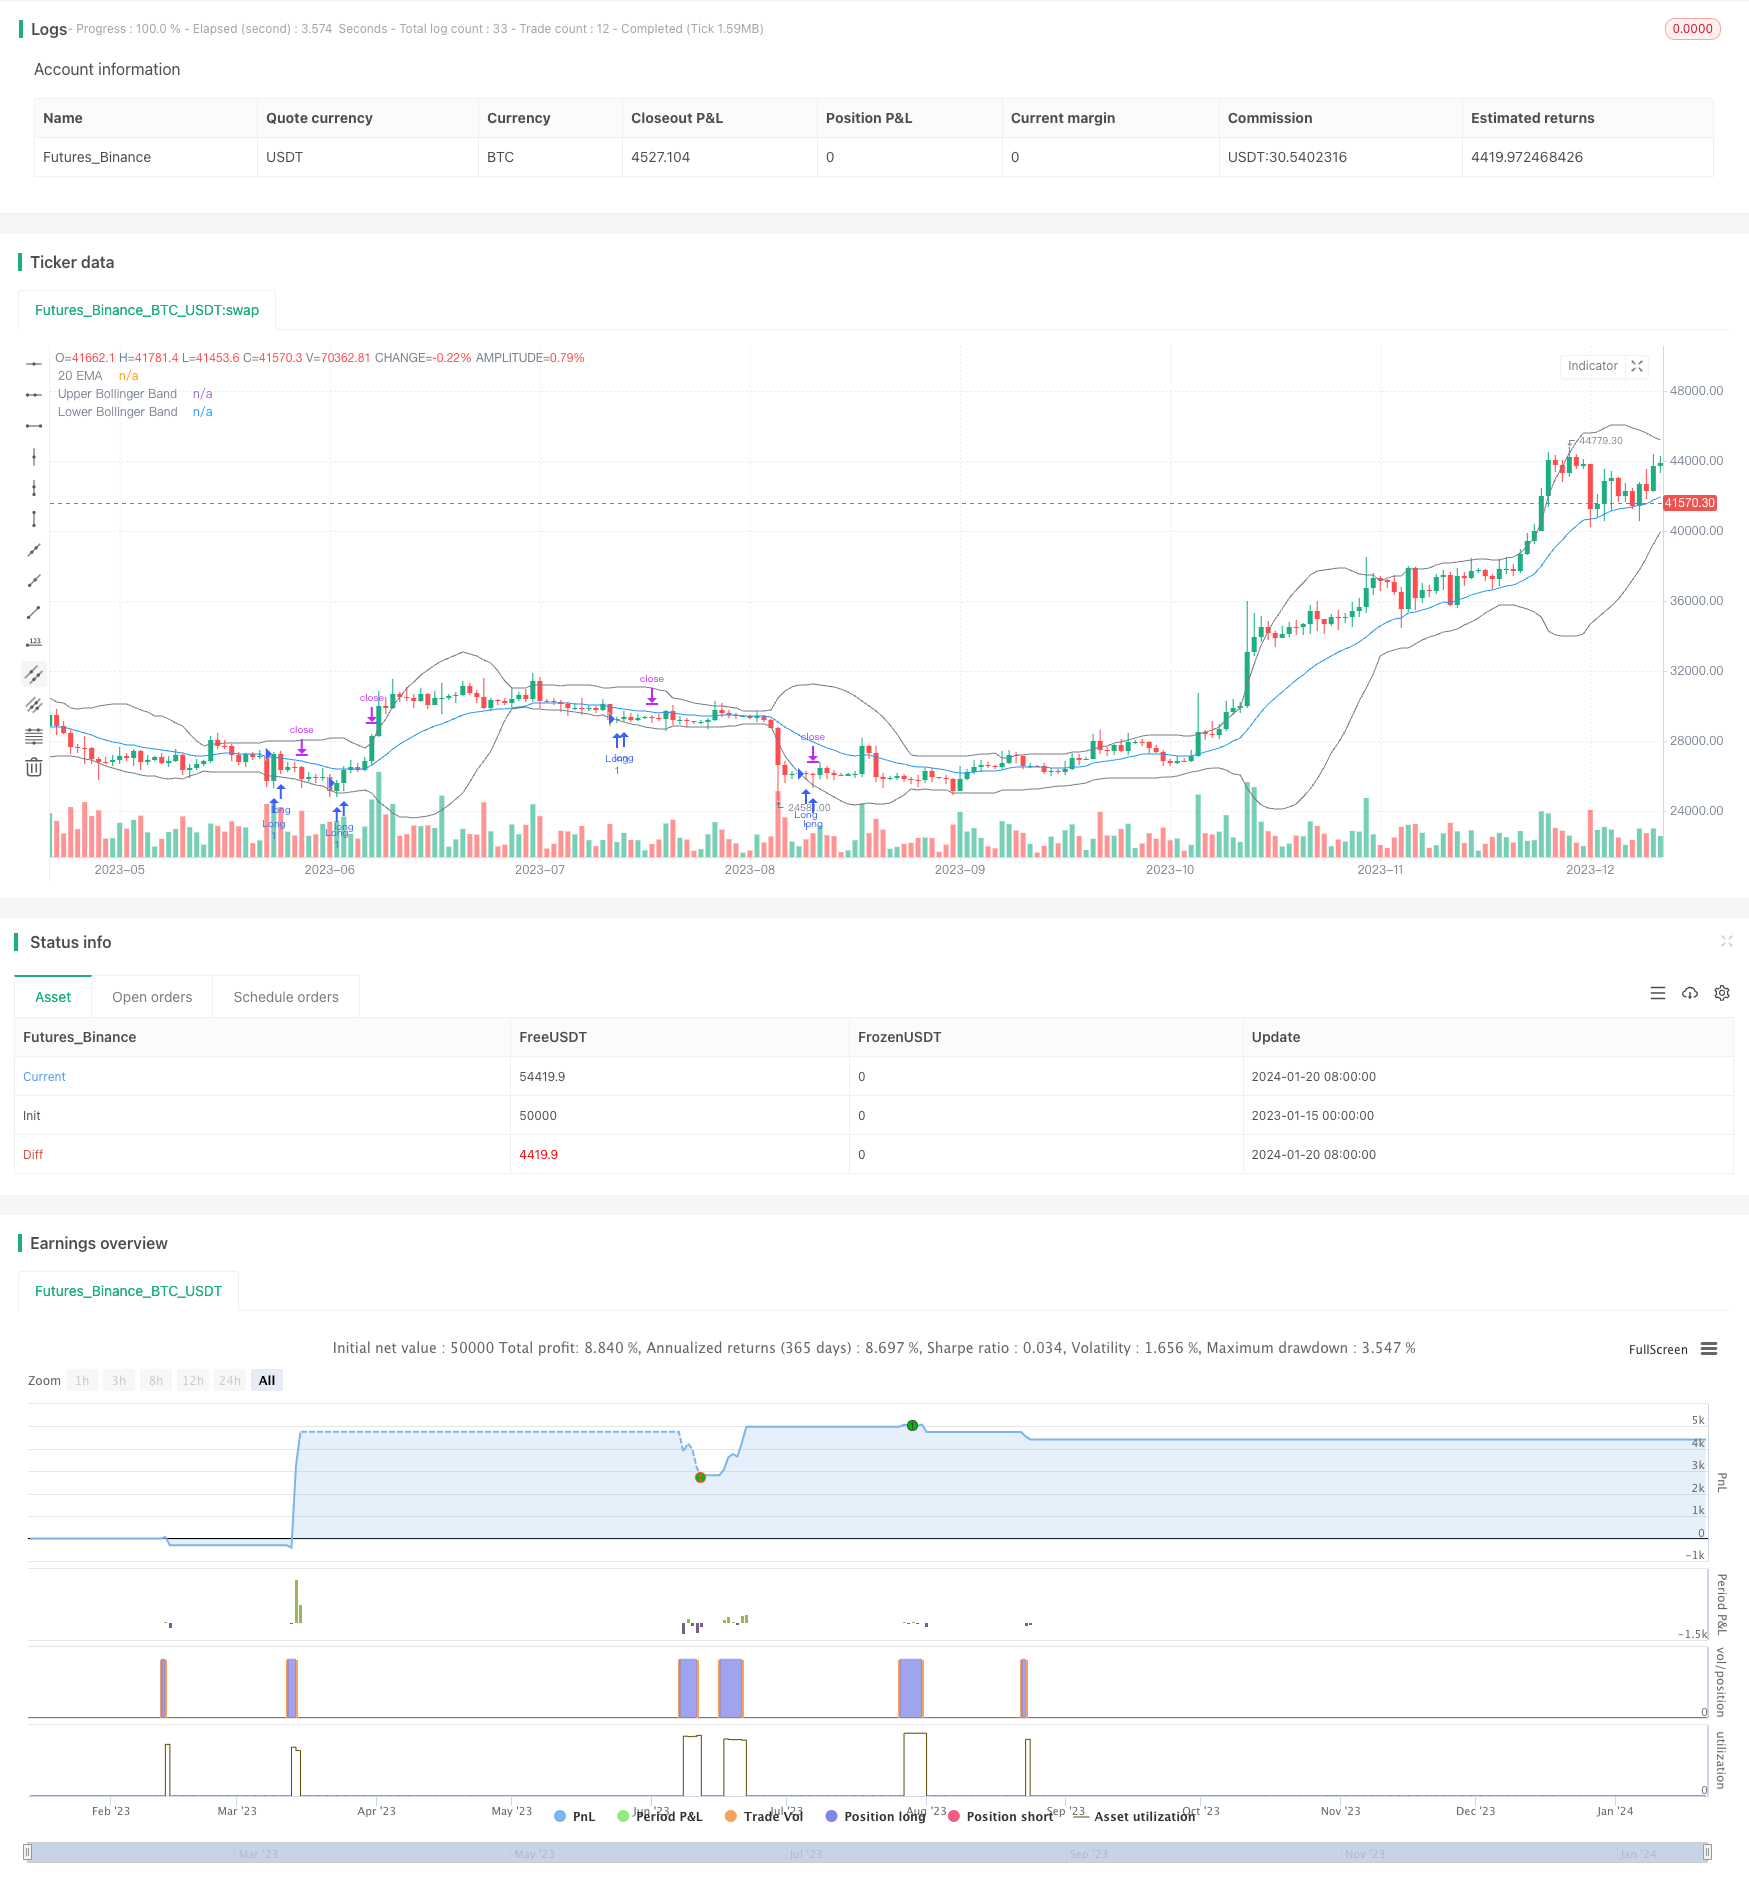
Estratégia de reversão da média de ruptura do canal das bandas de Bollinger
Autora:ChaoZhang, Data: 2024-01-22 10:47:45Tags:

Resumo
Esta é uma estratégia de breakout de reversão média baseada no canal de Bollinger Bands. Ele vai longo quando o preço quebra abaixo da faixa inferior das Bandas de Bollinger. O stop loss é definido na parte inferior da barra de breakout. O objetivo de lucro é a faixa superior das Bandas de Bollinger.
Estratégia lógica
A estratégia usa um canal de Bollinger Bands de 20 períodos, que consiste de uma banda média, uma banda superior e uma banda inferior. A banda média é uma média móvel simples de 20 períodos. A banda superior é a banda média mais 2 desvios padrão. A banda inferior é a banda média menos 2 desvios padrão.
Quando o preço quebra abaixo da faixa inferior, isso indica que o preço entrou em um estado de sobrevenda. A estratégia irá longo neste ponto. Depois de entrar na posição, o stop loss é definido na parte inferior da barra de entrada, e o objetivo de lucro é a faixa superior. Assim, a estratégia visa capturar o processo de reversão de sobrevenda para a média, a fim de obter lucros.
Análise das vantagens
As vantagens desta estratégia são as seguintes:
- Usar Bandas de Bollinger para julgar o estado de sobrecompra/supervenda, que tem alguma actualidade
- Estratégia de negociação de reversão, evitando perseguir altos e matar baixos
- Estabelecimento razoável do stop loss e do take profit para um melhor controlo do risco
Análise de riscos
Os riscos desta estratégia incluem:
- As bandas de Bollinger não podem determinar perfeitamente as tendências de preços, os breakouts podem falhar
- Crash contínuo do mercado pode atingir stop loss
- Tirar lucro perto da faixa superior tem o risco de alto custo
Orientações de otimização
A estratégia pode ser melhorada pelos seguintes aspectos:
- Otimizar os parâmetros das Bandas de Bollinger para encontrar a melhor combinação
- Adicionar indicadores de filtro para melhorar a precisão de entrada
- Otimizar o stop loss e tirar lucro para maior rentabilidade
Conclusão
A estratégia tem uma lógica clara e é negociável até certo ponto. No entanto, sua eficácia em julgar a sobrecompra / sobrevenda com as Bandas de Bollinger é limitada e não pode determinar perfeitamente a tendência. Além disso, o mecanismo de stop loss e take profit precisa de melhoria.
/*backtest
start: 2023-01-15 00:00:00
end: 2024-01-21 00:00:00
period: 1d
basePeriod: 1h
exchanges: [{"eid":"Futures_Binance","currency":"BTC_USDT"}]
*/

// This source code is subject to the terms of the Mozilla Public License 2.0 at https://mozilla.org/MPL/2.0/
// © Ronsword
//@version=5

strategy("bb 2ND target", overlay=true)

// STEP 1. Create inputs that configure the backtest's date range
useDateFilter = input.bool(true, title="Filter Date Range of Backtest",
     group="Backtest Time Period")
backtestStartDate = input(timestamp("1 Jan 1997"),
     title="Start Date", group="Backtest Time Period",
     tooltip="This start date is in the time zone of the exchange " +
     "where the chart's instrument trades. It doesn't use the time " +
     "zone of the chart or of your computer.")
backtestEndDate = input(timestamp("1 Sept 2023"),
     title="End Date", group="Backtest Time Period",
     tooltip="This end date is in the time zone of the exchange " +
     "where the chart's instrument trades. It doesn't use the time " +
     "zone of the chart or of your computer.")

// STEP 2. See if the current bar falls inside the date range
inTradeWindow = true

// Bollinger Bands inputs
length = input.int(20, title="Bollinger Bands Length")
mult = input.float(2.0, title="Multiplier")
src = input(close, title="Source")
basis = ta.sma(src, length)
dev = mult * ta.stdev(src, length)
upper = basis + dev
lower = basis - dev

// EMA Settings
ema20 = ta.ema(close, 20)
plot(ema20, color=color.blue, title="20 EMA")

// Entry condition
longEntryCondition = ta.crossover(close, lower)

// Define stop loss level as the low of the entry bar
var float stopLossPrice = na
if longEntryCondition
    stopLossPrice := low

// Top Bollinger Band itself is set as the target
topBandTarget = upper

// Enter long position when conditions are met
if inTradeWindow and longEntryCondition
    strategy.entry("Long", strategy.long, qty=1)

// Set profit targets
strategy.exit("ProfitTarget2", from_entry="Long", limit=topBandTarget)

// Set stop loss
strategy.exit("StopLoss", stop=stopLossPrice)

// Plot Bollinger Bands with the same gray color
plot(upper, color=color.gray, title="Upper Bollinger Band")
plot(lower, color=color.gray, title="Lower Bollinger Band")
- Estratégia de tendência de alta multi-EMA
- Estratégia de negociação sazonal híbrida do S&P500
- Estratégia de acompanhamento da tendência baseada em desvios
- RSI Divergência Estratégia de negociação
- Estratégia de árvore de decisão multi-indicador: IMACD, EMA e Ichimoku
- Estratégia de negociação de dupla otimização do MACD
- Estratégia de dupla cruz de ouro da EMA
- Estratégia de negociação do RSI e da média móvel de vários prazos
- Estratégia semanal de negociação swing
- Estratégia de negociação MACD baseada no EVWMA
- Estratégia quantitativa de acompanhamento das tendências baseada em múltiplos indicadores técnicos
- Estratégia de negociação quantitativa de combinação RSI e CCI
- Estratégia de negociação de tendências de DCA de baixo risco
- Estratégia de Momentum Estocástico
- Estratégia de acompanhamento da tendência do oscilador de impulso
- Média móvel de sobreposição de atraso zero com estratégia de negociação de saída Chandelier
- RSI 5 Estratégia de negociação de momento
- Estratégia de vetor normalizada em escala com funções de ativação, vers.4
- Tendência Seguindo Estratégia Baseada em Altíssimo Histórico
- Tendência de criptomoeda seguindo estratégia baseada em Heiken Ashi