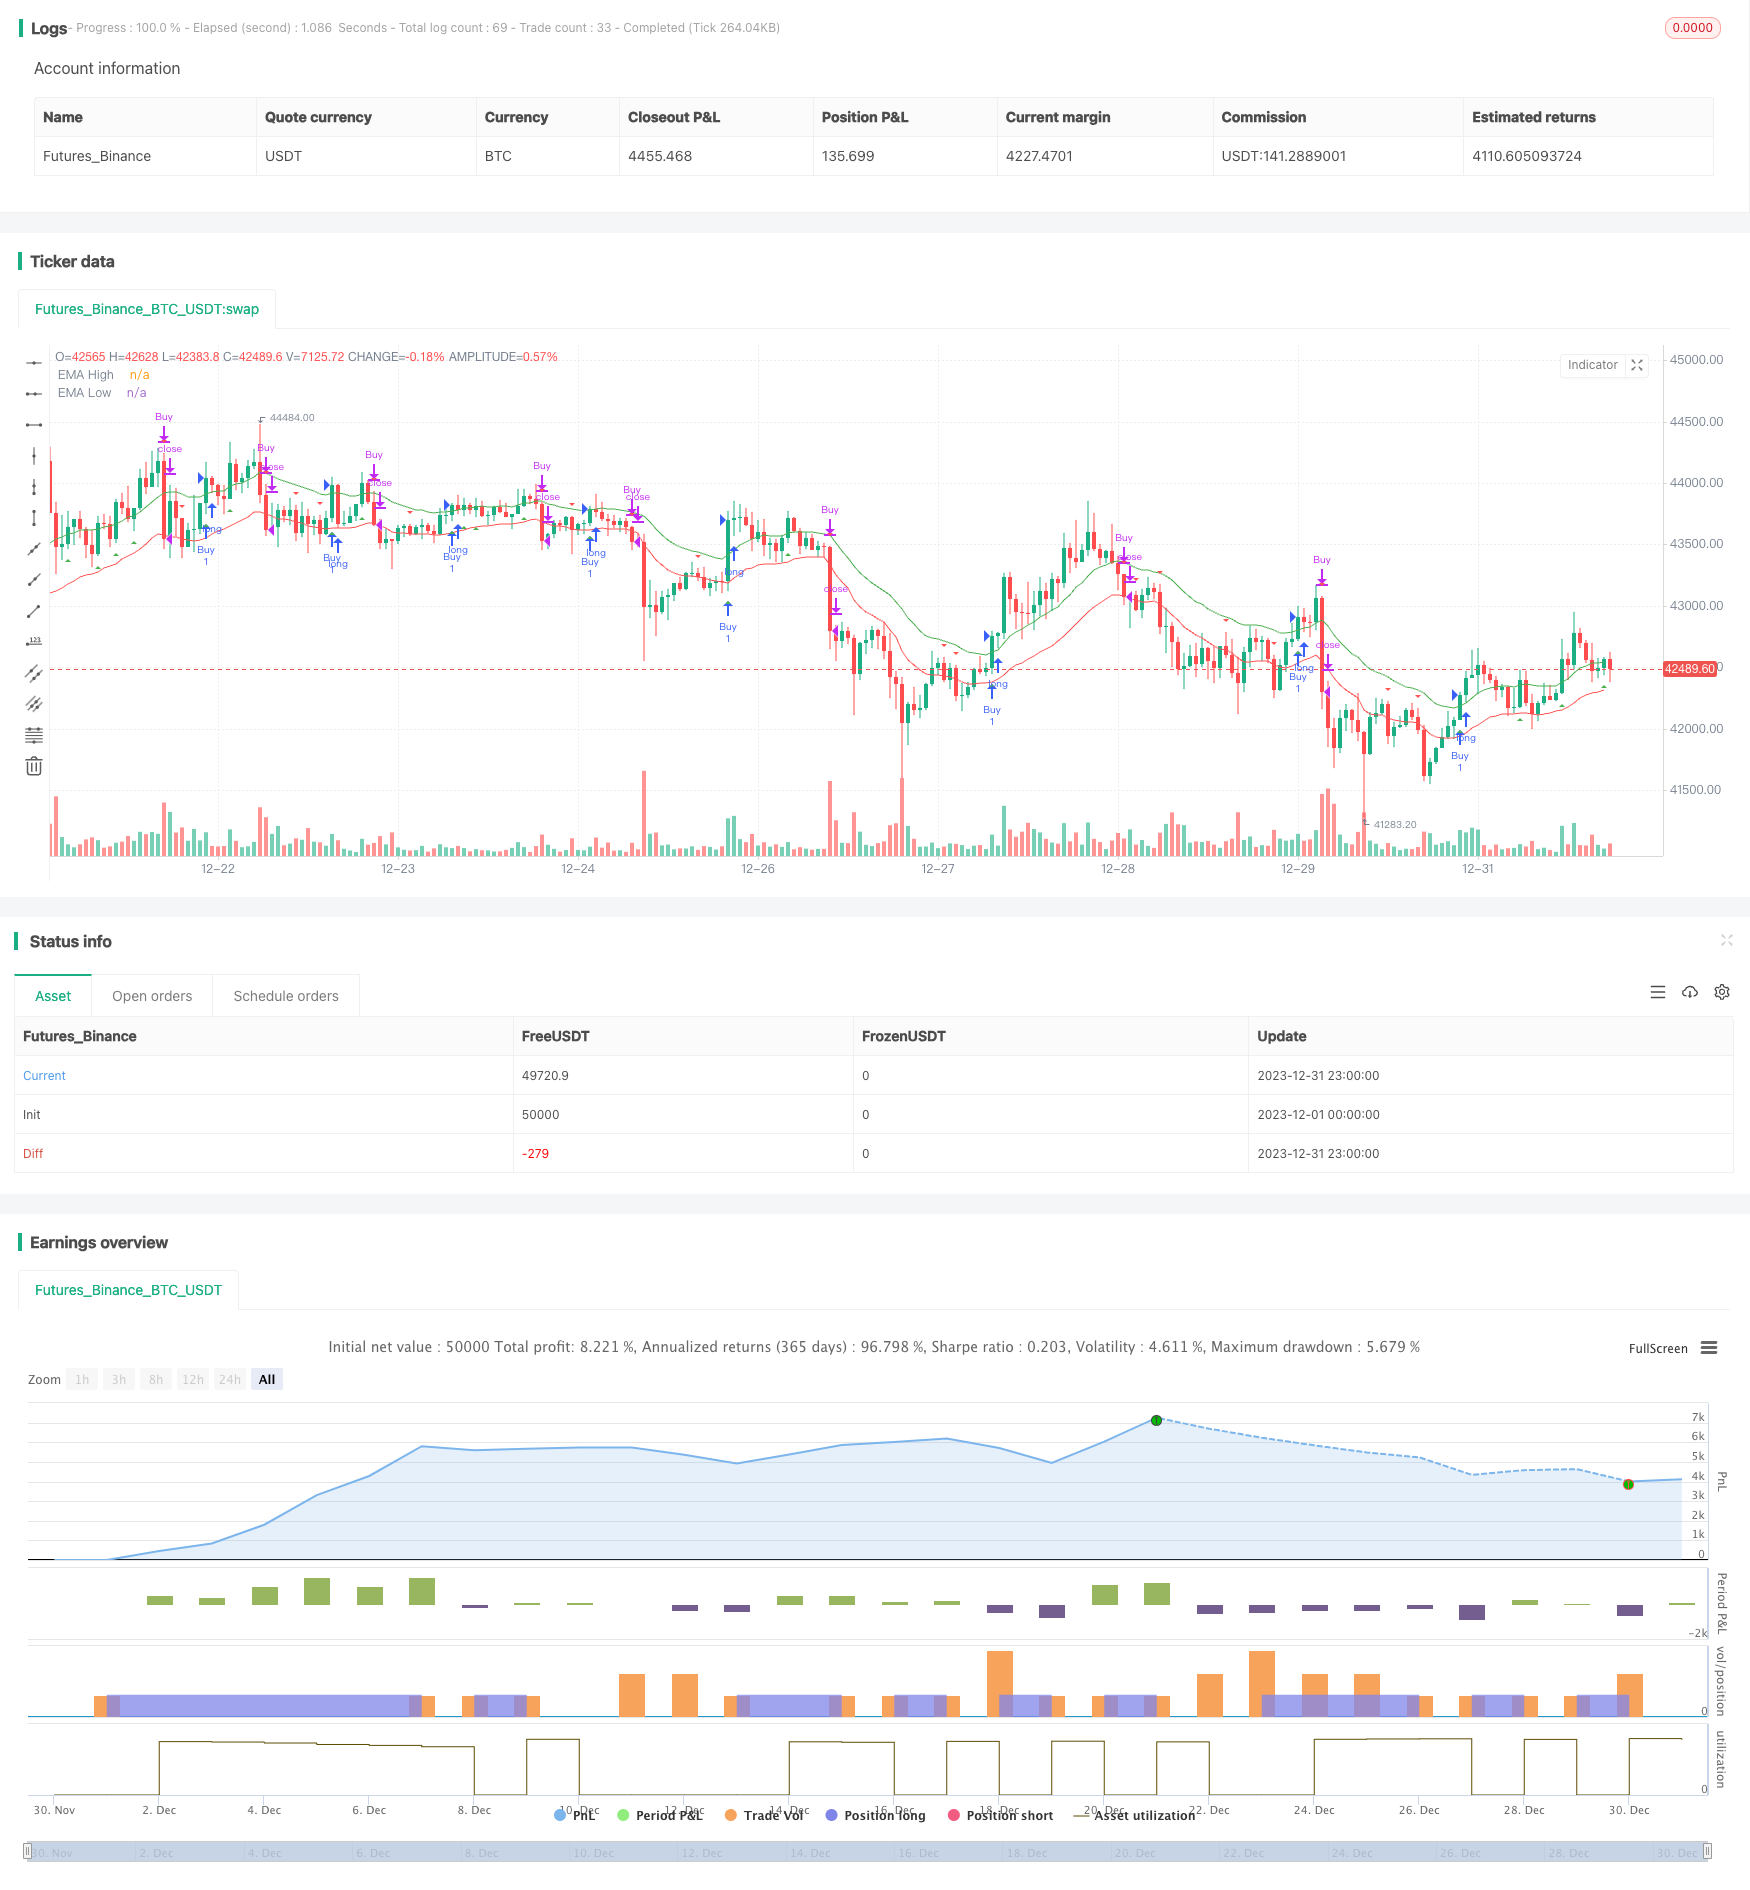
Tudo sobre a estratégia de negociação do canal da EMA
Autora:ChaoZhang, Data: 2024-01-30 15:24:07Tags:

Resumo
Esta estratégia constrói um canal baseado em linhas de média móvel exponencial (EMA) de 20 dias, vai longo quando o preço atravessa a faixa superior e vai curto quando o preço atravessa a faixa inferior.
Estratégia lógica
- Calcule a EMA de 20 dias para construir o canal.
- Vá longo quando o preço de fechamento estiver acima da EMA de 20 dias.
- Faça curto quando o preço de fechamento estiver abaixo do mínimo da EMA de 20 dias.
- Defina o stop loss para o outro lado do canal, por exemplo, EMA de 20 dias para negociações longas.
Análise das vantagens
- O canal da EMA acompanha eficazmente a tendência.
- O parâmetro EMA de 20 dias é simples e prático.
- Os sinais de ruptura ajudam a reduzir os negócios errados.
- A definição de stop loss controla os riscos de forma razoável.
Análise de riscos
- Os sinais de fuga podem ter falsos positivos.
- São propensos a ser interrompidos no mercado limitado.
- Parâmetros inadequados levam a hipersensibilidade ou lentidão.
Gestão de riscos:
- Adicionar filtros com outros indicadores.
- Otimizar parâmetros para diferentes ciclos.
- Negocie com cautela e administre o capital com cuidado.
Optimização
- Adicionar filtros com indicadores de volume ou de momento.
- Teste a eficácia de diferentes períodos de EMA.
- Adicione o trailing stop para garantir lucros.
- Combinar medidas de volatilidade para determinar a força da tendência.
Resumo
Esta é uma estratégia simples e prática de construir um canal EMA para seguir tendências. Ele tem sinais de ruptura, mas também riscos de falsos sinais. A estratégia pode ser melhorada otimizando parâmetros e adicionando filtros. Vale a pena testar e aprimorar ainda mais.
/*backtest
start: 2023-12-01 00:00:00
end: 2023-12-31 23:59:59
period: 1h
basePeriod: 15m
exchanges: [{"eid":"Futures_Binance","currency":"BTC_USDT"}]
*/

//@version=4
strategy("EMA Channel Strategy with Alerts", shorttitle="EMA Channel", overlay=true)

// Define EMA length
emaLength = 20

// Calculate EMA values
emaHigh = ema(high, emaLength)
emaLow = ema(low, emaLength)

// Define the condition for a buy signal
buyCondition = crossover(close, emaHigh)

// Define the condition for a sell signal
sellCondition = crossunder(close, emaLow)

// Plot the EMA lines
plot(emaHigh, color=color.green, title="EMA High")
plot(emaLow, color=color.red, title="EMA Low")

// Plot buy and sell signals
plotshape(buyCondition, style=shape.triangleup, location=location.belowbar, color=color.green, title="Buy Signal")
plotshape(sellCondition, style=shape.triangledown, location=location.abovebar, color=color.red, title="Sell Signal")

// Strategy
strategy.entry("Buy", strategy.long, when=buyCondition)
strategy.close("Buy", when=sellCondition)

// Define and trigger alerts
alertcondition(buyCondition, title="Buy Alert", message="Buy signal - Price crossed above EMA High")
alertcondition(sellCondition, title="Sell Alert", message="Sell signal - Price crossed below EMA Low")
Mais.
- Tendência seguindo uma estratégia baseada na média móvel adaptativa
- Estratégia de média móvel de movimento relativo verdadeiro
- Estratégia de negociação de impulso de 5 minutos baseada no MACD e no RSI
- Estratégia de ruptura fractal dupla
- Noro mudou a estratégia de stop loss da média móvel
- Estratégia de negociação de média móvel exponencial dupla RSI
- Estratégia de cruzamento de média móvel simples
- Estratégia de scalping baseada na liquidez e na tendência do mercado
- Estratégia 5EMA de reversão de avanços transfronteiriços a curto prazo
- Estratégia de pirâmide de negociação de ações baseada no indicador RSI
- Estratégia de negociação de RSI de dois andares
- As bandas de Bollinger e a estratégia de combinação do RSI
- Estratégia de barra e tendência dupla
- Estratégia incrível de ruptura de preço
- Estratégia de prossecução da tendência robusta
- Estratégia de cruzamento da média móvel de rastreamento de tendências
- Modelo de reversão de ruptura baseado na estratégia de negociação de tartarugas
- Estratégia de tendência de impulso
- O valor da posição em risco deve ser calculado em função do valor da posição em risco.
- Estratégia de negociação de ações equilibrada baseada no RSI