Стратегия обратного теста простых чисел
Автор:Чао Чжан, Дата: 2024-01-08 11:54:52Тэги:

Обзор
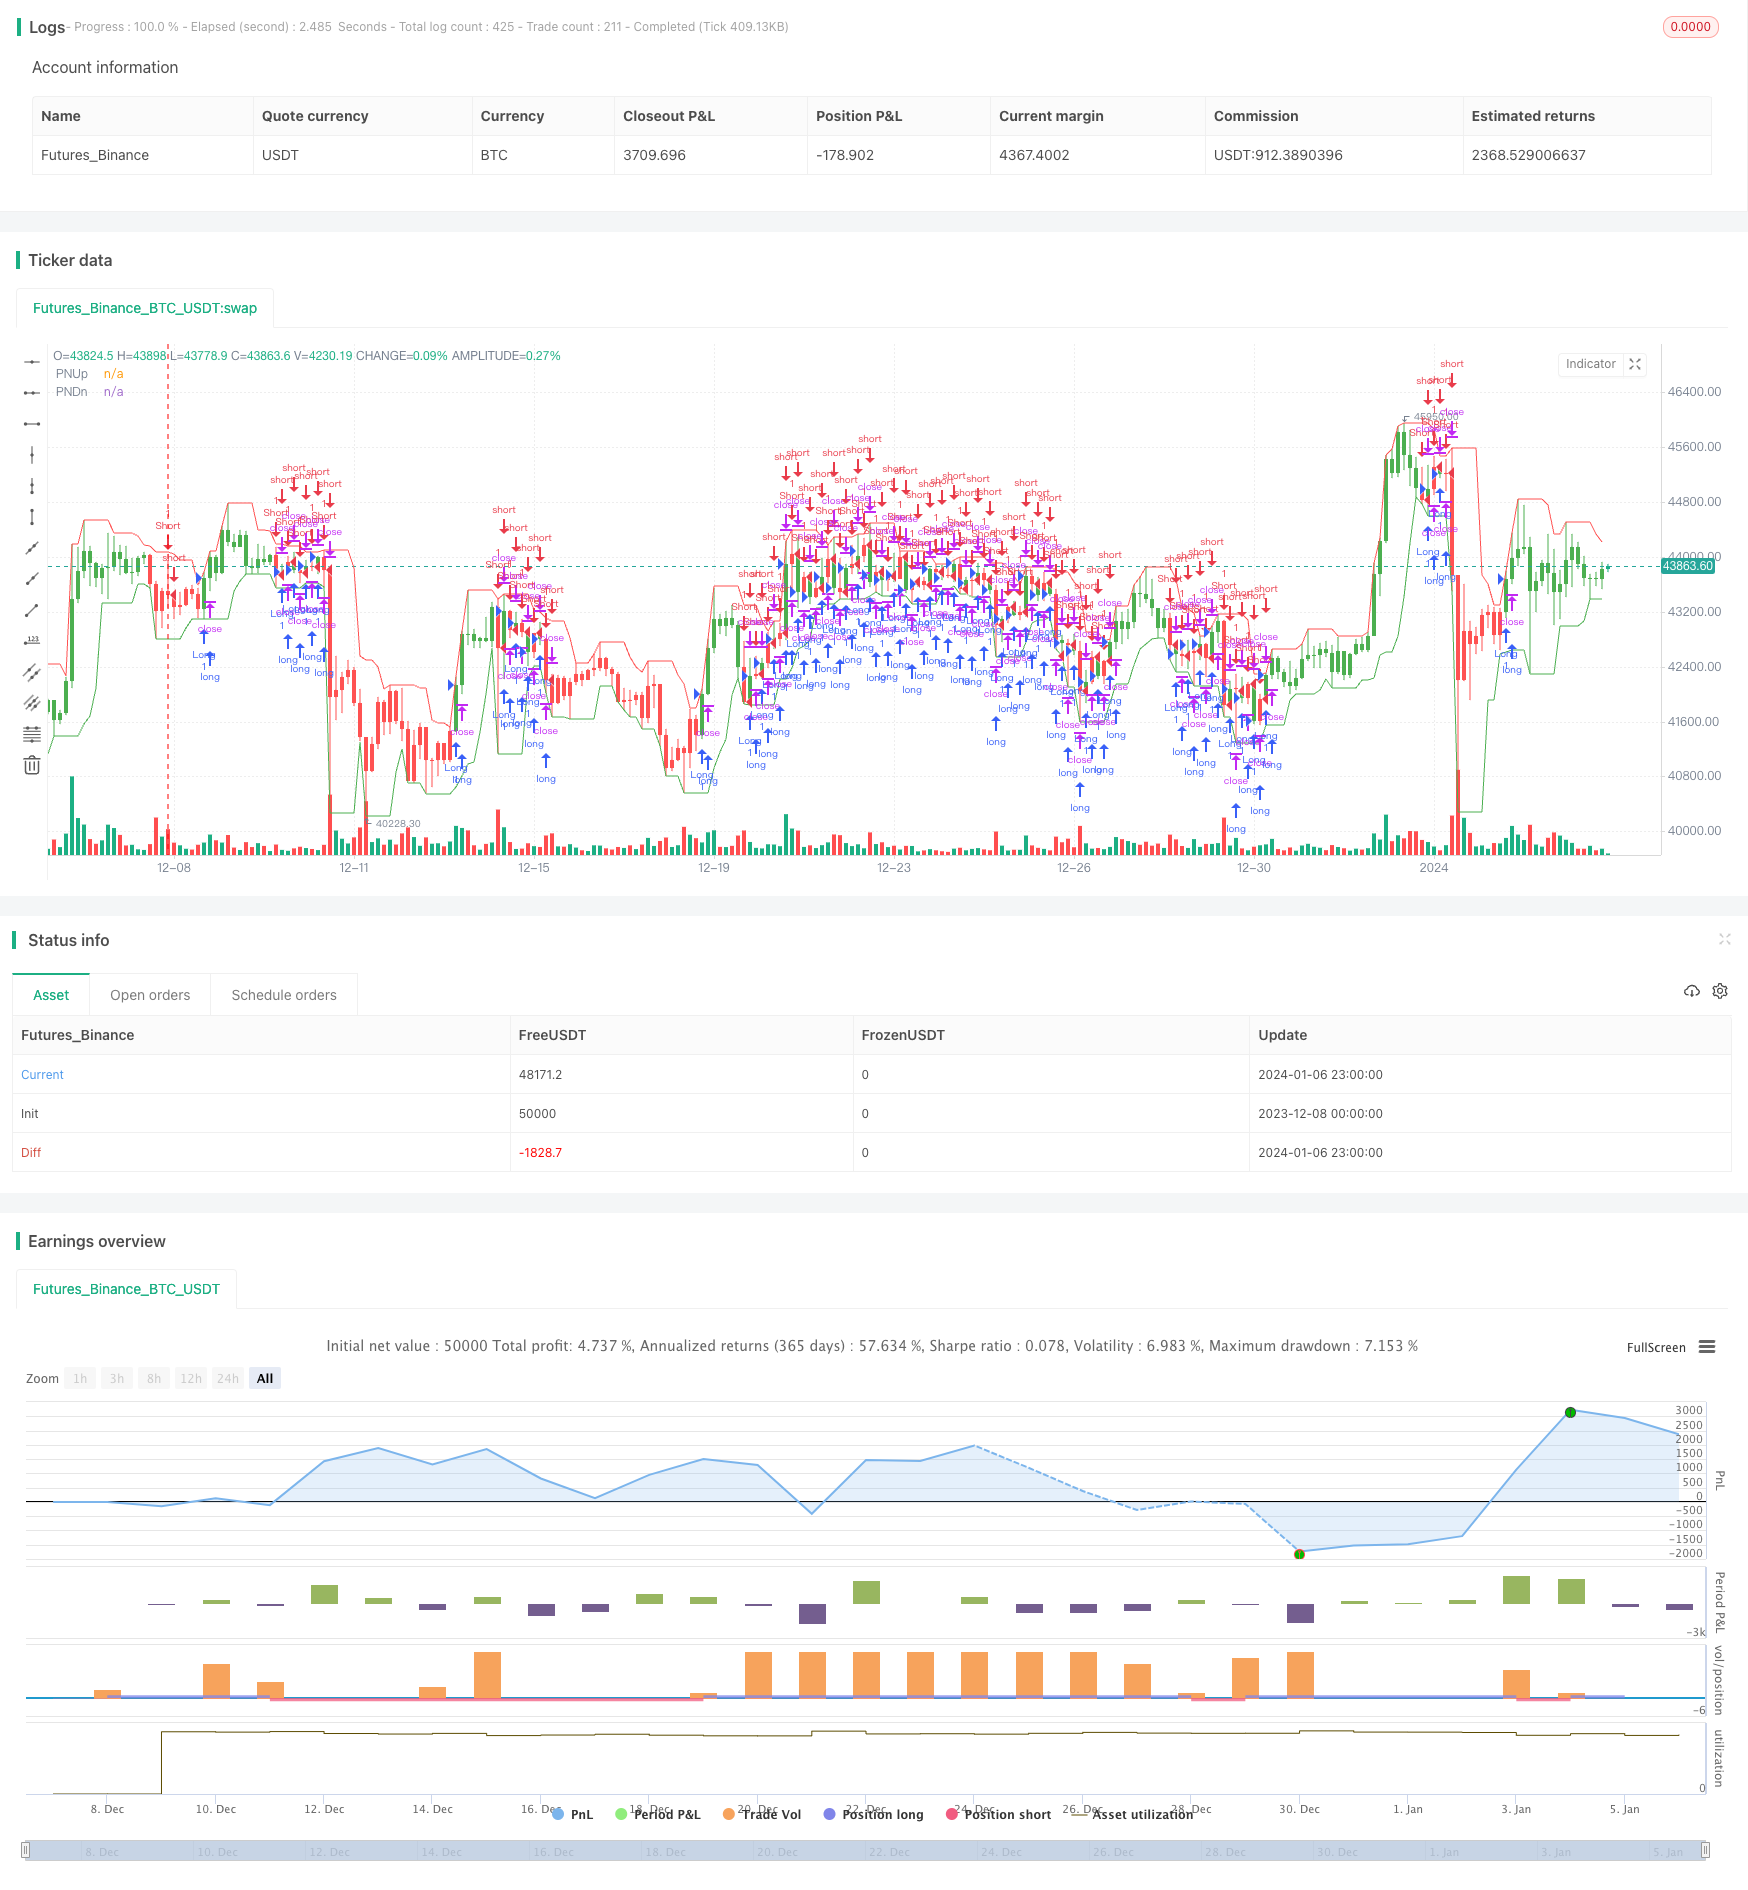
Стратегия обратного теста простых чисел оценивает рыночные тенденции путем выявления самых высоких и самых низких простых чисел вокруг цены и составления этих двух рядов простых чисел в виде диапазона.
Логика стратегии
- Пройдите через определенный диапазон колебаний цен на основе процента допустимости ввода, чтобы найти наиболее высокие и наименьшие простые числа.
- Используйте самые высокие и самые низкие функции, чтобы получить самые высокие и самые низкие точки диапазонов простых чисел в самых последних N-листах.
- Определить длинное или короткое направление на основе того, проходит ли цена закрытия через самые высокие и низкие точки диапазонов простых чисел.
- Можно выбрать обратный торговый сигнал.
Анализ преимуществ
- Зафиксировать случайность рынка с использованием случайных и неправильных характеристик распределения простых чисел.
- В диапазоне простых чисел есть определенное отставание, которое может отфильтровать шум.
- Верхние и нижние пределы диапазонов простых чисел гибки и могут быть скорректированы с помощью процента допустимости для адаптации к различным циклам и различным видам торговли.
Анализ рисков
- Диапазоны простых чисел не могут полностью соответствовать движению цен и имеют определенную степень отставания.
- Обратные ценовые колебания из-за экстремальных показателей могут привести к неправильным сигналам.
- Слишком большие допустимые проценты фильтруют некоторые действительные сигналы.
Рисков можно избежать путем правильной корректировки параметров, сочетания с другими показателями и т.д.
Руководство по оптимизации
- Установка двойных условий для запуска сигналов путем сочетания простых скользящих средних и других индикаторов.
- Исследуйте использование других случайных чисел, таких как числа Фибоначчи.
- Внедрение алгоритмов машинного обучения для автоматической оптимизации параметров.
Резюме
Стратегия обратного теста простых чисел в целом является очень инновационной стратегией с практической ценностью. Она использует характеристики простых чисел для улавливания случайности рынка, а также учитывает ценовое отставание при определении тенденций, что очень полезно для исследований. Следующими шагами являются оптимизация из аспектов улучшения качества сигнала, расширение типов случайных чисел, автоматическая оптимизация и т. Д., Чтобы сделать эффект стратегии более замечательным.
/*backtest
start: 2023-12-08 00:00:00
end: 2024-01-07 00:00:00
period: 3h
basePeriod: 15m
exchanges: [{"eid":"Futures_Binance","currency":"BTC_USDT"}]
*/

//@version=2
////////////////////////////////////////////////////////////
//  Copyright by HPotter v1.0 27/03/2018
// Determining market trends has become a science even though a high number
// or people still believe it’s a gambling game. Mathematicians, technicians,
// brokers and investors have worked together in developing quite several
// indicators to help them better understand and forecast market movements.
// The Prime Number Bands indicator was developed by Modulus Financial Engineering
// Inc. This indicator is charted by indentifying the highest and lowest prime number
// in the neighborhood and plotting the two series as a band.
//
// You can change long to short in the Input Settings
// WARNING:
//  - For purpose educate only
//  - This script to change bars colors.
////////////////////////////////////////////////////////////
PrimeNumberUpBand(price, percent) =>
    res = 0
    res1 = 0
    for j = price to price + (price * percent / 100)
        res1 := j
	    for i = 2 to sqrt(price)
        	res1 := iff(j % i == 0 , 0, j)
            if res1 == 0
                break
		if res1 > 0
		    break
    res := iff(res1 == 0, res[1], res1)
    res

PrimeNumberDnBand(price, percent) =>
    res = 0
    res2 = 0
    for j = price to price - (price * percent / 100)
        res2 := j
	    for i = 2 to sqrt(price)
        	res2 := iff(j % i == 0 , 0, j)
            if res2 == 0
                break
		if res2 > 0
		    break
    res := iff(res2 == 0, res[1], res2)
    res

strategy(title="Prime Number Bands Backtest", overlay = true)
percent = input(5, minval=0.01, step = 0.01, title="Tolerance Percentage")
Length = input(5, minval=1)
srcUp = input(title="Source Up Band",  defval=high)
srcDn = input(title="Source Down Band",  defval=low)
reverse = input(false, title="Trade reverse")
xPNUB = PrimeNumberUpBand(srcUp, percent)
xPNDB = PrimeNumberDnBand(srcDn, percent)
xHighestPNUB = highest(xPNUB, Length)
xLowestPNUB = lowest(xPNDB, Length)
pos = iff(close > xHighestPNUB[1], 1,
       iff(close < xLowestPNUB[1], -1, nz(pos[1], 0)))
possig = iff(reverse and pos == 1, -1,
          iff(reverse and pos == -1, 1, pos))
if (possig == 1)
    strategy.entry("Long", strategy.long)
if (possig == -1)
    strategy.entry("Short", strategy.short)
barcolor(possig == -1 ? red: possig == 1 ? green : blue )
plot(xHighestPNUB, color=red, title="PNUp")
plot(xLowestPNUB, color=green, title="PNDn")
- Стратегия перекрестного сигнала скользящей средней
- Стратегия сдерживания прибыли и сдерживания потерь на основе EMA 200
- Стратегия высокочастотного арбитража
- Стратегия прорыва двойной скользящей средней колебания
- Стратегия адаптивной волатильности
- Стратегия SuperTrend для торговли Ethereum
- Показатели EMA и MACD следуют стратегии
- Стратегия комбинирования многократных кроссоверов Turtle и взвешенной скользящей средней и MACD и TSI
- Стратегия импульса на основе перекрестного использования DEMA и EMA с фильтром волатильности ATR
- Последовательная стратегия вверх/вниз с обратным и SL/TP расширением
- Стратегия торговли с быстро колеблющимися показателями RSI
- Одноэкспоненциальная сглаженная скользящая средняя с последующим трендом остановки потери
- Покупать с низкой волатильностью VS покупать с высокой волатильностью
- Стратегия перекрестного использования экспоненциальной скользящей средней
- Стратегия стоп-лосса с несколькими временными рамками
- Индикатор ТСИ "Двойные передвижные окна" импульса
- Прибыльная стратегия RSI и полос Боллинджера
- Стратегия покупки/продажи по ценовому курсу
- Стратегия Supertrend Take Profit
- Тенденция ценового канала в соответствии со стратегией