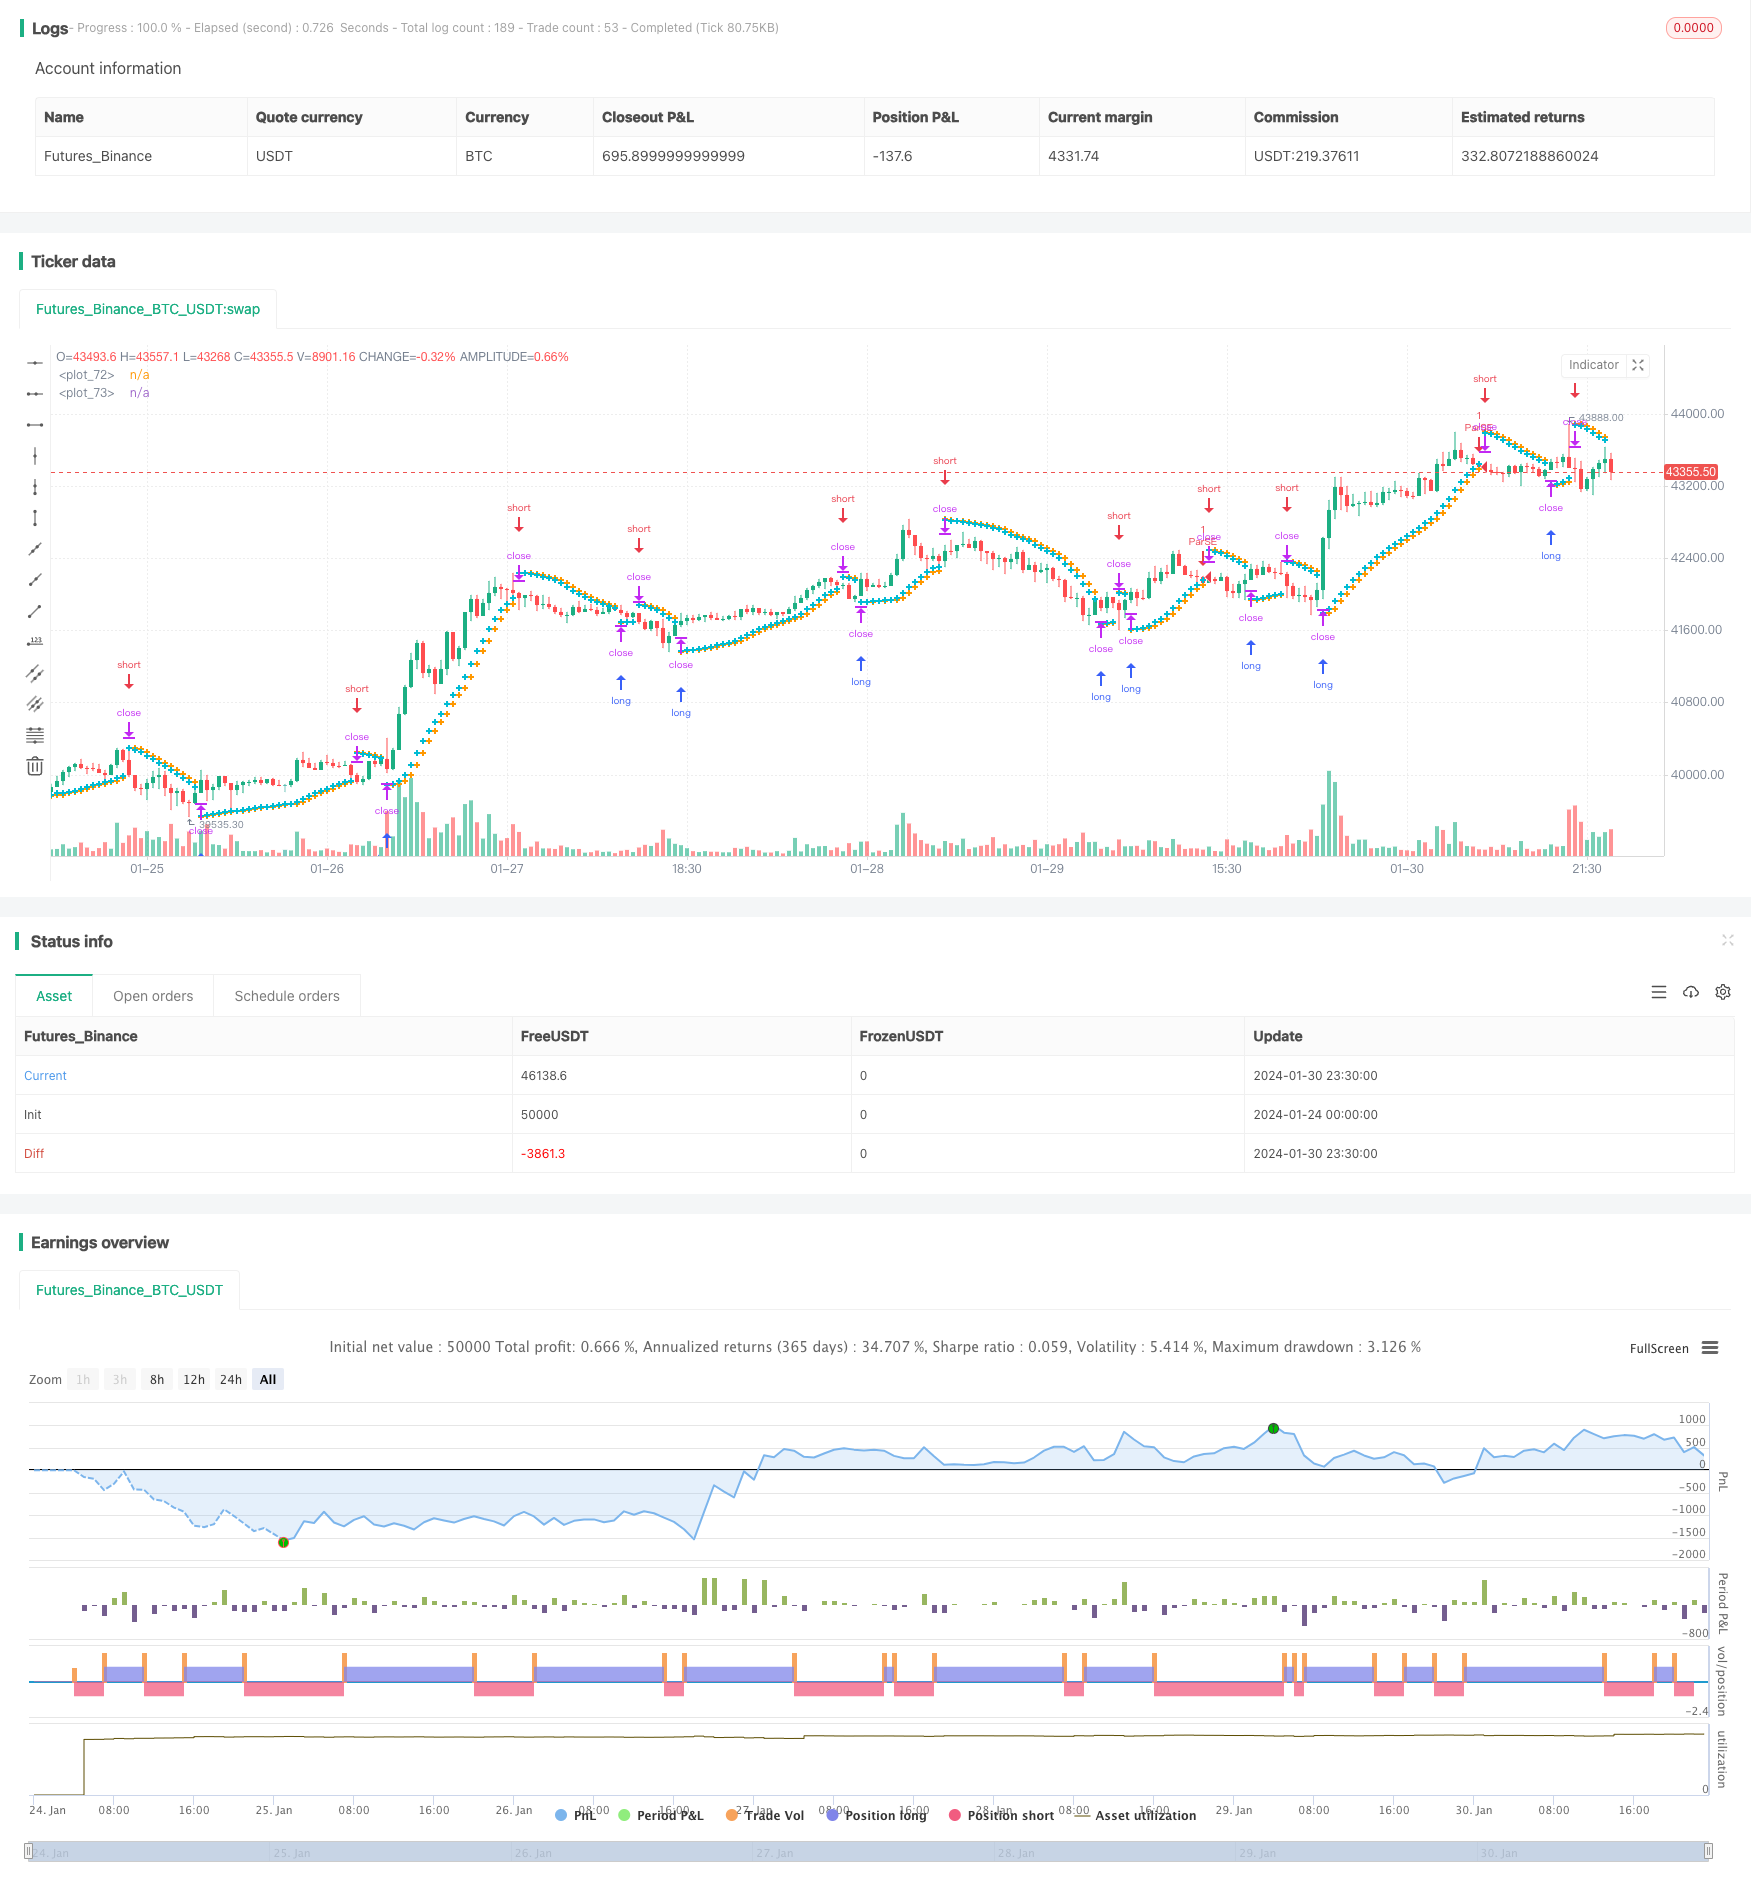
Параболическая стратегия SAR для отслеживания тренда и отмены стоп-лосса
Автор:Чао Чжан, Дата: 2024-02-01 14:54:09Тэги:

Обзор
Стратегия параболического SAR для отслеживания тренда - это стратегия, которая использует индикатор параболического SAR для выявления тенденций и ввода позиций против тренда при изменении тренда.
Логика стратегии
Стратегия использует индикатор Parabolic SAR для оценки текущей тенденции на рынке. Parabolic SAR означает
Когда точки SAR падают и ниже цены, это представляет собой бычью тенденцию; когда точки SAR растут и выше цены, это представляет собой медвежий тренд. Стратегия оценивает текущее направление тренда на основе расположения точек SAR
В частности, когда точки SAR показывают восходящий тренд и выше цены, стратегия будет короткой; когда точки SAR показывают нисходящий тренд и ниже цены, стратегия будет длинной.
Кроме того, стратегия также устанавливает механизмы остановки потерь и получения прибыли. Когда вы идете на длинный курс, она может установить цену остановки потерь для ограничения потерь; в то же время она может установить цену получения прибыли для закрытия позиций после достижения определенной целевой прибыли.
Анализ преимуществ
Основными преимуществами сочетания индикатора тренда и механизмов стоп-лосс/приобретения прибыли являются:
- Своевременное отслеживание возможностей обратного тренда для торговли с противоположным трендом.
- Активно контролируйте риски и прибыль, устанавливая стоп-лосс и прибыль.
- Параболический SAR является широко используемым и эффективным обратным индикатором.
- Простые и понятные правила стратегии, легко понятные и реализуемые.
Анализ рисков
Есть также некоторые риски, которые следует отметить для стратегии:
- Параболический SAR индикатор не идеален, иногда он генерирует неправильные сигналы.
- Стоп-лосс и цены на получение прибыли должны устанавливаться разумно, иначе они могут быть преждевременно остановлены или получены.
- Торговые комиссии также влияют на общую прибыль.
- Новая тенденция после переворота может быть недолгой.
Эти риски могут быть решены путем оптимизации параметров, использования других показателей фильтра и т.д.
Руководство по оптимизации
Стратегия может быть оптимизирована в следующих аспектах:
- Оптимизируйте параметры параболического SAR, чтобы найти лучшую комбинацию.
- Попробуйте другие стратегии стоп-лосса и примите стратегии прибыли, такие как отставание стоп-лосса.
- Добавить индикаторы или условия для фильтрации обратных торговых сигналов.
- Добавьте контроль позиций на основе рыночных условий.
- Корректировка параметров для различных торговых инструментов.
Заключение
В целом, это довольно классическая стратегия отслеживания тренда, которая позволяет идентифицировать изменение тренда, а также контролировать риски с помощью средств стоп-лосса и прибыли.
/*backtest
start: 2024-01-24 00:00:00
end: 2024-01-31 00:00:00
period: 30m
basePeriod: 15m
exchanges: [{"eid":"Futures_Binance","currency":"BTC_USDT"}]
*/

//@version=4
strategy("Parabolic SAR Strategy", overlay=true)
start = input(0.02)
increment = input(0.02)
maximum = input(0.2)
var bool uptrend = na
var float EP = na
var float SAR = na
var float AF = start
var float nextBarSAR = na
if bar_index > 0
	firstTrendBar = false
	SAR := nextBarSAR
	if bar_index == 1
		float prevSAR = na
		float prevEP = na
		lowPrev = low[1]
		highPrev = high[1]
		closeCur = close
		closePrev = close[1]
		if closeCur > closePrev
			uptrend := true
			EP := high
			prevSAR := lowPrev
			prevEP := high
		else
			uptrend := false
			EP := low
			prevSAR := highPrev
			prevEP := low
		firstTrendBar := true
		SAR := prevSAR + start * (prevEP - prevSAR)
	if uptrend
		if SAR > low
			firstTrendBar := true
			uptrend := false
			SAR := max(EP, high)
			EP := low
			AF := start
	else
		if SAR < high
			firstTrendBar := true
			uptrend := true
			SAR := min(EP, low)
			EP := high
			AF := start
	if not firstTrendBar
		if uptrend
			if high > EP
				EP := high
				AF := min(AF + increment, maximum)
		else
			if low < EP
				EP := low
				AF := min(AF + increment, maximum)
	if uptrend
		SAR := min(SAR, low[1])
		if bar_index > 1
			SAR := min(SAR, low[2])
	else
		SAR := max(SAR, high[1])
		if bar_index > 1
			SAR := max(SAR, high[2])
	nextBarSAR := SAR + AF * (EP - SAR)
	if barstate.isconfirmed
		if uptrend
			strategy.entry("ParSE", strategy.short, stop=nextBarSAR, comment="ParSE")
			strategy.cancel("ParLE")
		else
			strategy.entry("ParLE", strategy.long, stop=nextBarSAR, comment="ParLE")
			strategy.cancel("ParSE")
plot(SAR, style=plot.style_cross, linewidth=3, color=color.orange)
plot(nextBarSAR, style=plot.style_cross, linewidth=3, color=color.aqua)
//Stop Loss Inputs
use_short_stop_loss = input(false, title="Short Stop Loss", group="Stop Loss and Take Profit", inline="Short_SL")
short_stop_loss = input(title="(%)", type=input.float, minval=0.0, step=0.1,
     defval=5, group="Stop Loss and Take Profit", inline="Short_SL") * 0.01
use_long_stop_loss = input(false, title="Long Stop Loss", group="Stop Loss and Take Profit", inline="Long_SL")
long_stop_loss = input(title="(%)", type=input.float, minval=0.0, step=0.1,
     defval=5, group="Stop Loss and Take Profit", inline="Long_SL") * 0.01

//Take Profit Inputs
use_short_take_profit = input(false, title="Short Take Profit", group="Stop Loss and Take Profit", inline="Short_TP")
short_take_profit = input(title="(%)", type=input.float, minval=0.0, step=0.1,
     defval = 20, group="Stop Loss and Take Profit", inline="Short_TP") * .01
use_long_take_profit = input(false, title="Long Take Profit", group="Stop Loss and Take Profit", inline="Long_TP")
long_take_profit = input(title="(%)", type=input.float, minval=0.0, step=0.1,
     defval = 20, group="Stop Loss and Take Profit", inline="Long_TP") * .01


longStopPrice  = strategy.position_avg_price * (1 - long_stop_loss)
shortStopPrice = strategy.position_avg_price * (1 + short_stop_loss)
longLimitPrice = strategy.position_avg_price * (1 + long_take_profit)
shortLimitPrice = strategy.position_avg_price * (1 - short_take_profit)


if (strategy.position_size > 0.0)
    if (use_long_stop_loss and not use_long_take_profit)
        strategy.exit("Long", stop = longStopPrice)
    if (use_long_take_profit and not use_long_stop_loss)
        strategy.exit("Long", limit = longLimitPrice)
    if (use_long_take_profit and use_long_stop_loss)
        strategy.exit("Long", stop = longStopPrice, limit=longLimitPrice)
if (strategy.position_size < 0.0)
    if (use_short_stop_loss and not use_short_take_profit)
        strategy.exit("Short", stop = shortStopPrice)
    if (use_short_take_profit and not use_short_stop_loss)
        strategy.exit("Short", limit = shortLimitPrice)
    if (use_short_take_profit and use_short_stop_loss)
        strategy.exit("Short", stop = shortStopPrice, limit = shortLimitPrice)

//plot(strategy.equity, title="equity", color=color.red, linewidth=2, style=plot.style_areabr)
- Стратегия SuperTrend
- Комбинированная стратегия перемещения стоп-лосса с параболическим периодом и полосой Боллинджера
- Стратегия торговли на основе скользящей средней цены
- Конвергенционная стратегия торговли по направлению эрготического импульса
- Стратегия торговли скользящей средней и стохастической
- Оптимизация двойной скользящей средней тенденции по стратегии, основанной на комбинации индикаторов
- Эффективная стратегия торговли количеством
- Стратегия комбинирования двойной скользящей средней и индикатора Уильямса
- Стратегия "Серебряная линия"
- Контрастная стратегия волатильности RWI
- Стратегия перекрестного использования индикаторов импульса
- Эффективная стратегия двойного остановки прибыли и остановки убытков с прорывом колебания
- Стратегия двойного выхода
- Стратегия торговли сетью на основе отслеживания K-линии в режиме реального времени
- Стратегия выхода из кризиса
- Многоциклическая стратегия прогнозирования адаптивных тенденций
- Стратегия реверсии тренда Renko ATR
- Ичимоку облака Квантовая стратегия
- Двухнаправленная стратегия отслеживания тренда на основе прорыва диапазона
- Стратегия торговли криптовалютами на основе MACD и стохастических индикаторов